Analysis: EU’s CO2 emissions fall 5% in three months after post-Covid surge
Lauri Myllyvirta
11.03.22Lauri Myllyvirta
03.11.2022 | 12:01amThe EU’s emissions of carbon dioxide (CO2) from energy use have fallen by 5% over the past three months compared with the same period in 2021, new analysis shows.
The analysis for Carbon Brief is based on a new near-real-time emissions tracker developed by the Centre for Research on Energy and Clean Air (CREA). It shows the recent fall in emissions has brought to an end a 16-month surge that began in the wake of the Coronavirus pandemic.
The tracker draws on real-time data from the EU electricity and gas transparency platforms, as well as on monthly Eurostat data on oil consumption. It shows demand for fossil fuels is falling due to high prices and strong wind and solar output, contrary to fears of a resurgence due to the energy crisis.
EU markets are responding with a surge in renewables, heat pumps and electric vehicles. EU governments have also raised their ambition on the transition to low-carbon energy.
The new analysis shows the energy crisis is already starting to push down EU emissions. The response from markets and governments suggests this trend is likely to accelerate.
EU CO2 emissions are falling
The Coronavirus pandemic swept around the world starting in early 2020, leading to millions of deaths and the suspension of day-to-day economic activity.
These lockdowns had a huge and immediate impact on emissions, which fell by a record amount in 2020. But the drop was temporary and emissions surged back as economies reopened.
The rebound from the pandemic has been followed by a global energy crisis after Russia’s invasion of Ukraine in March 2022 and its weaponisation of gas supplies to Europe.
With many countries looking to coal and other domestic supplies to shore up their energy security, there have been suggestions that emissions could increase once again.
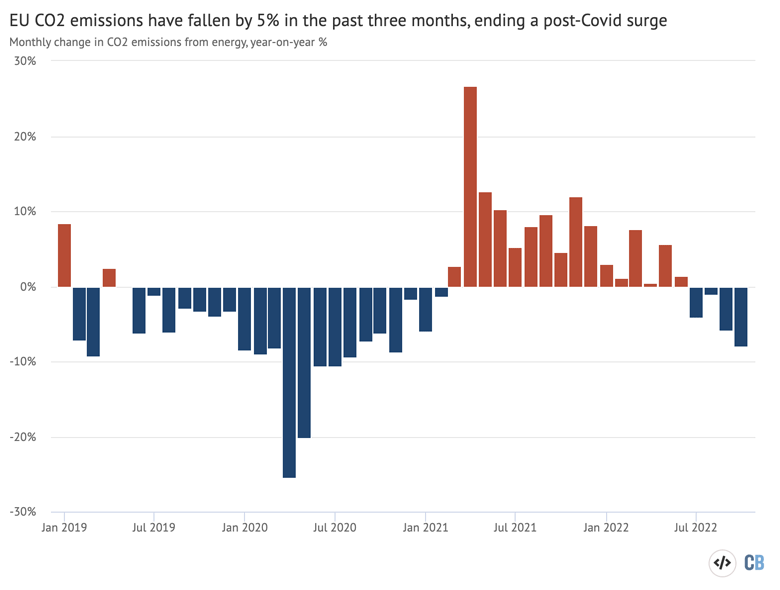
However, the new analysis of EU emissions in near real-time proves the opposite is the case, with the bloc’s CO2 output having declined by 5% in the most recent three-month period. The fall accelerated to 8% in October.
This is shown in the chart below, which also illustrates the drop and rebound from the Coronavirus pandemic in 2020 and 2021.
Where and why emissions are falling
The factors underlying the overall trend in EU emissions vary from sector to sector.
Emissions from transport and electricity started rebounding from the Covid-19 lows in the summer of 2020. From March 2021 until July 2022, their CO2 emissions increased year-on-year every month.
The increase was compounded by the underperformance of nuclear and hydropower (see the graph on power generation below), and a major heatwave in the summer, which boosted demand for power from fossil fuels (see the graph on cooling needs).
The increase in CO2 emissions has now reversed as high fossil fuel prices have suppressed electricity and gas demand, particularly in industry and households. This is shown in the figure below, with emissions from coal power and gas outside the power sector showing particularly notable decreases relative to a year earlier.
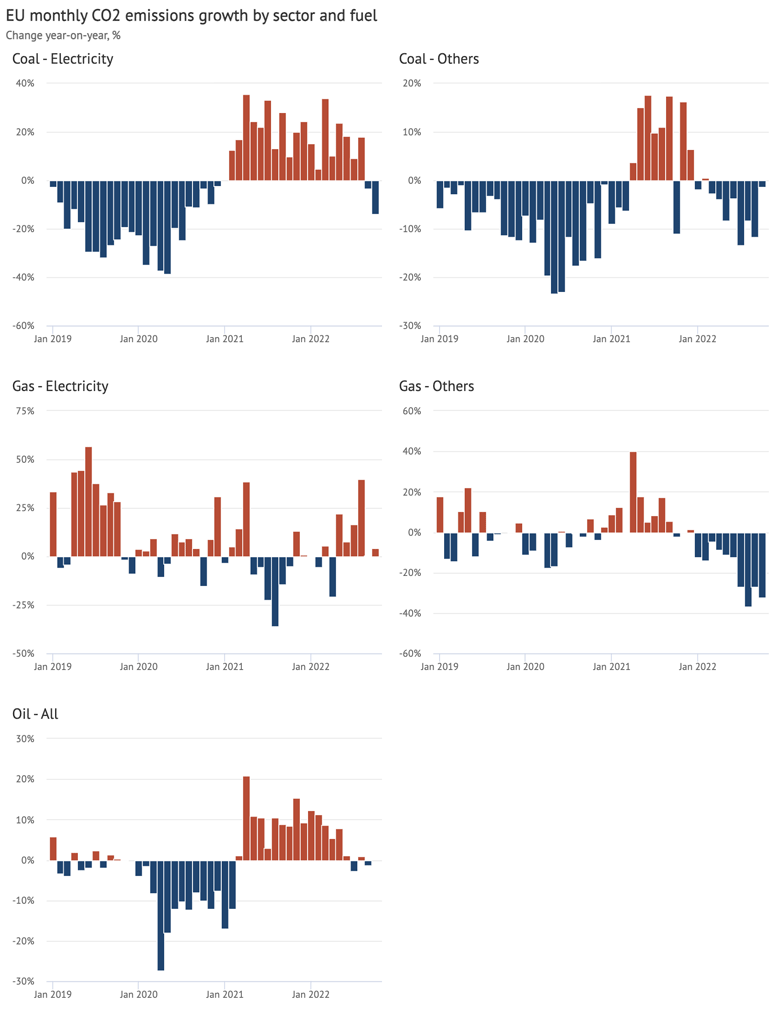
High prices and the resulting drop in spending power are also affecting oil demand, reflected in the broadly stable emissions from this fuel since July, seen in the figure above.
In the power sector, explored in more detail below, growth in solar power capacity has delivered substantial additional generation. In September-October 2022, hydropower generation normalised and good wind conditions offset the need for fossil fuels. Meanwhile, the major drop in nuclear power generation was arrested.
Misconceptions around EU emissions trends
Importantly, neither the fall in power generation from coal and gas in September-October, nor the steepening fall in gas consumption in industry and households since July, can be accounted for by the weather alone.
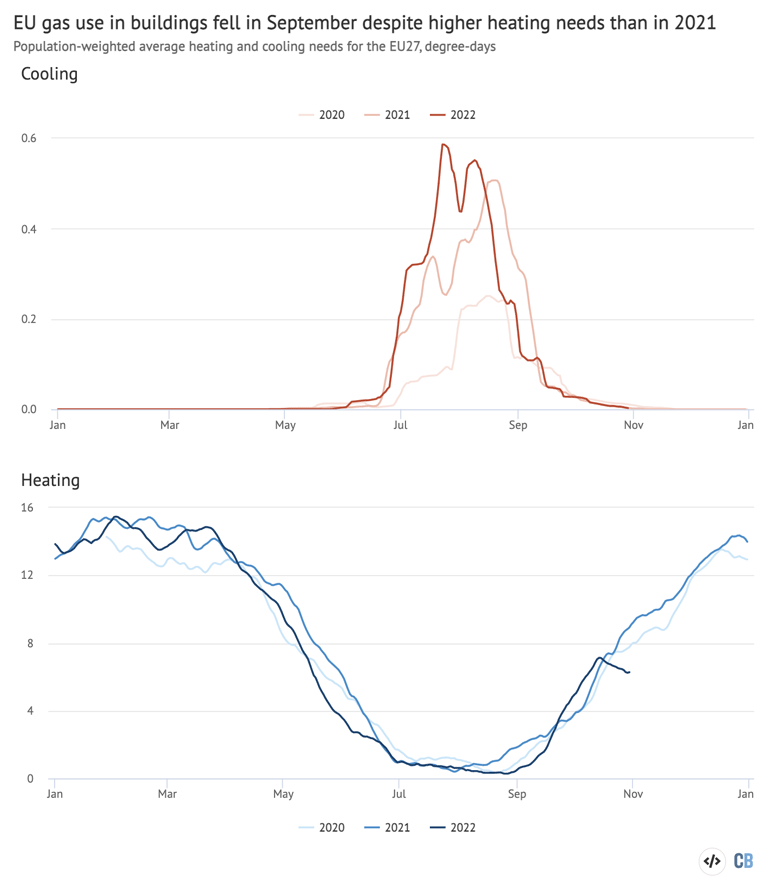
The analysis measures the impact of weather on energy demand using “heating degree-days”, the sum of the difference between daily average temperatures and the threshold of 15C, when temperatures are below this level.
Cooling degree-days, correspondingly, are degrees above 24C. The population-weighted heating load for the entire EU is a very good predictor of energy demand. Our analysis can account for 80% of the day-to-day variation in gas consumption and 70% of the variation in electricity consumption using the heating and cooling degree days as the predictor.
These metrics are shown in the figure below, with 2022 shown in red and previous years in shades of blue. Heating needs in September 2022 were higher than in 2021, so the reduction in electricity and gas demand during this period cannot be accounted for by temperatures. In October, unseasonably low heating needs have compounded the trend. The figure also shows the dramatic increase in cooling needs this summer.
Similarly, the increase in power-sector emissions seen until August cannot be accounted for by policy decisions favourable to coal, such as the extension of the life of coal plants slated to retire.
There was no shift this year in the fuel mix of thermal power generation, even when thermal power generation as a whole was increasing. When more electricity had to be generated using thermal power plants to make up for the shortfall in hydropower and nuclear power, the generation from coal and gas increased together, with no shift from gas to coal.
In September and October 2022, power generation from gas still increased year-on-year, albeit at a lower rate, while coal dropped. If the earlier increase in coal use was driven by policies favouring coal, as has been repeatedly suggested, this should have changed the fuel mix.
Contrary to common perception, the increase in emissions from summer 2021 until June this year was not the result of the energy crisis.
Instead, analysis of data shows that the increase in fossil fuel demand happened due to the unrelated reasons listed above, coincidentally compounding the supply crunch caused by Russia’s actions and worsening the crisis.
What is behind high fossil fuel prices?
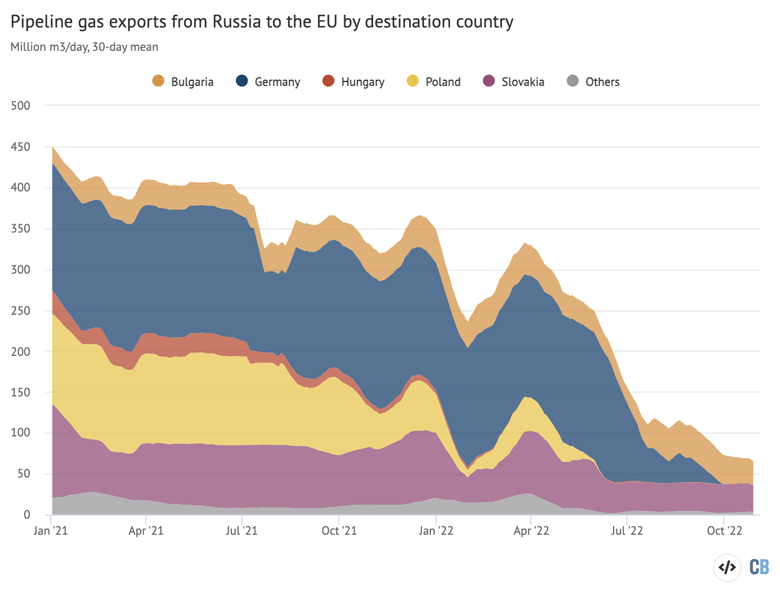
Gas deliveries from Russia from January to September 2022 were 490 terawatt hours (TWh) lower than in 2021, a reduction of 45%, as shown in the figure below.
The chart shows how Russia had already started cutting back gas sales from summer 2021, with more significant declines from January 2022 as it prepared to invade Ukraine.
In addition to reduced imports, EU gas storage was already partially depleted at the start of the year, with 20% less gas in storage than earlier years – a shortfall of 200TWh. Gazprom, which operated gas storage facilities in Germany, had run down its own storage.
Just as Russia was slashing exports to Europe, China experienced a shortfall in domestic coal production, which drove up imports and prices in autumn 2021 and contributed to the onset of the fossil fuel crisis. However, in 2022, China’s fossil fuel consumption and imports have been falling precipitously, providing substantial relief to the tight global market.
In 2022, however, two things happened that strongly compounded the impact of Russia’s gas supply cuts: a volley of maintenance problems at French nuclear plants; and a drought in the Mediterranean that affected hydropower output.
These are illustrated in the figure below, showing EU electricity generation by fuel in 2022 (red lines) and 2021 (blue), versus the range seen during 2016-2021 (shaded areas).
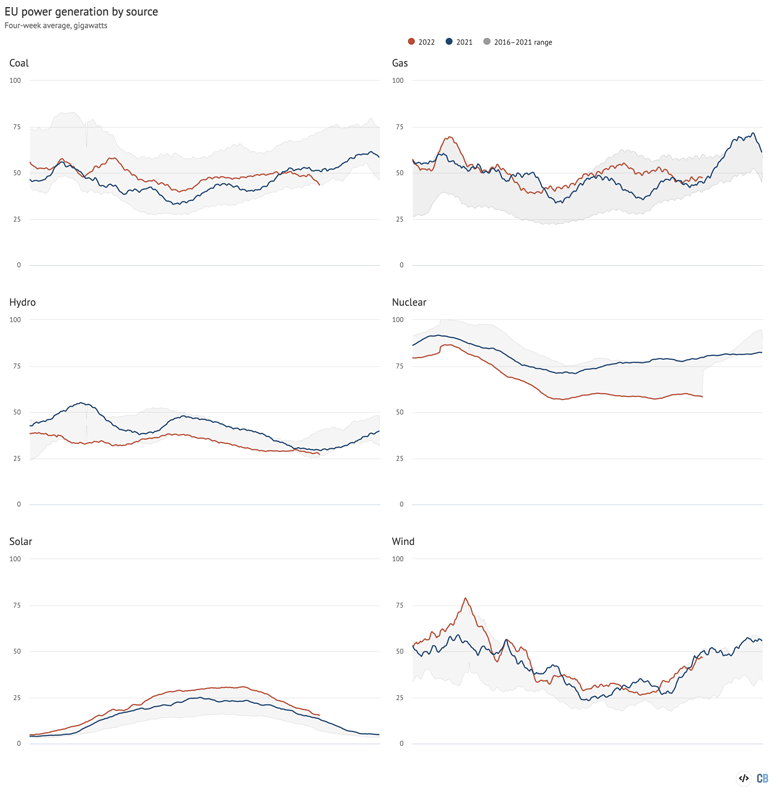
Nuclear power generation in January to September 2022 was 84TWh lower than the year before, with 70% explained by maintenance outages in France and 29% by Germany shutting down three reactors at the end of 2021.
Hydropower generation was down 62TWh in January to September 2022 compared with the year before. The largest falls took place in Italy, France, Spain and Portugal – all countries affected by the exceptional drought in the Mediterranean.
Oil consumption increased by 220TWh (7%) year-on-year in the first half of 2022, in a continuation of the rebound from Covid-19.
Gas demand outside the power sector rebounded in the first half of 2021, but as gas prices shot up in the autumn of 2021, gas consumption already began to fall. Gas consumption outside the power sector contracted 360TWh (15%) in January to September 2022, while consumption in the power sector increased by 40TWh (6%).
Solar and wind power generation performed strongly, increasing 58TWh (16%) compared to 2021, thanks to record-breaking solar installation volumes in 2021.
These factors contributing to the crisis are unrelated to Russia’s actions, but have compounded the problems triggered by Russia’s war and its use of energy as a weapon.
Germany’s bet on gas
Emblematic of Europe’s vulnerability to Russia’s weaponisation of gas supply is Germany’s increasing reliance on the fuel. Germany is the EU’s largest economy and energy consumer.
The country’s “Energiewende” energy plan counted on gas as a “transition” fuel while coal and nuclear were being phased out. Accordingly, Germany has seen a shift away from coal and nuclear energy, and a shift towards renewables and gas over the past decade.
As Russia invaded Ukraine, Germany was on the brink of opening up the Nord Stream 2 pipeline, which would have doubled its capacity to import gas directly from Russia.
From 2010 to 2021, Germany’s nuclear power generation fell by 51% (72TWh) and that from coal by 40% (100TWh). The rapid growth of renewables – up 160% (130TWh) – was not enough to offset these declines, so gas power generation also grew 46% (28TWh). Gas consumption outside the power sector fell until 2014 but has been climbing since then.
On New Year’s Eve 2021, Germany closed down three nuclear power plants, or half its remaining fleet, removing about 30TWh per year of non-fossil electricity generation.
Furthermore, Germany’s investments in wind power stalled after 2015, falling far behind the rest of Europe. Had Germany followed the growth trajectory of the rest of Europe for wind power installations, it would have been generating an additional 87TWh. This is equivalent to the annual power generation of the six nuclear plants still running in 2021.
In light of recent events, Germany has been adjusting its policies to promote much faster electrification of building heat, as the clearest example of abandoning the idea of gas as a transition fuel.
How are EU markets responding?
The fossil fuel crisis has triggered forceful responses from markets and policymakers.
Investments in solar power and heat pumps, as well as the sales of electric vehicles (EVs), have surged as a result of record-high fossil fuel prices.
Europe will add nearly 40GW of solar in 2022, according to SolarPower Europe (SPE). This would be up 45% from the 27GW added last year, which itself was the highest in a decade.
Passenger electric vehicle sales increased 16% year-on-year in Europe in the second quarter of 2022, the first full quarter after the start of the invasion. This comes on top of a 70% increase in 2021, when one in six car sales were electric. The 2021 market share of EVs exceeded 50% in the Netherlands, Sweden and Norway.
The European Heat Pump Association projects a 30% increase in sales in 2022, on top of 35% growth in 2021. Deliveries of heat pumps in Germany were up 25% year-on-year in the first half of 2022 and the government has called on the industry to ramp up production.
French nuclear generation is due to start recovering as state-owned utility EDF brings reactors under maintenance back online. Around 15-20GW is expected to be back in operation by early January 2023. Germany’s decision to extend the operation of its three remaining reactors until April 2023 will also boost low-carbon electricity supplies.
The reduction in gas use has been the main driver of the EU’s recent fall in emissions. Record-high gas prices are also incentivising an increase in gas supply infrastructure.
As more supply becomes available, first through floating terminals to receive liquified natural gas (LNG) and in a few years though onshore terminals, gas consumption could recover.
On the other hand, investments in heat pumps, building energy efficiency and electrification in industry are replacing gas, which has also become a new priority in energy policy.
As a result, there is a risk that the scramble to secure gas supplies in the near-term could lock EU countries into more supply contracts than they need in a few years’ time.
How are governments responding?
Supporting the market reaction are a host of new policies at EU and national level, designed to accelerate the shift away from fossil fuels.
The REPowerEU plan, launched in May, targets a 45% share of renewable energy sources in the EU’s energy mix by 2030. This includes not only electricity generation, but also all other uses of energy, such as transport and industrial fuel use.
In practice, a much higher share of renewable energy is required in power generation, where the largest potential for expansion lies. The Commission estimates that reaching the target requires 1,236GW of wind and solar power capacity by 2030. This is 16% higher than the 1,067GW envisaged by the previous “Fit for 55” strategy. If the new target is realised, renewables will make up 69% of EU electricity by 2030.
Some 19 EU countries have accelerated their decarbonisation plans and policies in response to the Covid-19 pandemic, the gas crisis and Russian aggression. Low-carbon sources are set to reach 82% of EU electricity in 2030, up from 74% under previous plans.
The main bottleneck for onshore wind expansion in Europe is permitting. The European Commission and many member states are taking action to address the issue, promising faster expansion of wind generation in the coming years.
For example, the German government has implemented a new “Wind-on-Land-Act”, which seeks to overcome the hurdles that have caused slow expansion. It aims for 10GW of onshore wind to be added per year and for 2% of land to be opened up for development.
In August, eight EU countries bordering the Baltic Sea agreed to increase offshore wind power capacity sevenfold by 2030, to reduce their dependence on Russian energy.
Europe’s CO2 emissions have already started falling due to the fossil fuel crisis. The lasting effects of the crisis will materialise over the next few years, as accelerated investments in low-carbon alternatives begin to bear fruit.


Methodology
The analysis of the EU’s CO2 emissions trends is based on CREA’s near-real-time emissions tracker.
It tracks daily power generation data from the transparency platform of ENTSO-E, the European power grid operator. Emissions are estimated from power output based on average emissions from coal and gas-fired generation by country. These are derived by aligning the daily power generation data with earlier Eurostat monthly data on hard coal, lignite and gas use for power generation.
Gas consumption is obtained from daily data on gas flows from ENTSOG, the European gas network operator. The “apparent consumption” is calculated, which is the residual of imports from outside the EU, domestic production and flows into and out of storage.
For total oil consumption and for coal consumption outside the power sector, we extend the latest monthly data for each country, based on the average deviation from the 2019–2021 average in the past three months.
For oil, consumption is based on observed gross inland deliveries, a measure of implied oil consumption based on refinery output, imports, exports and stock changes, as well as deliveries of crude oil and natural gas liquids to non-refinery users, along with several smaller flows (see full definition).
For coal, usage is based on final consumption reported by (industrial) users and sales to residential and commercial consumers reported by sellers. Currently, data is available for most countries until the end of August 2022.
CO2 emissions are estimated from data on fuel consumption, using the Intergovernmental Panel on Climate Change (IPCC) default emissions factors.
-
Analysis: EU’s CO2 emissions fall 5% in three months after post-Covid surge