
Analysis: Fossil-fuel CO2 emissions to set new record in 2025, as land sink ‘recovers’
Multiple Authors
11.13.25Multiple Authors
13.11.2025 | 12:01amCarbon dioxide (CO2) emissions from fossil fuels and cement will rise around 1.1% in 2025, reaching a record 38.1bn tonnes of CO2 (GtCO2), according to the latest figures from the Global Carbon Project.
However, falling land-use emissions means that global CO2 emissions in 2025 will remain relatively unchanged compared to 2024 levels.
The 20th edition of the annual Global Carbon Budget report, published today, also finds that the land carbon sink – the portion of human-caused CO2 emissions absorbed by plants and soils – appears to have recovered to its pre-El Niño strength after two unusually weak years.
However, research published alongside the report by the same team also suggests that climate change has caused a long-term decline in land and ocean carbon sinks, with sinks being about 15% weaker over the past decade than they would have been without climate impacts.
The study, published in Nature, finds that the decline of carbon sinks has contributed about 8% to the rise in atmospheric CO2 concentration since 1960.
The 2025 Global Carbon Budget report also estimates that:
- Emissions in China and India are projected to grow much less in 2025 compared to the past decade, while emissions in the US and EU are projected to grow this year after years of decline.
- Global CO2 emissions from land-use change are expected to decrease by nearly 10% in 2025, driven by reductions in deforestation and forest degradation in South America.
- Total CO2 emissions – fossil and land use – have grown more slowly over the past decade (0.3% per year on average) compared to the previous decade (1.9% per year).
- The remaining carbon budget to limit global warming to 1.5C is virtually exhausted and is equivalent to only four years of current emissions. Carbon budgets to limit warming to 1.7C and 2C would similarly be used up in 12 and 25 years, respectively.
- The concentration of CO2 in the atmosphere is set to reach 425.7 parts per million (ppm) in 2025, 2.3ppm above 2023 and 52% above pre-industrial levels.
(For detailed coverage of previous editions of the report, see Carbon Brief’s coverage for 2024, 2023 and 2022.)
Global emissions remain flat
The Global Carbon Budget (GCB) finds that total global CO2 emissions in 2025 – including those from fossil fuels and land use – are projected to remain approximately flat at 42.2GtCO2, falling by a negligible -0.04% compared to last year.
This means 2025 is effectively tied with 2024 as the highest global CO2 emissions on record.
Flat total CO2 emissions in 2025 reflect a combination of continued rising emissions from fossil fuel and industry and declining emissions from land-use change. Fossil CO2 emissions rose 1.1% to 38.1GtCO2, while land-use emissions declined by -9.8% to 4.1GtCO2 (albeit with large uncertainties).
The figure below shows the 2025 global CO2 emissions update (red solid line) alongside 2024 (dark blue dotted), 2023 (mid blue dotted) 2022 (light blue dotted), 2021 (light grey dotted) and 2020 (dark grey dotted). The shaded area indicates the uncertainty around the new 2025 budget.
(Each year, the GCB is updated to include the latest data as well as improvements to modelling sources and sinks, resulting in some year-to-year revisions to the historical record.)
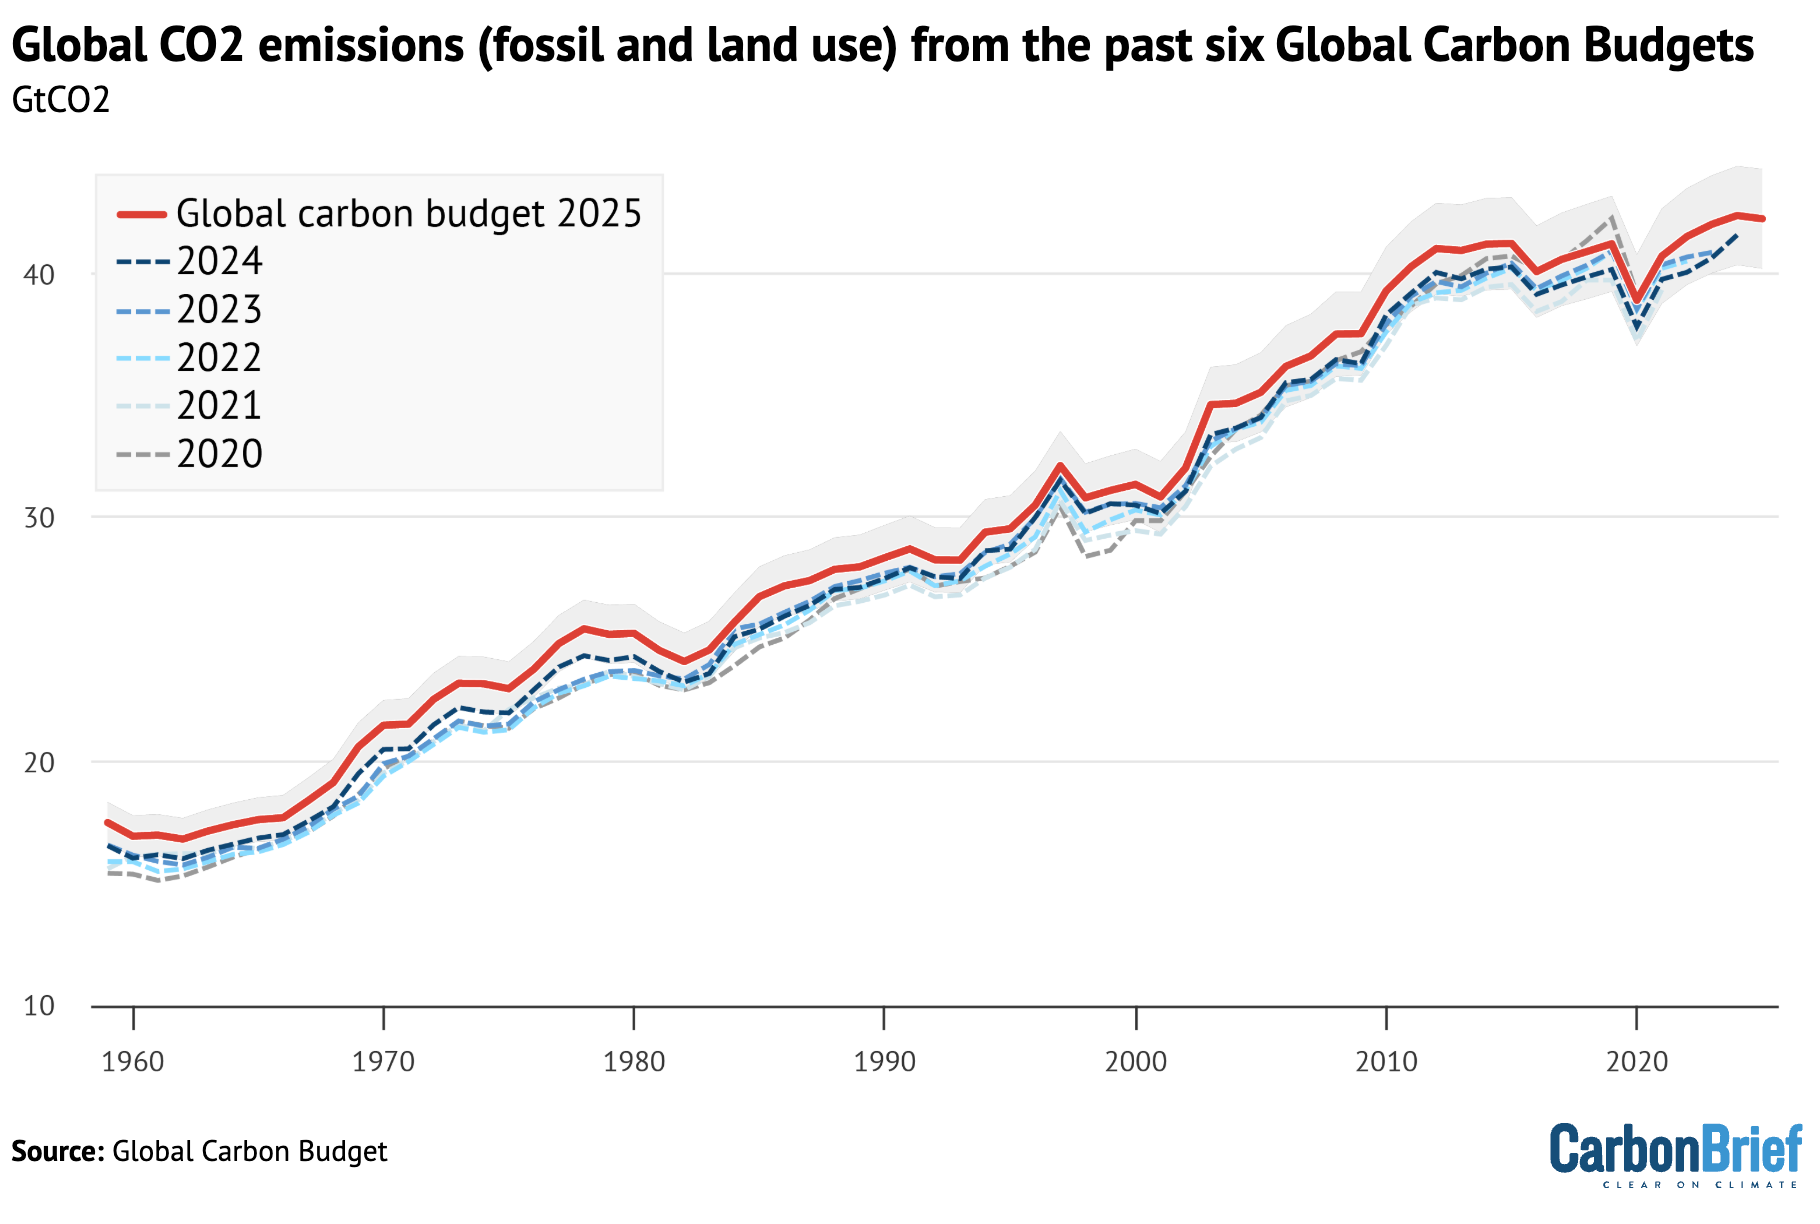
The 2025 figures are notably higher than those in the prior five GCB reports, reflecting an upward revision in historical land-use emissions. (This is discussed in more detail in the land-use emissions section below.)
Total global CO2 emissions have notably flattened in the past decade (2014-25), growing at only 0.3% per year compared to the 1.9% rate of growth during the prior decade (2004-13) and the longer-term average growth rate of 1.6% over 1959-2014.
This apparent flattening is due to declining land-use emissions compensating for continued – but slow – increases in fossil CO2 emissions. Fossil emissions grew around 0.2GtCO2 per year over the past decade, while land-use emissions decreased by a comparable amount.
However, despite the emissions plateau, there is still no sign of the rapid and deep decrease in CO2 emissions needed to reach net-zero and stabilise global temperatures in-line with the Paris Agreement temperature goal.
If global emissions remain at current levels, the remaining carbon budget to limit warming to 1.5C (with a 50% chance) will be rapidly exhausted.
(The carbon budget is the total amount of CO2 that scientists estimate can be emitted if warming is to be kept below a particular temperature threshold. Earlier this year, the Indicators of Global Climate Change report estimated the remaining carbon budget had declined by three-quarters between the start of 2020 and the start of 2025.)
With human-caused global warming sitting at around 1.36C above pre-industrial levels in 2024, the remaining budget for 1.5C is 170GtCO2, equivalent to four years of current emissions.
The GCB report finds that the remaining carbon budgets to limit warming to 1.7C and 2C have been reduced to 525GtCO2 (12 years at current emissions levels) and 1,055GtCO2 (25 years), respectively.
Global fossil CO2 emissions also grew more slowly in the past decade (0.8% per year) compared to the previous decade (2.1%). This was driven by the continued decarbonisation of energy systems – including a shift from burning coal to gas and replacing fossil fuels with renewables – as well as slightly weaker global economic growth during the past decade.
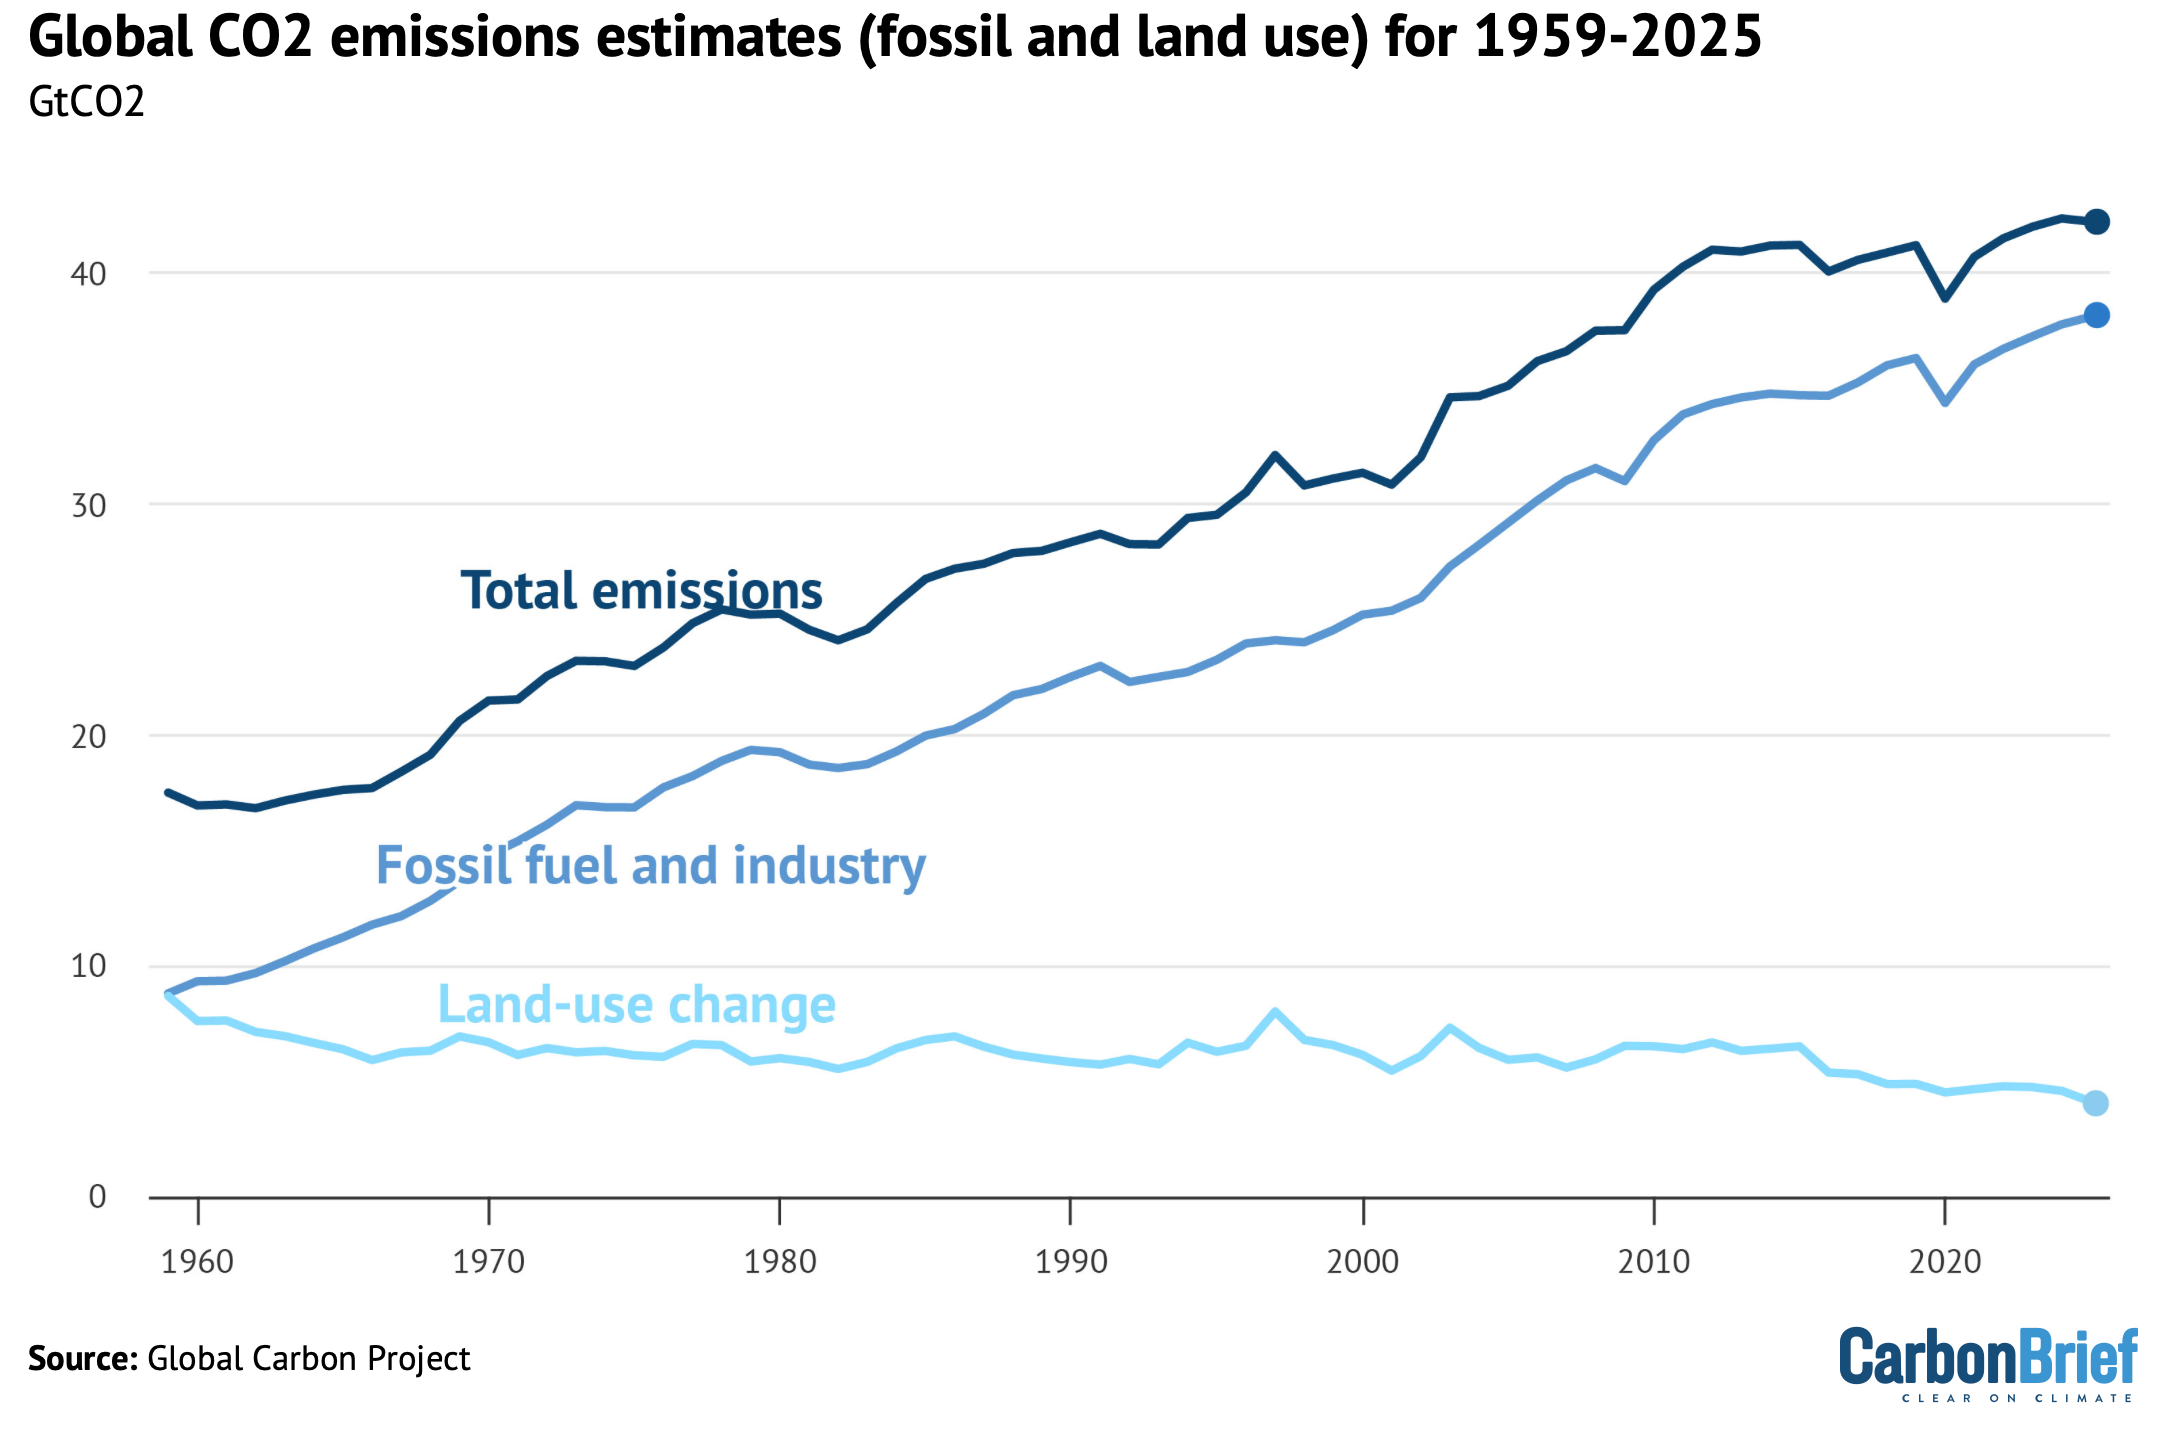
The figure below breaks down global emissions (dark blue line) in the 2025 budget into fossil (mid blue) and land-use (light blue) components. Fossil CO2 emissions represent the bulk of total global emissions in recent years, accounting for approximately 90% of emissions in 2025 (compared to 10% for land use). This represents a large change from the first half of the 20th century, when land-use emissions were approximately the same as fossil emissions.
Global fossil emissions include CO2 emitted from burning coal, oil and gas, as well as the production of cement. However, to determine total fossil emissions, the Global Carbon Budget also subtracts the cement carbonation sink – CO2 slowly absorbed by cement once it is exposed to the air – from fossil emissions.
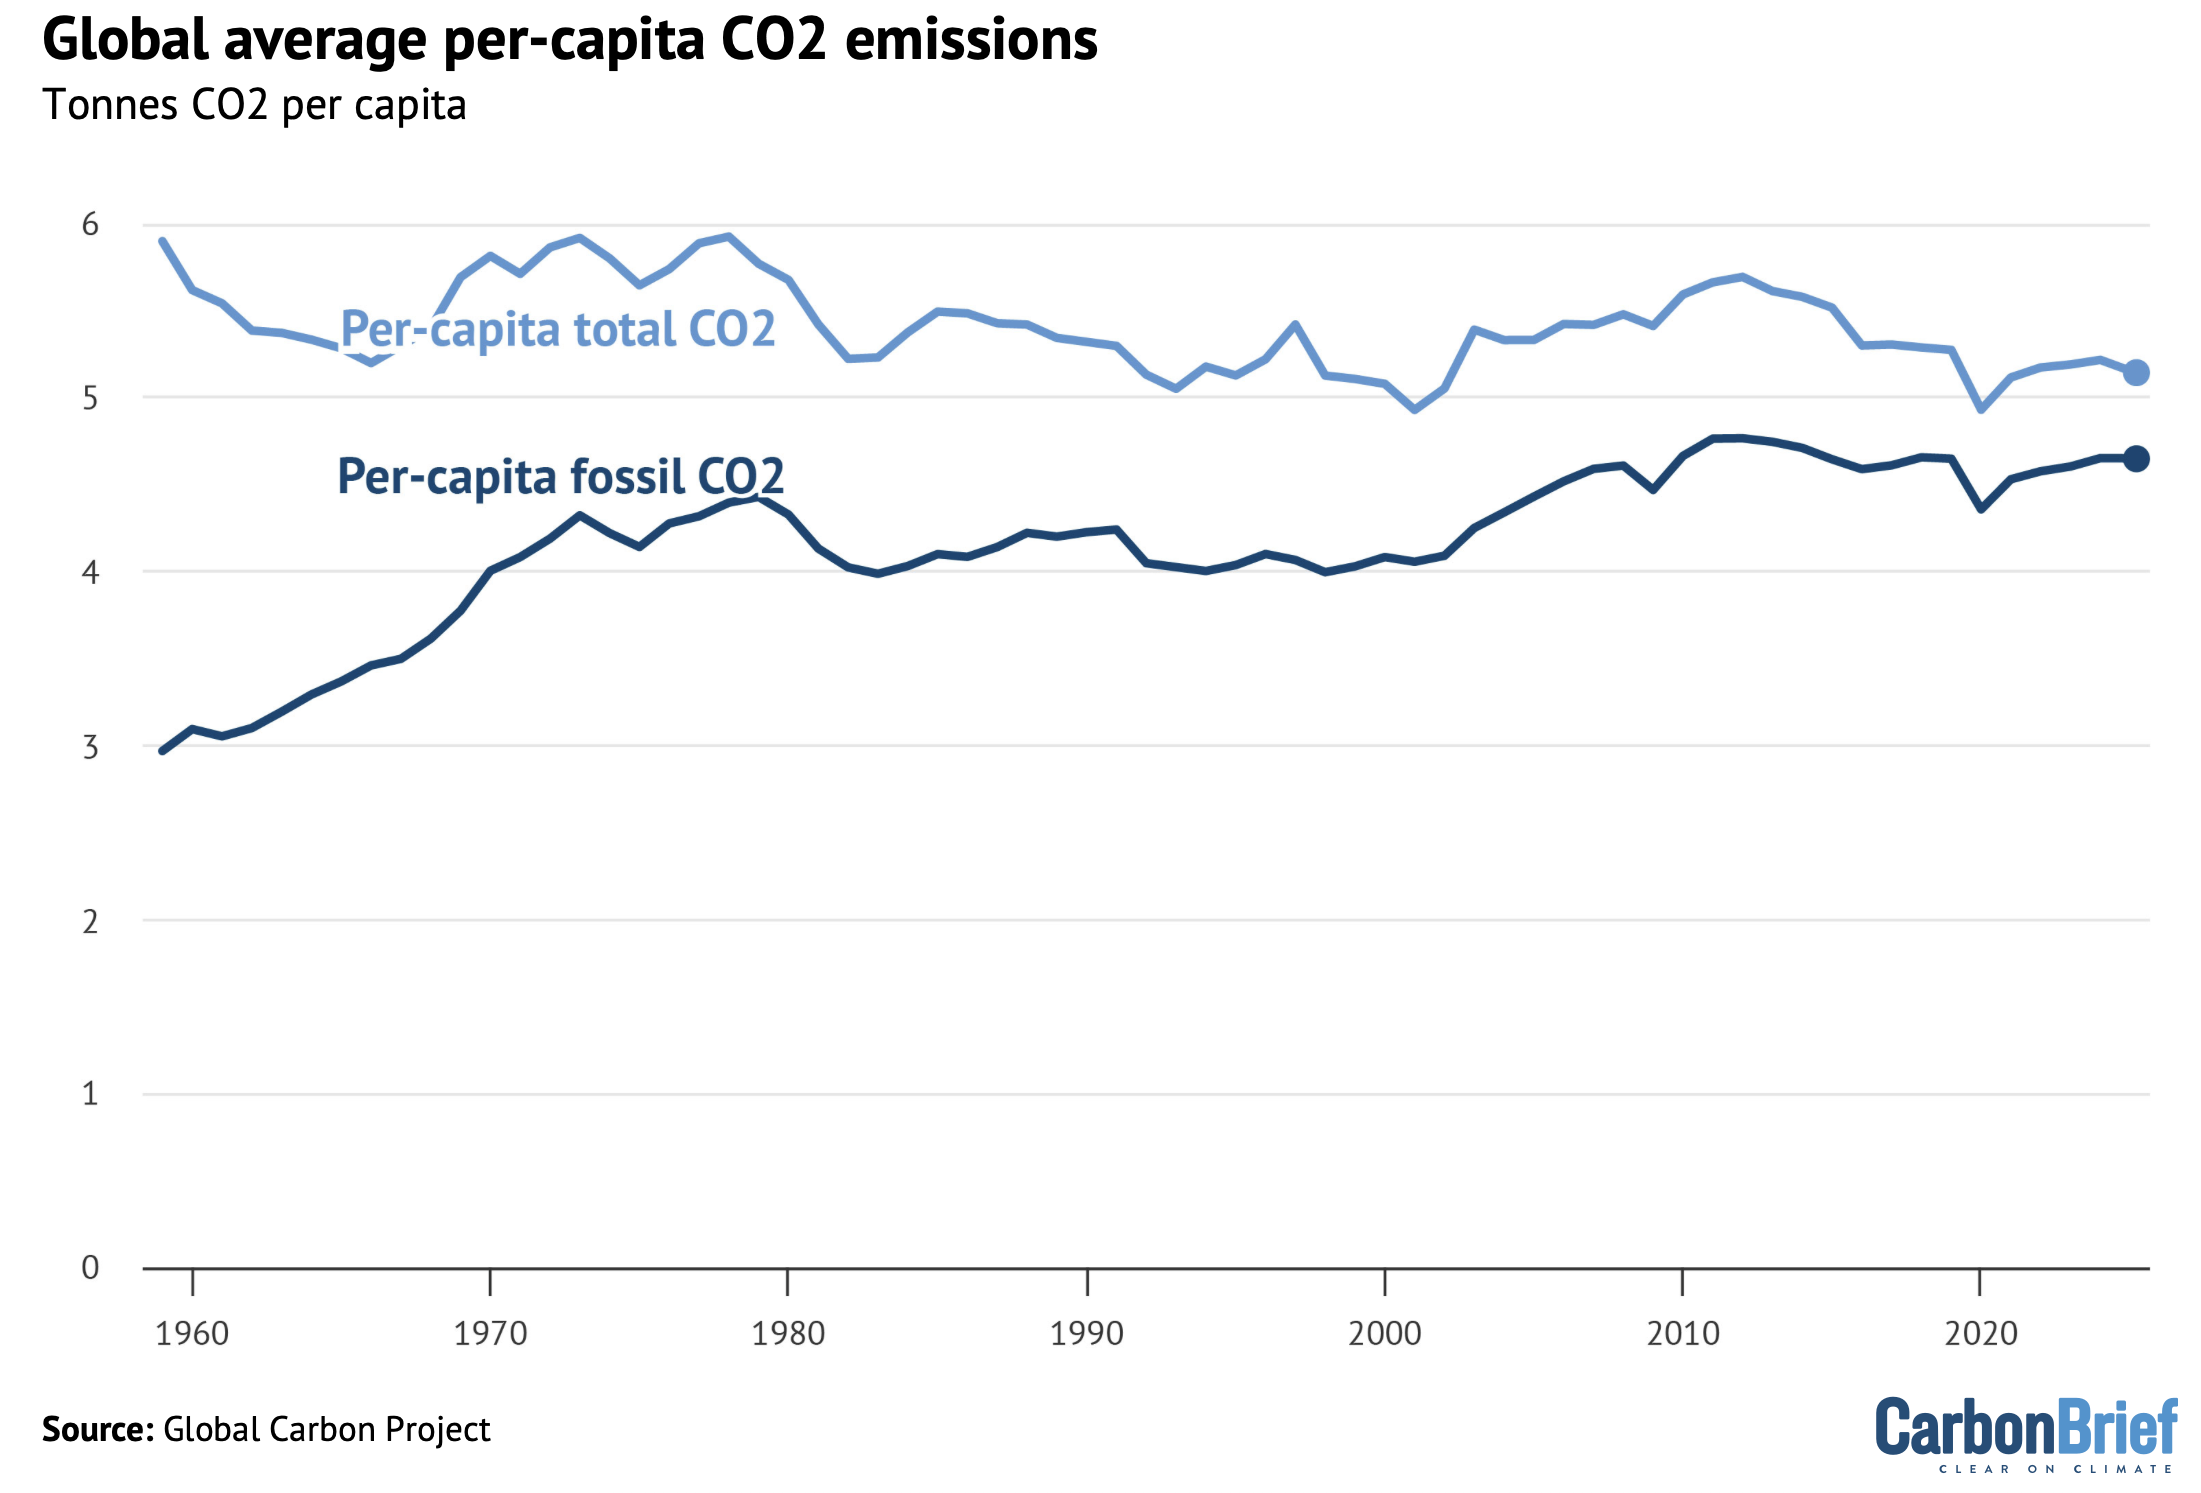
Global emissions can also be expressed on a per-capita basis, as shown in the figure below.
While it is ultimately total global emissions that matter for the Earth’s climate – and a global per-capita figure glosses over a lot of variation among, and within, countries – it is noteworthy that global per-capita fossil emissions peaked in 2012 and have been slightly declining in the years since.
Land-use emissions continue downward trend
Global land-use emissions stem from deforestation, forest degradation, loss of peatlands and harvesting trees for wood. They averaged around 5.0GtCO2 over the past decade (2015-24) and the Global Carbon Budget provides an initial projection for 2025 of 4.1GtCO2.
This represents a 0.5GtCO2 decrease in land-use emissions relative to 2024. The GCB report suggests that this was largely driven by a combination of reductions in deforestation and forest degradation in South America and by the end of the dry 2023-24 El Niño conditions.
Overall, land-use emissions have decreased by around 32% compared to their average in the 2000s, with a particularly large drop in the past decade. This decline is statistically significant and is due both to decreasing deforestation and increasing levels of reforestation and afforestation globally.
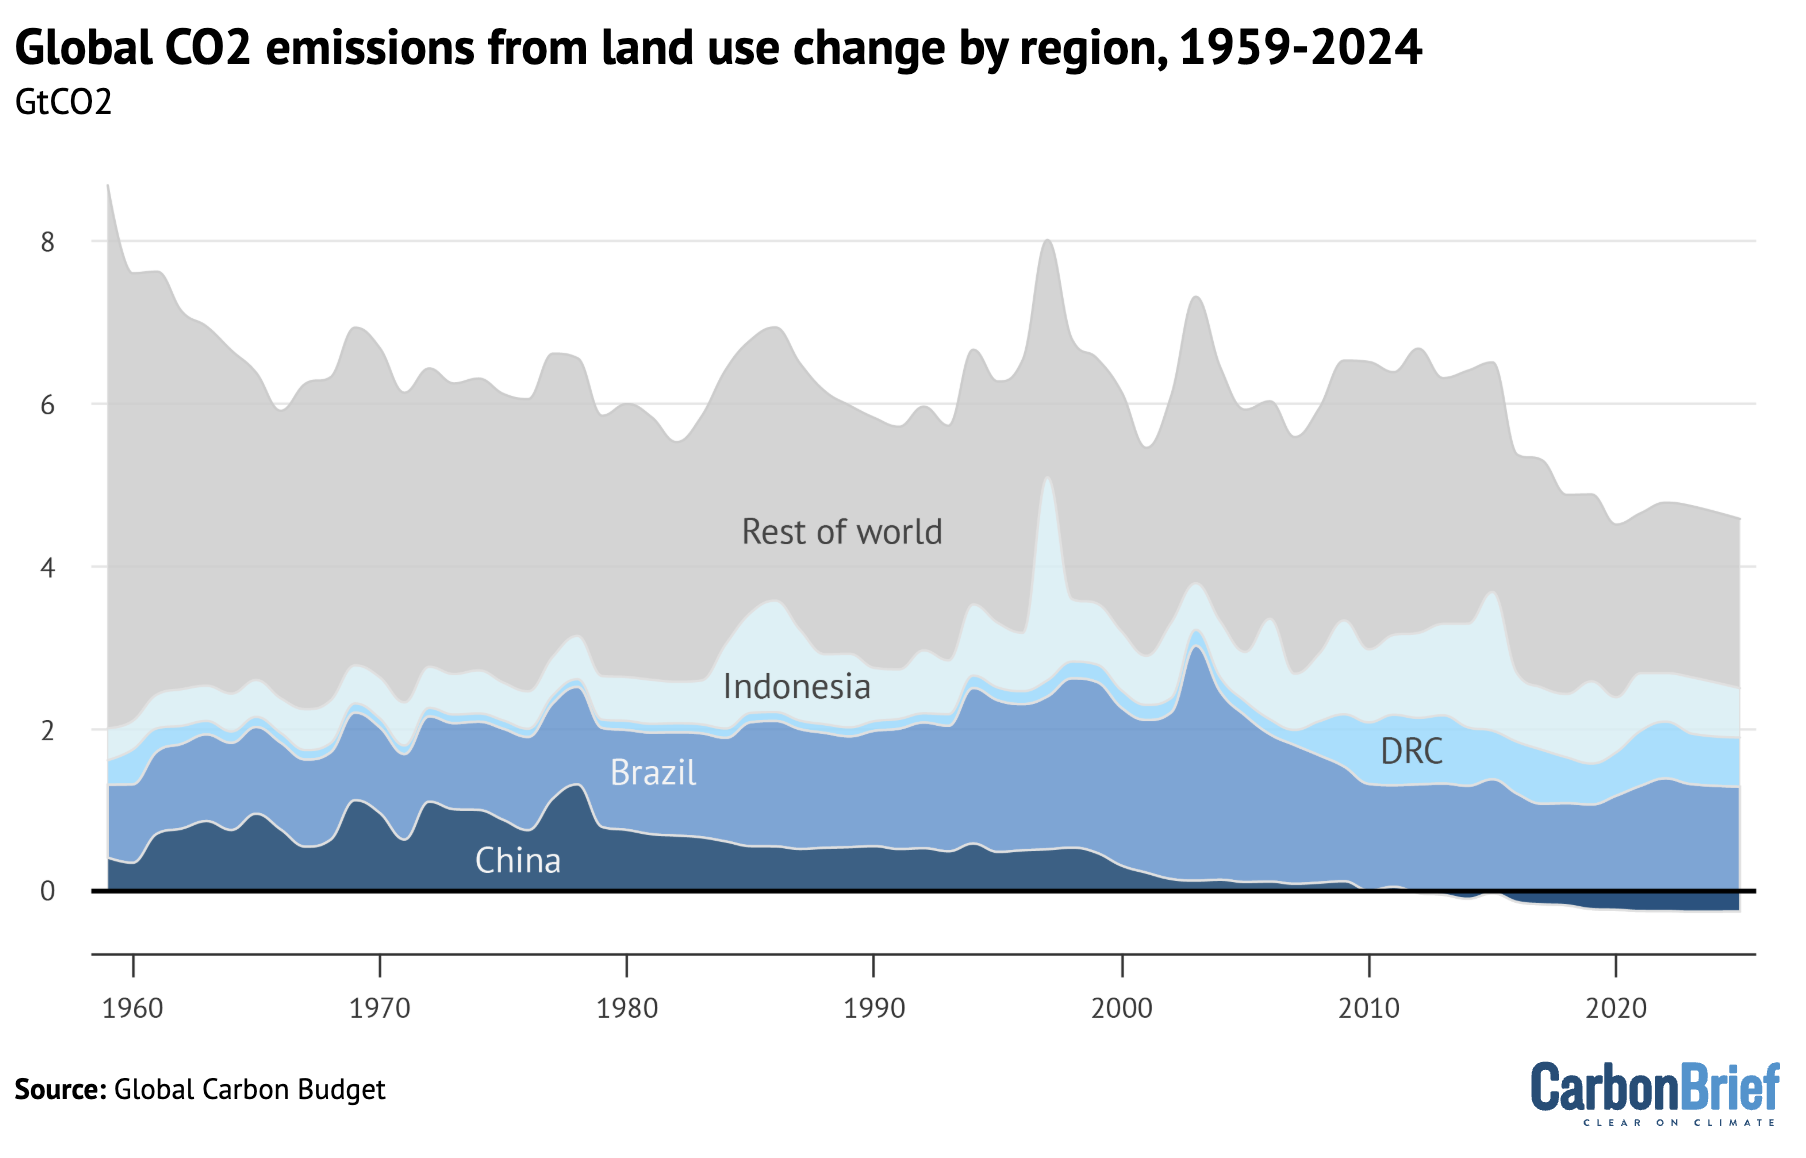
Three countries – Brazil, Indonesia and the Democratic Republic of the Congo (DRC) – collectively contribute approximately 57% of the global land-use emissions. In the past, China has been a meaningful contributor to land-use emissions, but in recent years its land-use emissions have turned net-negative as more trees have been planted than cut down.
The figure below shows changes in emissions over time in these countries, as well as land-use emissions in the rest of the world (grey).
Historical land-use emissions have been revised upward in the 2025 GCB report compared to prior estimates. This reflects a combination of two factors:
- The discontinuation of one of the four bookkeeping models that GCB has historically relied on for land-use emissions estimates. This model tended to show lower land-use emissions than the others.
- The inclusion of the impacts from CO2 fertilisation on global biomass densities. Because forests have higher biomass densities now than in the past, due to increasing CO2, this tends to increase the estimate of land-use emissions for recent years.
Fossil-fuel CO2 hits record highs
Global emissions of fossil CO2 – including coal, oil, gas and cement – increased by around 1.1% in 2025, relative to 2024, with an uncertainty range of 0.2-2.2%. This represents a new record high and surpasses the prior record set in 2024.
The figure below shows global CO2 emissions from fossil fuels, divided into emissions from major emitting countries including China (dark blue shading), the US (mid blue), the EU (light blue), India (light blue) and the remainder of the world (grey).
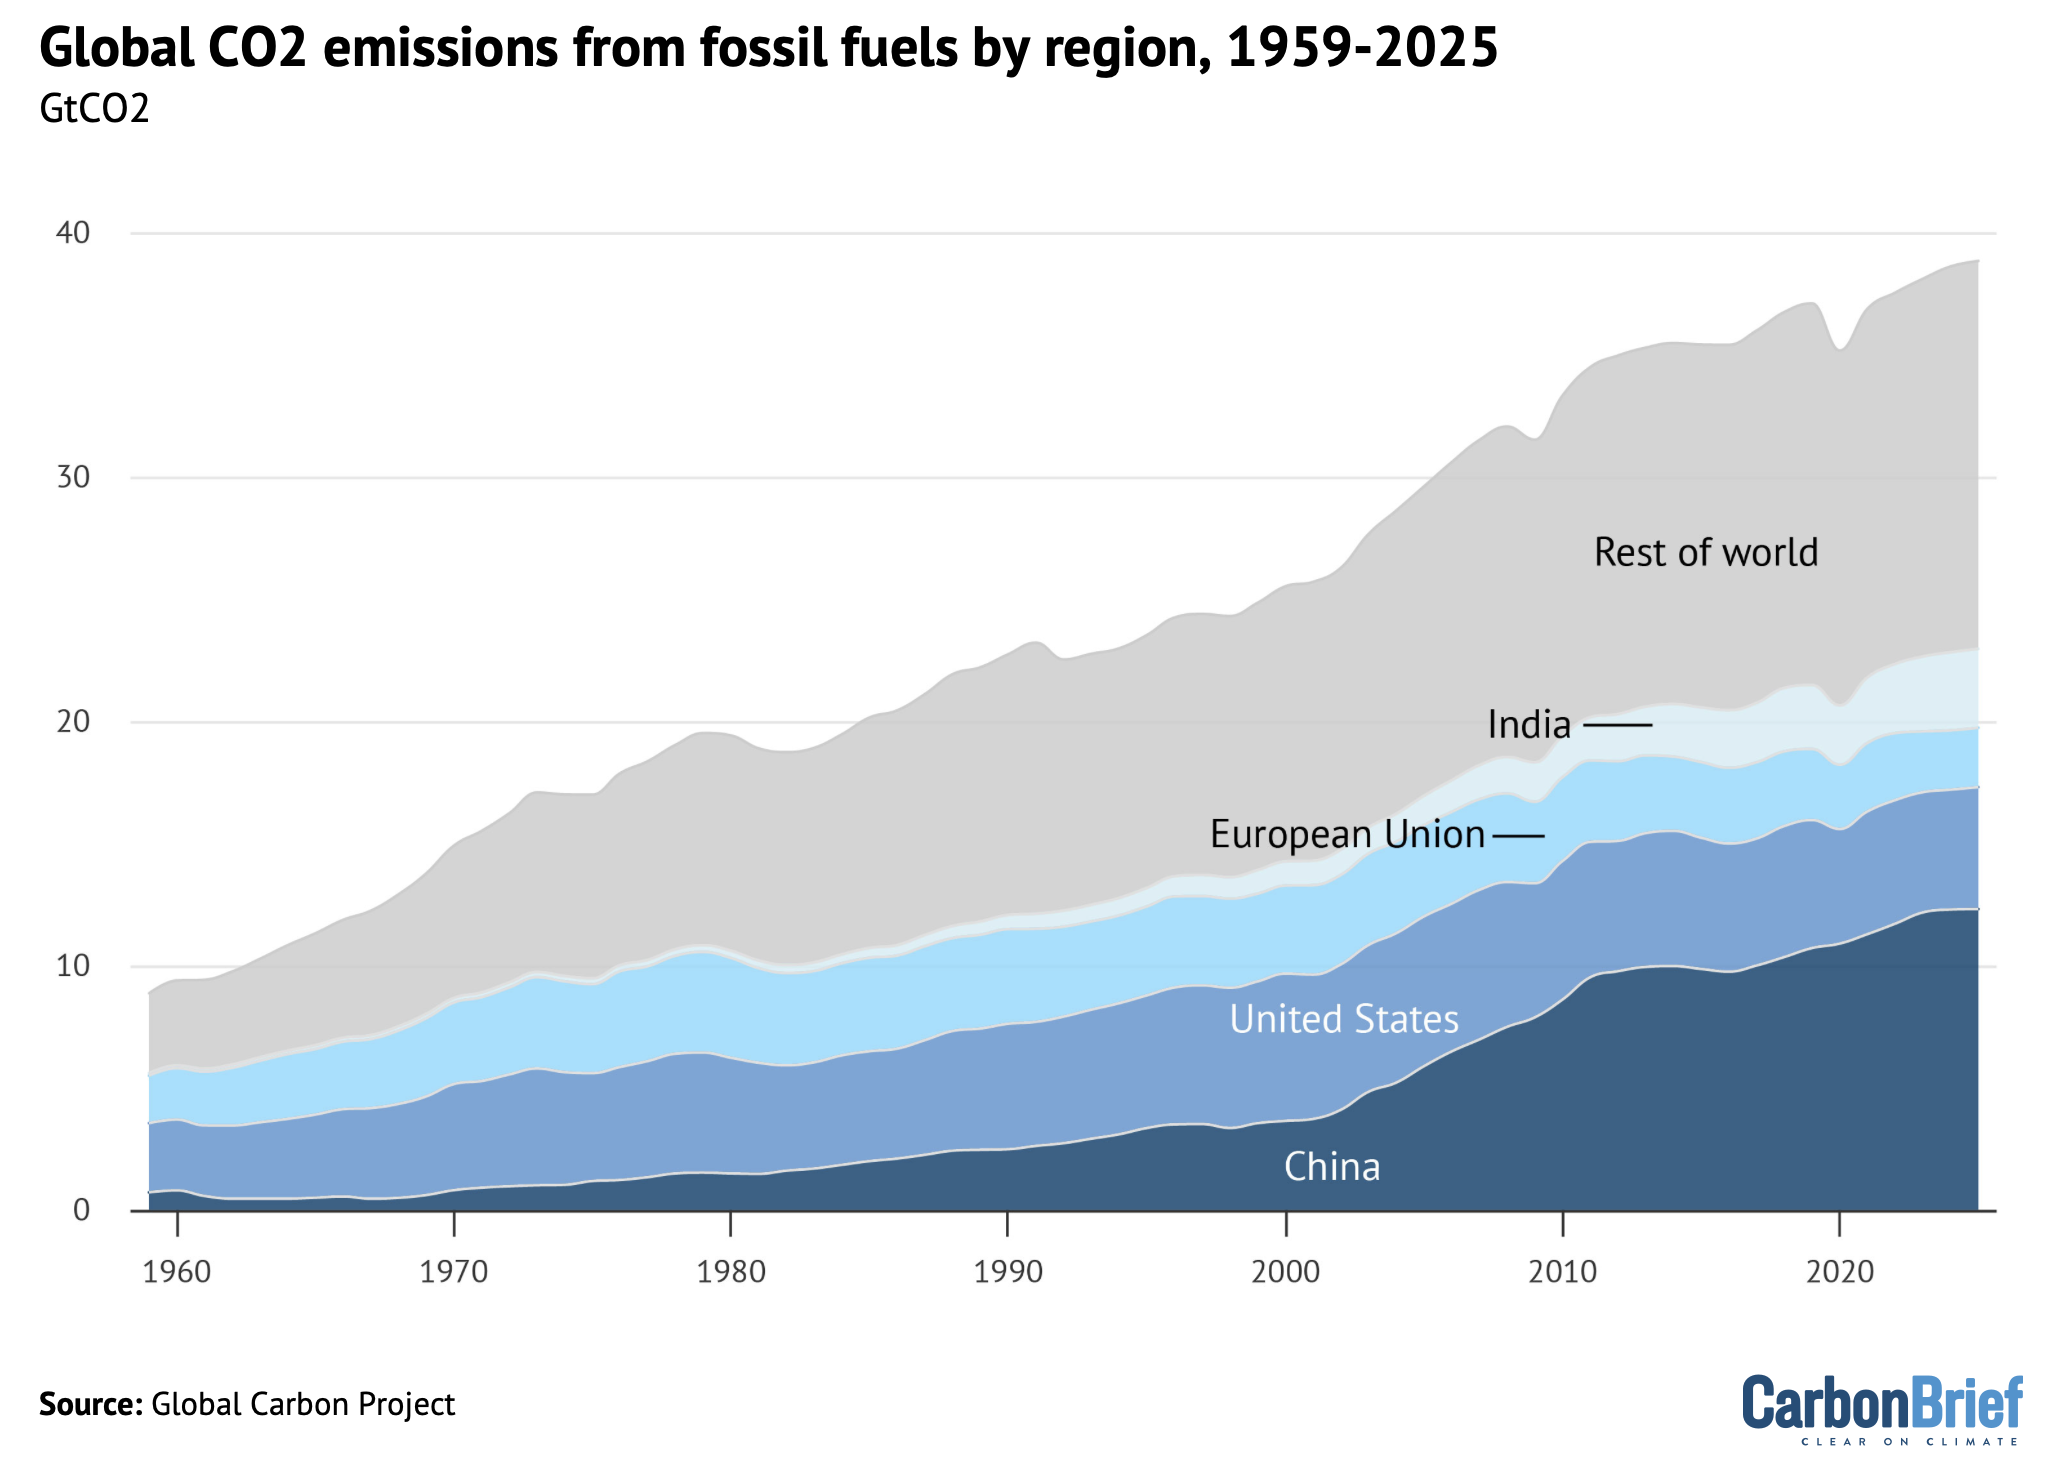
China represents 32% of global CO2 emissions today. Its 2025 emissions are projected to increase by a relatively small 0.4% (with an uncertainty range of -0.9% to 2%), driven by a small rise in emissions from coal (0.3%), a modest rise in gas (1.3%) and a larger rise in oil (2.1%).
Given the uncertainty range, a decrease in Chinese emissions is also a possibility, but this will not be confirmed until the full 2025 data is available.
Similarly, recent analysis for Carbon Brief found that China’s emissions were “finely balanced between a small fall or rise” in 2025. However, it said that a drop in the full-year total became more likely after a 3% decline in September. (The Global Carbon Project estimates are based on data covering January through to August, which point towards a small rise in 2025.)
Whether China’s emissions see small rise or fall in 2025, the outcome will be due to moderate growth in energy consumption combined with an extraordinary growth in renewable power generation. This would represent the second year in a row where Chinese emissions growth was well below the average rate over the past decade.
The US represents 13% of global emissions and emissions in 2025 are projected to increase by 1.9% (-0.2 to +4.1%) compared with 2024. This marks a reversal from recent trends in declining CO2 emissions.
The projected growth of emissions in the US is likely driven by a combination of three factors: a colder start to the year after a mild 2024, which led to greater heating requirements, higher gas prices, which led to more coal being used in power generation, as well as an increase in total demand for electricity.
US emissions from coal are expected to increase by a substantial 7.5% in 2025, emissions from both oil and gas by a more modest 1.1% and emissions from cement to fall by -8.0%.
While policies enacted by the current US administration may increase CO2 emissions going forward, their impact on national emissions levels in 2025 were likely relatively modest compared to other factors.
India represents 8% of global emissions. In 2025, its emissions are projected to increase by 1.4% (-0.3% to +3.1%) on 2024 levels, significantly below recent trends.
An early monsoon with the highest-ever May rainfall substantially reduced cooling requirements in May and June, the hottest months of the year. Strong growth or renewables – particularly solar – has also helped limit the growth of Indian emissions.
Indian emissions from coal are expected to grow 1.7%, with oil growing 0.1%, gas shrinking by -6.4% and cement growing by 9.9%.
The EU represents 6% of global emissions. Its emissions are projected to increase by 0.4% in 2025, with an uncertainty range of -2.1 to +2.8%. This represents a divergence from a past decline in emissions (albeit with large uncertainties).
EU emissions from coal are expected to decline by -0.3%, whereas emissions from oil and gas are projected to increase by 0.6% and 0.9%, respectively. Cement emissions are expected to fall by -4.1%.
The increase in EU emissions is in part from weather-related low hydropower and wind generation which – despite increases in solar – have led to an increase in electricity generation from gas. In addition, a relatively cold February led to increased use of natural gas for space heating.
International aviation and shipping (included in the “rest of world” in the chart above) are responsible for 3% of global emissions. They are projected to increase by 6.8% for aviation, but remain flat for international shipping. This year will be the first time that aviation emissions have exceeded pre-Covid levels.
The rest of the world (excluding aviation) represents 38% of global emissions. Emissions are expected to grow by 1.1% in 2025 (ranging from -1.1% to +3.3%), with increases in emissions from coal (1%), oil (0.5%), gas (1.8%) and cement (2.4%).
The total emissions for each year over 2022-25, as well as the countries and regions that were responsible for the changes in absolute emissions, are shown in the figure below.
Annual emissions for 2022, 2023, 2024 and estimates for 2025 are shown by the black bars. The smaller bars show the change in emissions between each set of years, broken down by country or region – the US (dark blue), EU (mid blue), China (light blue), India (pale blue) and the rest of the world (grey). Negative values show reductions in emissions, while positive values reflect emission increases.
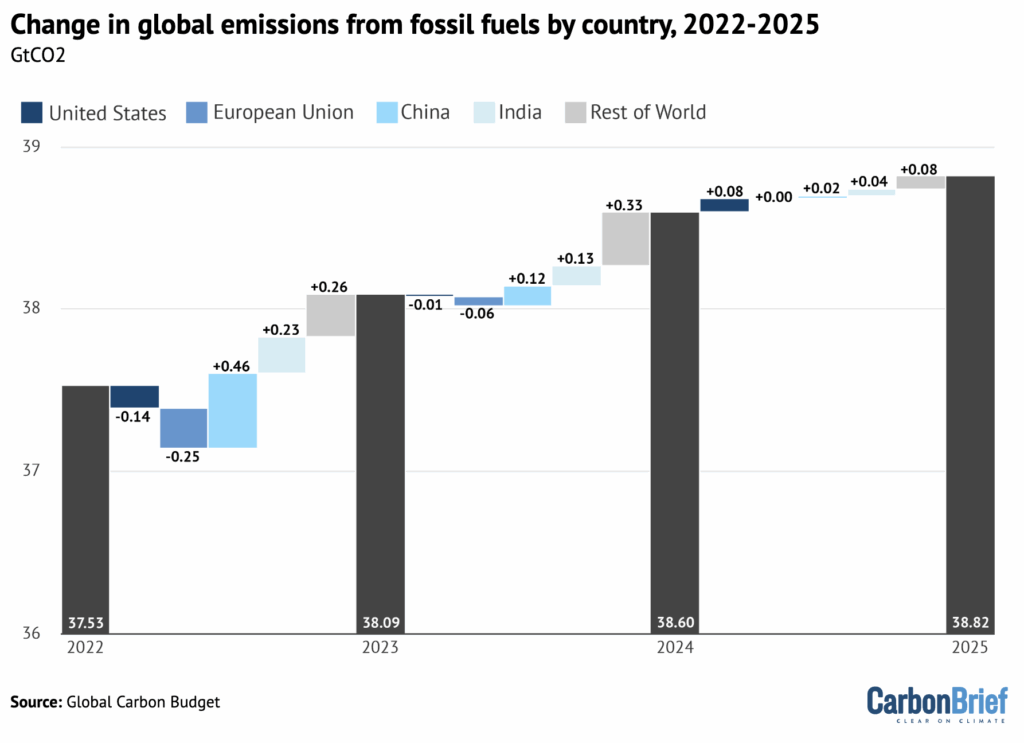
The US represented a large part of the rise in global fossil-fuel emissions in 2025. US emissions increases over 2024-25 contributed about 40% of the total global increase – more than the EU, China and India contributions combined.
The Global Carbon Project notes that emissions have declined over the past decade (2015-24) in 35 nations, which collectively account for 27% of global emissions. This is up from 18 countries during the prior decade (2005-14).
The decrease in emissions in those countries comes despite continued domestic economic growth and represents a long-term “decoupling” of CO2 emissions and the economy.
The carbon intensity of energy has consistently decreased over the past decade in China, the US, the EU – and, to a lesser extent, globally.
However, peaking CO2 emissions requires that the rate of decarbonisation exceeds the growth in energy demand. This has happened in some regions, including the US and EU, but not yet globally.
Modest growth in emissions from coal, oil, gas and cement
Global fossil-fuel emissions primarily result from the combustion of coal, oil and gas.
In 2025, coal is responsible for more emissions than any other fossil fuel, representing approximately 42% of global fossil-fuel CO2 emissions. Oil is the second largest contributor at 33% of fossil CO2, while gas comes in at 21%.
The production of cement is responsible for around 3.8% of global emissions, but this is reduced to 1.9% once the carbonation sink – the drawdown of atmospheric CO2 by concrete – is taken into account.
These percentages reflect both the amount of each fossil fuel consumed globally, but also differences in CO2 intensities. Coal results in the most CO2 emitted per unit of heat or energy produced, followed by oil and gas.
The figure below shows global CO2 emissions from different fuels over time, covering coal (dark blue), oil (mid blue) and gas (light blue), as well as cement production (pale blue) and other sources (grey).
While coal emissions increased rapidly in the mid-2000s, they have largely flattened since 2013. However, coal use increased significantly in 2021 and then more modestly in the subsequent four years.
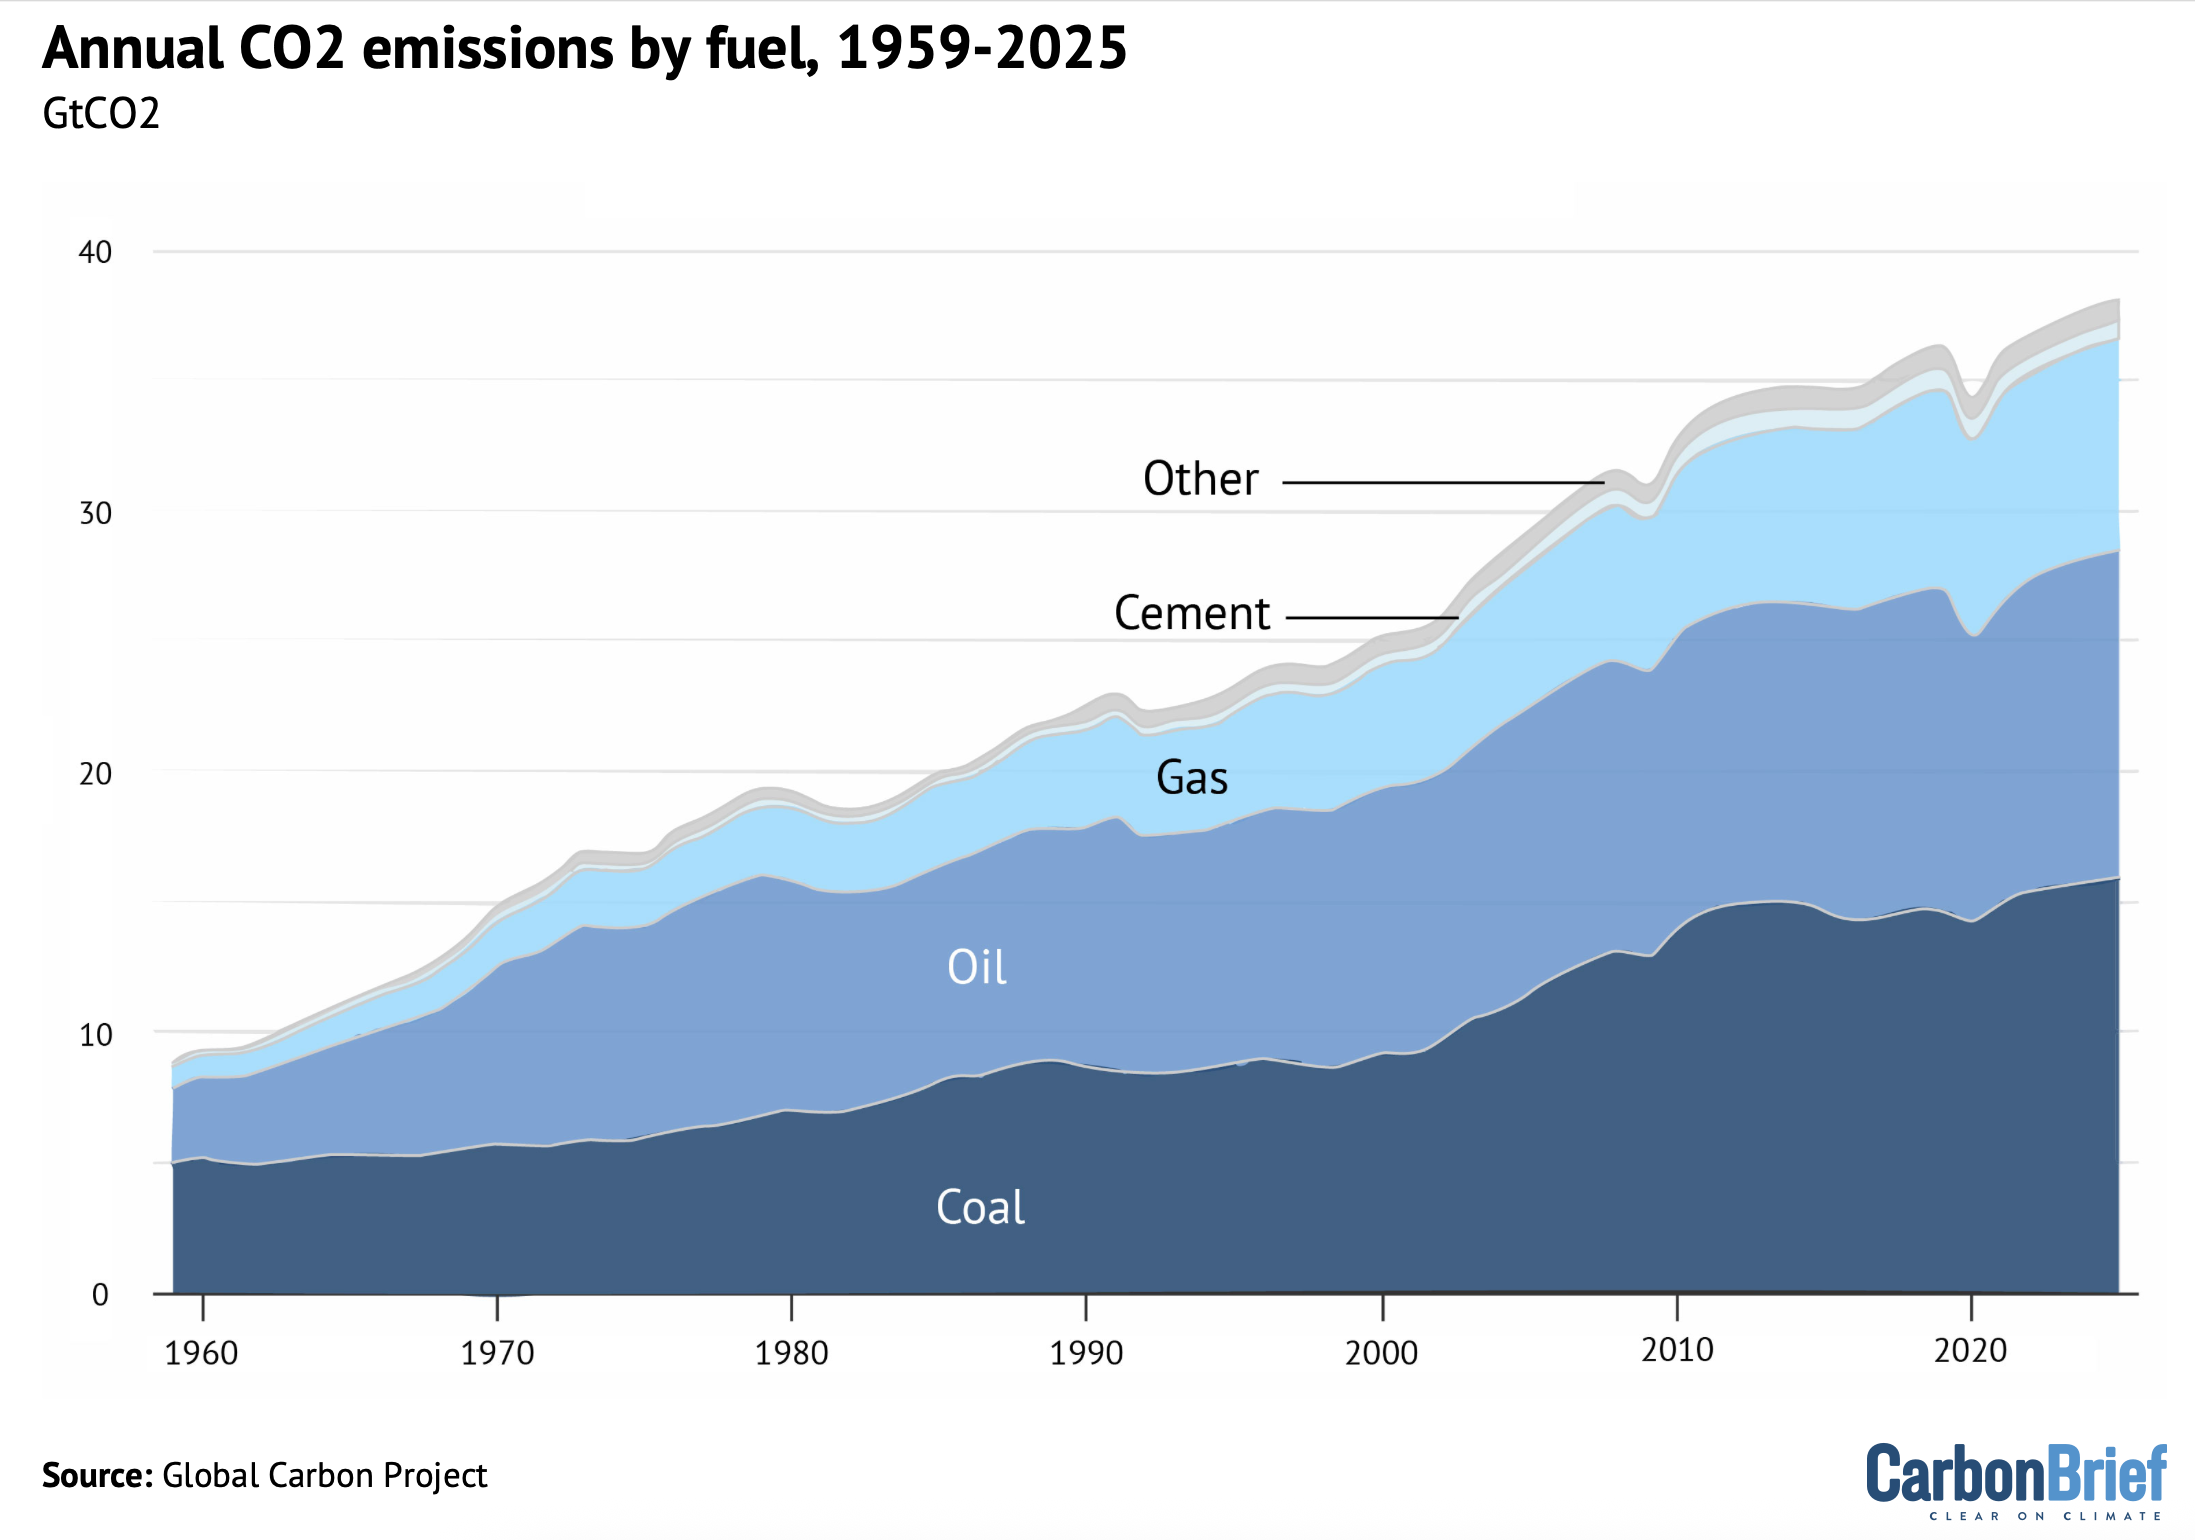
Global emissions from coal increased by 0.8% in 2025 compared to 2024, while oil emissions increased 1.0% and gas emissions increased by 1.3%.
Despite setting a new record this year, global coal use is only 6% above 2013 levels – a full 13 years ago. By contrast, during the 2000s, global coal use grew at a rate of around 4% every single year.
The figure below shows the total emissions for each year over 2022-25 (black bars), as well as the absolute change in emissions for each fuel between years.
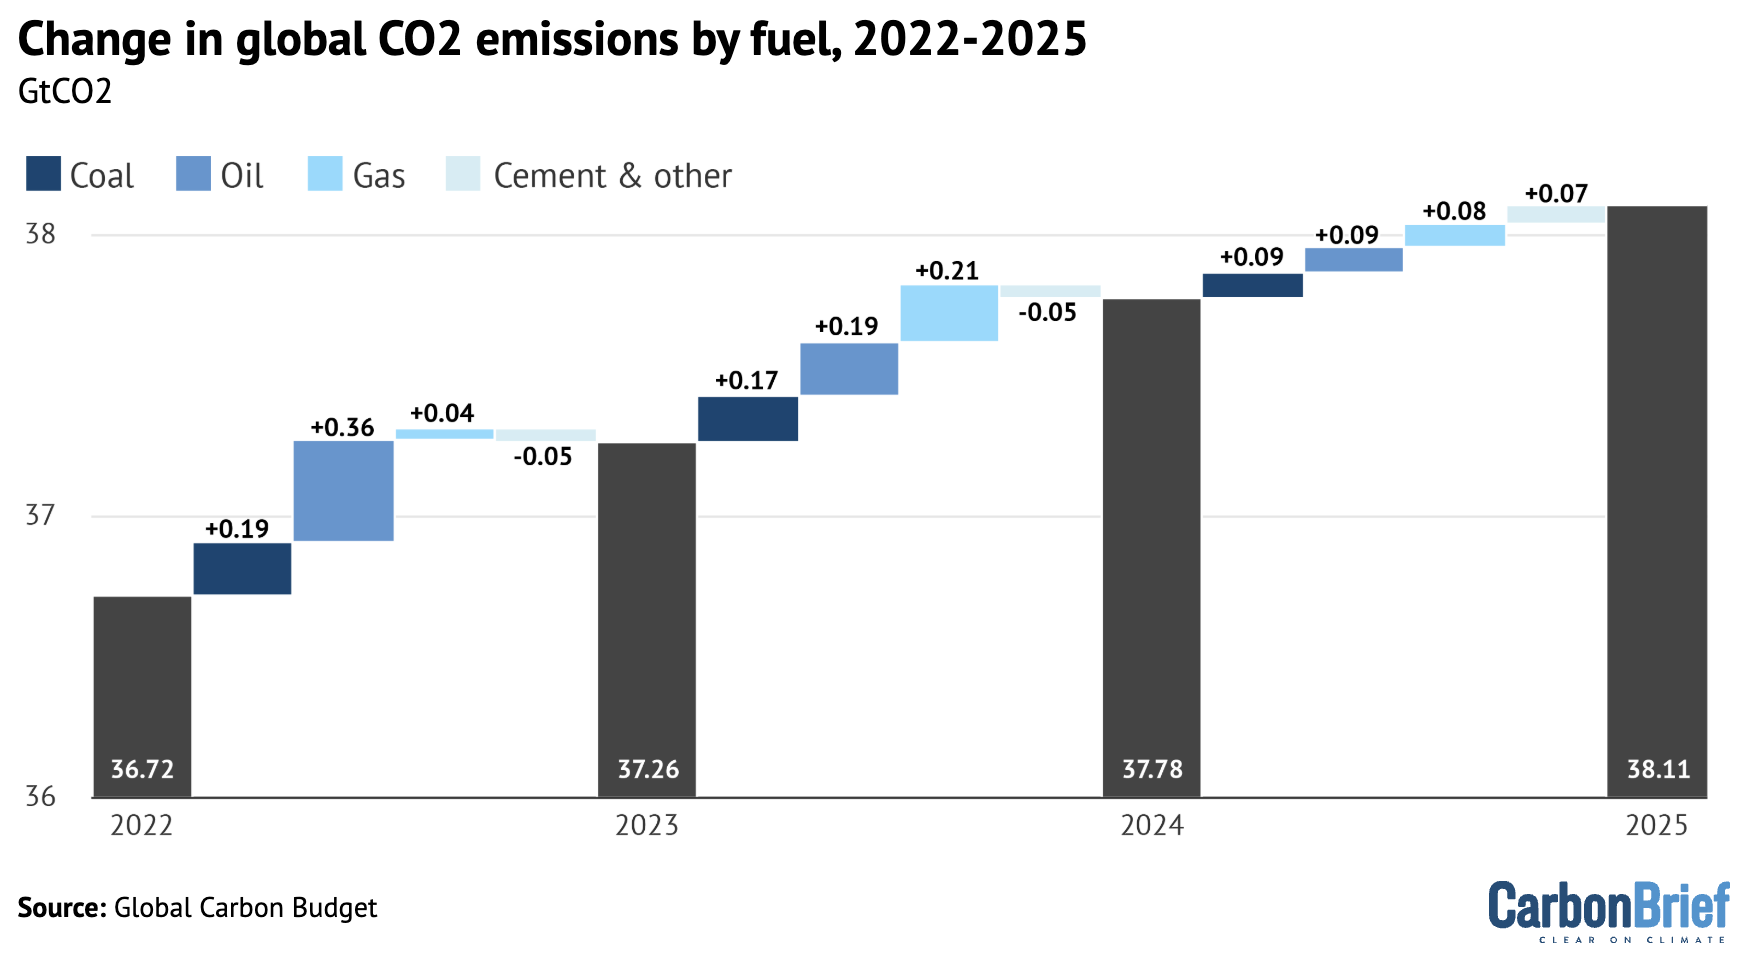
Global oil emissions were suppressed for a few years after the 2020, but rebounded to pre-pandemic levels as of 2024 and have continued to grow in 2025.
This reflects that, despite falling sales of internal combustion engine vehicles, not enough electric vehicles (EVs) have yet been sold to result in peak oil demand.
The global carbon budget
Every year, the Global Carbon Project provides an estimate of the overall “global carbon budget”. This is based on estimates of the release of CO2 through human activity and its uptake by the oceans and land, with the remainder adding to atmospheric concentrations of the gas.
(This differs from the commonly used term “remaining carbon budget”, which refers to the amount of CO2 that can be released while keeping warming below global limits of 1.5 or 2C.)
The most recent budget, including estimated values for 2025, is shown in the figure below.
Values above zero represent sources of CO2 – from fossil fuels and industry (dark blue shading) and land use (mid blue) – while values below zero represent carbon sinks that remove CO2 from the atmosphere. Any CO2 emissions that are not absorbed by the oceans (light grey) or land vegetation (mid grey) accumulate in the atmosphere (dark grey). In addition, a dashed black line is shown to represent the expected sum of sinks based on estimated emissions.
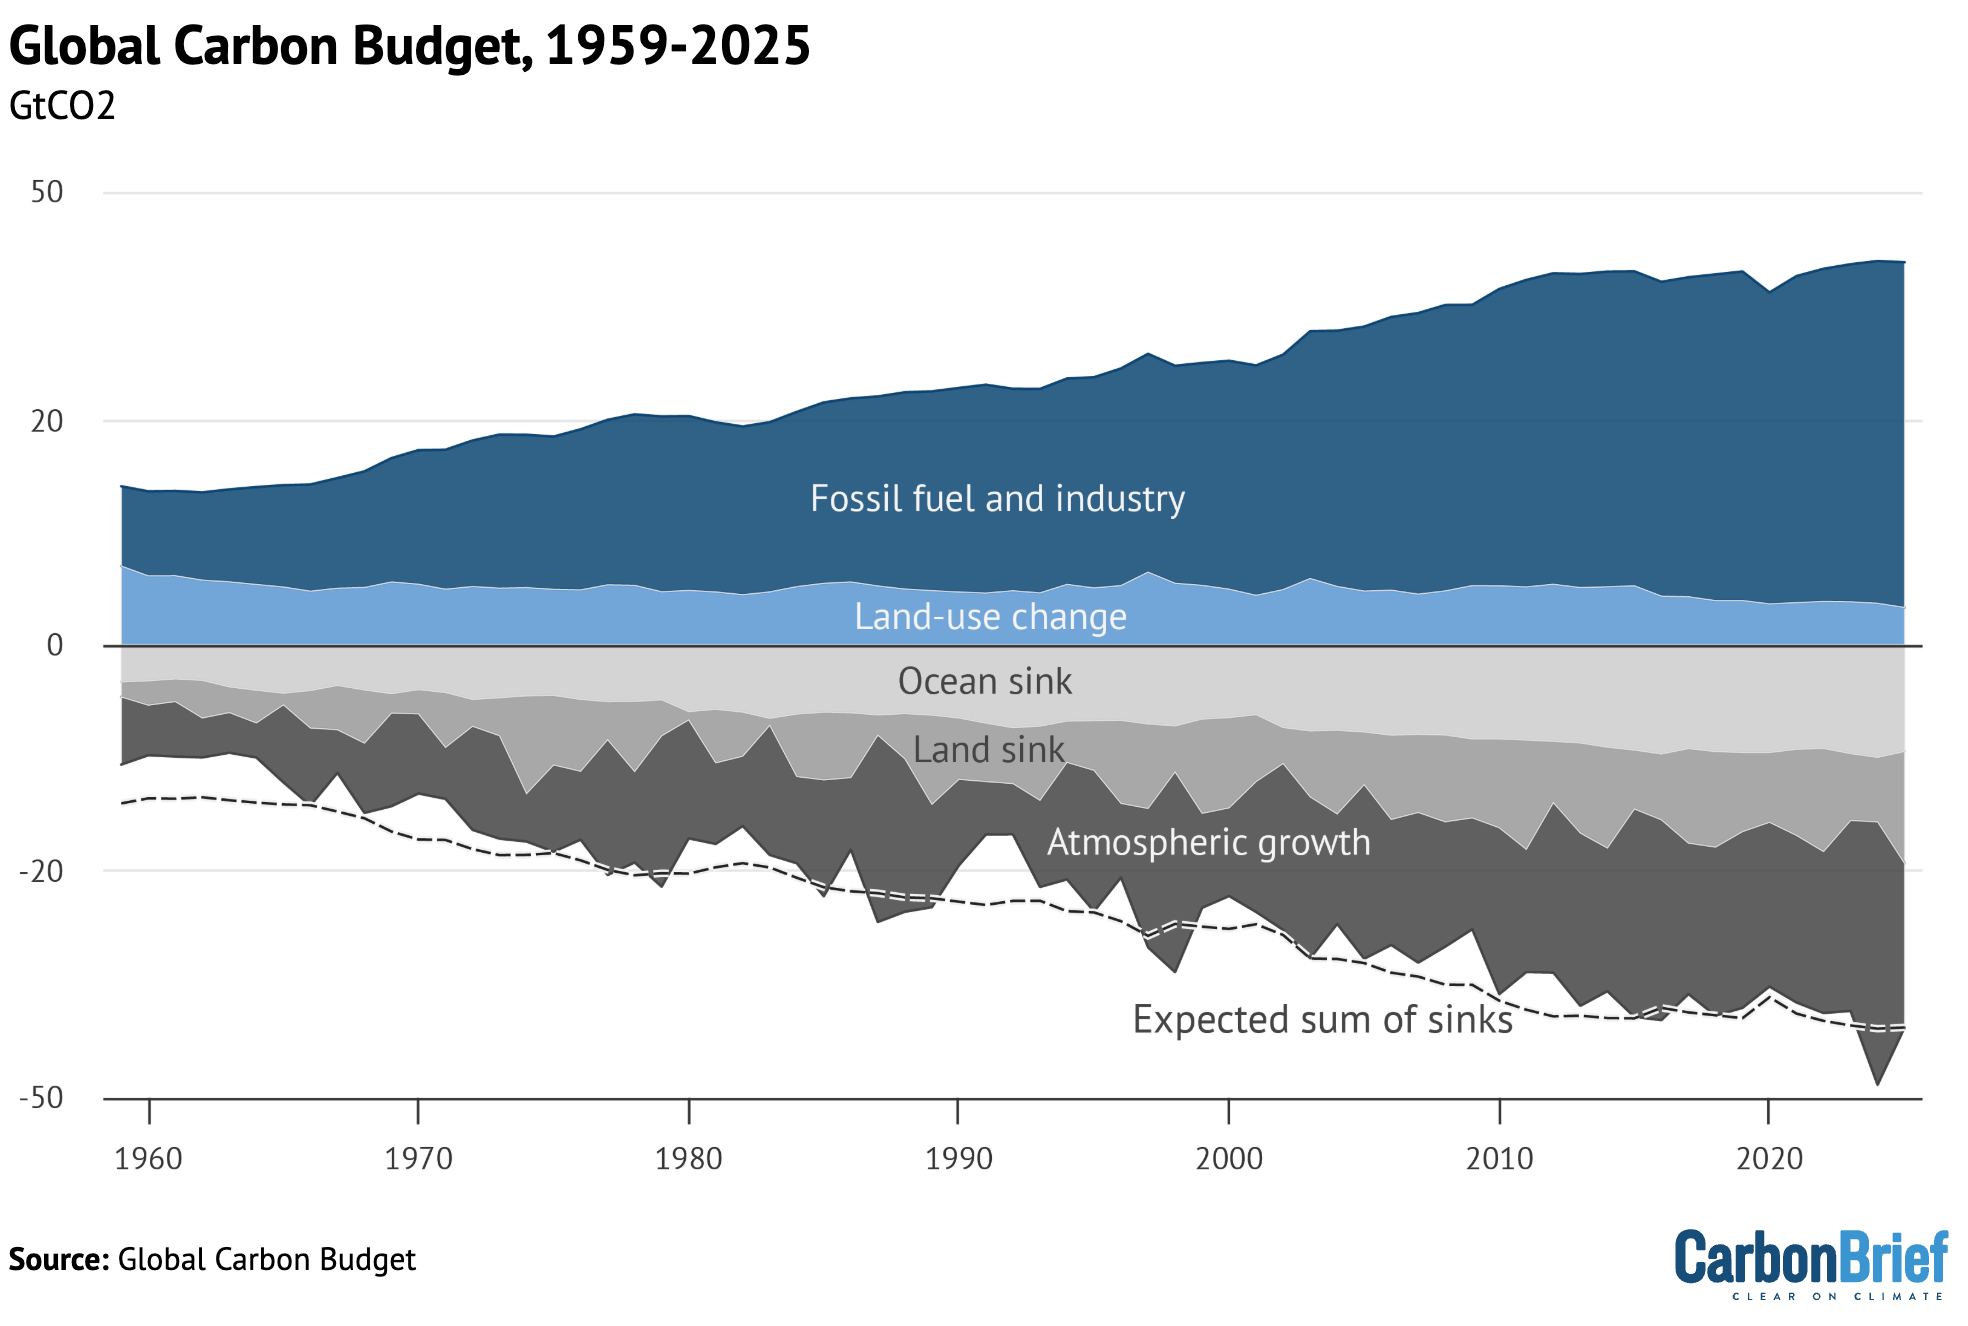
Over the past decade (2015-24), the world’s oceans have taken up approximately 29% of total human-caused emissions, or around 11.8GtCO2 per year.
The ocean CO2 sink has been relatively flat since 2014 after growing rapidly over the prior decades, reflecting the flattening of global emissions during that period.
This estimate for carbon sinks has been revised up from 26% in prior versions of the GCB, reflecting a major update to carbon budgets driven by new data and modelling of carbon sink behavior.
The land sink takes up around 21% of global emissions, or 8.7GtCO2 per year on average over the past decade – discussed in more detail in the section below. This is down from 29% in prior budgets.
The atmosphere continues to accumulate the bulk of human-caused CO2 emissions, with about 49% going into the atmosphere on average over the past decade – a rate of 20.4GtCO2 per year.
The growth rate of atmospheric CO2 in 2025 is expected to be around 2.3ppm, which is a bit below the decadal average rate of 2.6ppm over the past decade (2015-24). This is well below the record-setting rise of 3.7ppm in 2024, which was primarily driven by the effect of the 2023-24 El Niño conditions weakening the land sink.
Atmospheric CO2 concentrations are set to reach an annual average of 425.7ppm in 2025, representing an increase of 52% above pre-industrial levels of 280ppm.
There remains an unusual imbalance in the carbon budget in 2024, where the sum of the sinks is notably larger than estimated emissions. This can be seen in the figure above, where the dashed line is below the shaded area.
Budget imbalances are not unprecedented – there are large uncertainties in both emissions data and sink estimates. But the rise in the amount of CO2 accumulating in the atmosphere in 2024 is larger than would be expected based on emissions.
There are a number of potential explanations for this 2024 imbalance. The land cover data for 2024 is not yet complete and it is possible that some fire emissions data might be missing from the record. This might result in either higher land-use emissions or lower land sinks than currently estimated.
Alternatively, it could be due to the CO2 growth rate – captured by surface stations managed by the US National Atmospheric and Oceanic Administration (NOAA) – being slightly high. CO2 records for 2024 from these stations are higher than those obtained from satellite-based sensors, though it remains unclear which provides the most accurate measurement.
A declining, but not collapsing, land sink
After an unusually weak land carbon sink in 2023, there were a number of media articles about its potential collapse.
For example, in October 2024, the Guardian wrote that “the sudden collapse of carbon sinks was not factored into climate models – and could rapidly accelerate global heating”.
The truth is a bit more complicated. While the impending collapse of the land carbon sink has been greatly exaggerated, there is growing evidence of a long-term weakening of both the land and ocean carbon sinks due to human activity.
And while the land sink has recovered to its pre-El Niño strength in 2025, aided by relatively low global fire CO2 emissions, it will continue to gradually weaken as global temperatures rise. This is not unexpected – scientists have long foreseen a weaker carbon sink in a warmer world.
A weaker land sink will contribute to higher global temperatures in the future as more CO2 emissions from burning fossil fuels and land use change will accumulate in the atmosphere.
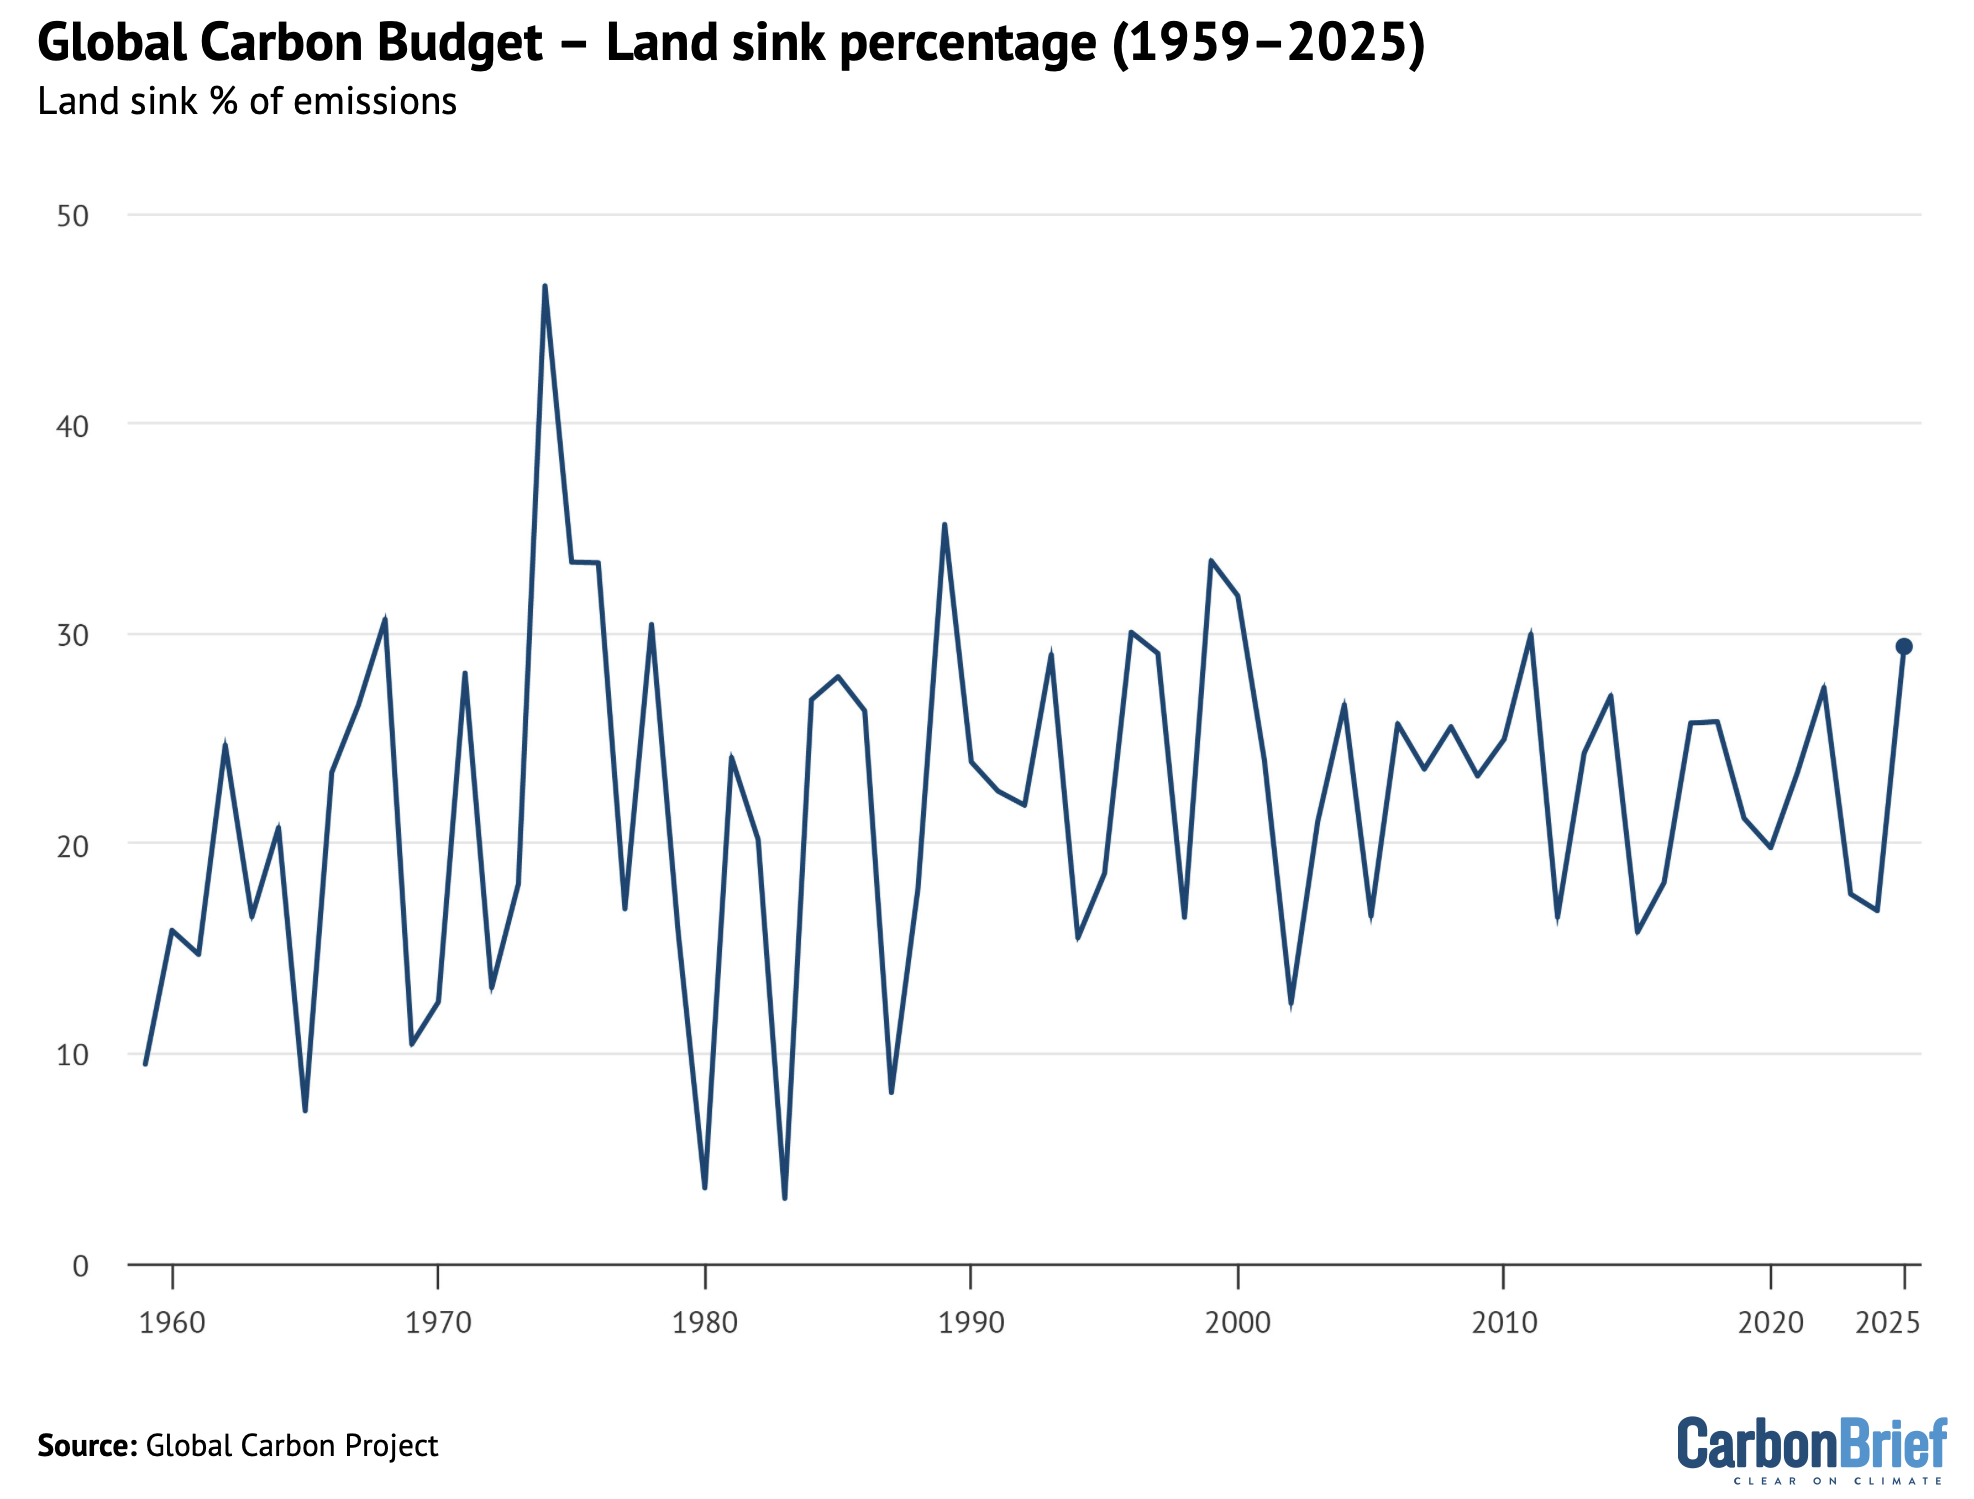
The figure below shows the percentage of human emissions absorbed by the land sink in every year since 1959, with a recovery upwards in 2025 after two relatively low years.
In a study published in Nature alongside the release of the 2025 Global Carbon Budget, the same team of researchers provide a detailed estimate of exactly how the land and ocean sinks have changed as a result of human activity.
The research finds that the land and ocean sinks are 25% smaller and 7% smaller, respectively, than they would have been without the effects of climate change over 2015-24.
This amounts to a nearly 20% reduction in the efficacy of current global carbon sinks – that is, both the land and ocean – and a 15% reduction compared to how large they would be without the effects of climate change.
The figure below, from the new paper, shows the impact of climate change on the ocean sink (blue), the land sink (green) and atmospheric CO2 concentrations (grey) since 1960.
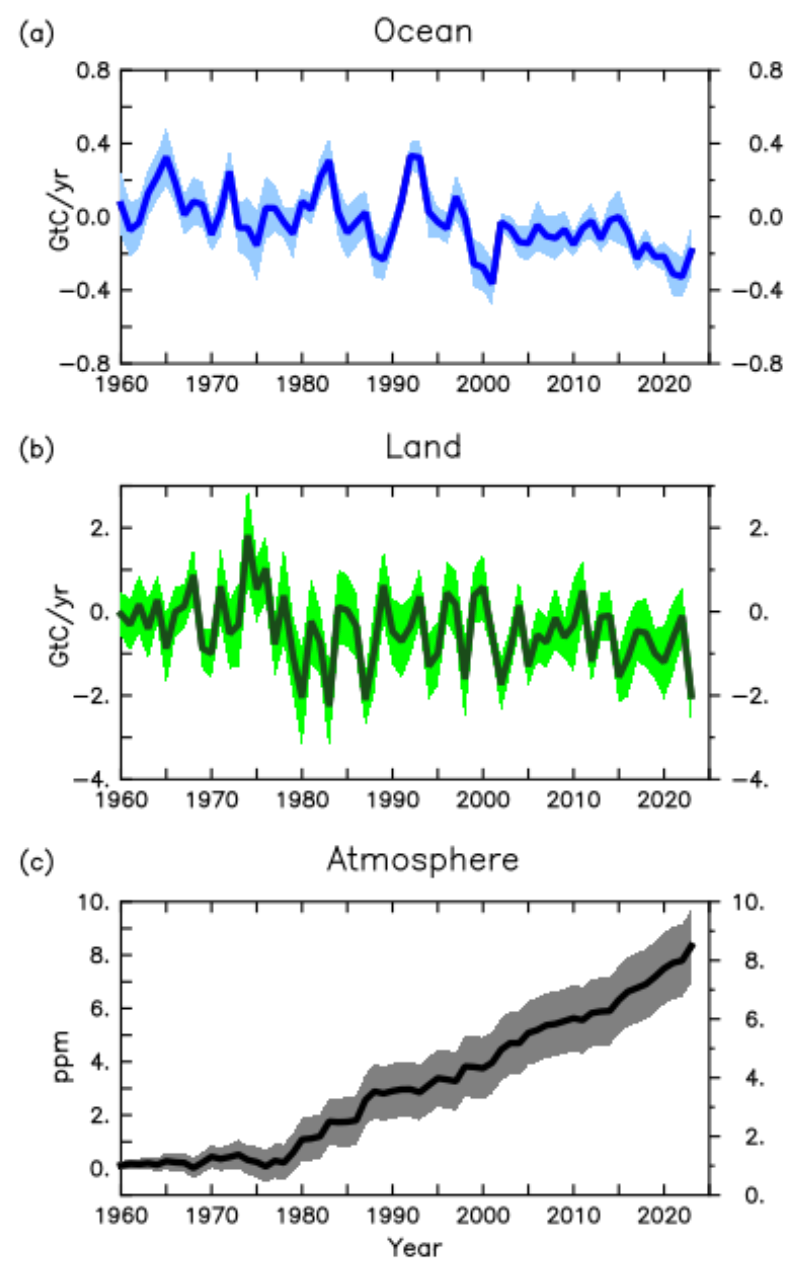
The weakening of carbon sinks due to human activity has led to an increase of atmospheric CO2 of more than 8ppm since 1960. The combined effects of climate change and deforestation have turned tropical forests in south-east Asia and in large parts of South America from CO2 sinks to sources.
And these sinks will likely continue to weaken as long as atmospheric CO2 concentrations continue to rise and the world continues to warm. There are a wide range of estimates of carbon cycle feedbacks among climate models, but a large carbon cycle feedback could result in a few tenths of a degree of future warming.


Friedlingstein, P. et al. (2025) Global Carbon Budget 2025, Earth System Science Data, doi:10.5194/essd-2025-659 (Currently published as a preprint and so the paper is still subject to change as part of the peer-review process.)