
Analysis: Global CO2 emissions from fossil fuels hit record high in 2022
Multiple Authors
11.11.22Multiple Authors
11.11.2022 | 12:01amGlobal carbon dioxide emissions from fossil fuels and cement have increased by 1.0% in 2022, new estimates suggest, hitting a new record high of 36.6bn tonnes of CO2 (GtCO2).
The estimates come from the 2022 Global Carbon Budget report by the Global Carbon Project. It finds that the increase in fossil emissions in 2022 has been primarily driven by a strong increase in oil emissions as global travel continues to recover from the Covid-19 pandemic. Coal and gas emissions grew more slowly, though both had record emissions in 2022.
Total global CO2 emissions – including land use and fossil CO2 – increased by approximately 0.8% in 2022, driven by a combination of steady land-use emissions between 2021 and 2022 and increasing fossil CO2 emissions. However, total CO2 emissions remain below their highs set in 2019 and have been relatively flat since 2015.
The 17th edition of the Global Carbon Budget, which is published today, also reveals:
- The remaining carbon budget keeping warming below 1.5C will be gone in nine years, if emissions remain at current levels.
- The increase in global fossil emissions in 2022 was driven by a small increase in US emissions and a larger increase in Indian and rest-of-the-world emissions. Chinese emissions saw a small decline, while EU emissions remained largely unchanged from 2021.
- Most of the increase in emissions was from oil. Coal saw a slight increase in emissions – somewhat smaller than might have been expected given the global energy crisis – while gas emissions remained flat and emissions from cement saw a slight decline
- Global CO2 concentrations set a new record of 417.2 parts per million (ppm), up 2.5ppm from 2021 levels. Atmospheric CO2 concentrations are now 51% above pre-industrial levels.
- The effects of climate change have reduced the CO2 uptake of the ocean sink by around 4% and the land sink by around 17%.
Global emissions remain relatively stable
The Global Carbon Project estimates that global emissions of CO2 – including land use and fossil CO2 – will remain relatively high at 40.5GtCO2 in 2022, but still below their 2019 peak of 40.9GtCO2.
The authors note that these emissions “are approximately constant since 2015” due to a modest decline in land-use emissions balancing out modest increases in fossil CO2.
The 2022 report includes small revisions to emissions estimates from previous years. The new figures suggest that emissions in recent years have been a little higher than those reported in the 2021 budget. The largest changes are in land-use emissions, which account for approximately three quarters of the upward revision in the 2022 budget over the past decade.
The figure below shows 2022 (solid blue line), 2021(dashed blue) and 2020 (dashed red) global CO2 emissions estimates from the Global Carbon Project, along with the uncertainty (shaded area) of the new 2022 budget. The new 2022 budget lies roughly halfway between the old 2020 budget (which showed continued growth in emissions) and the 2021 budget (which showed flat emissions).
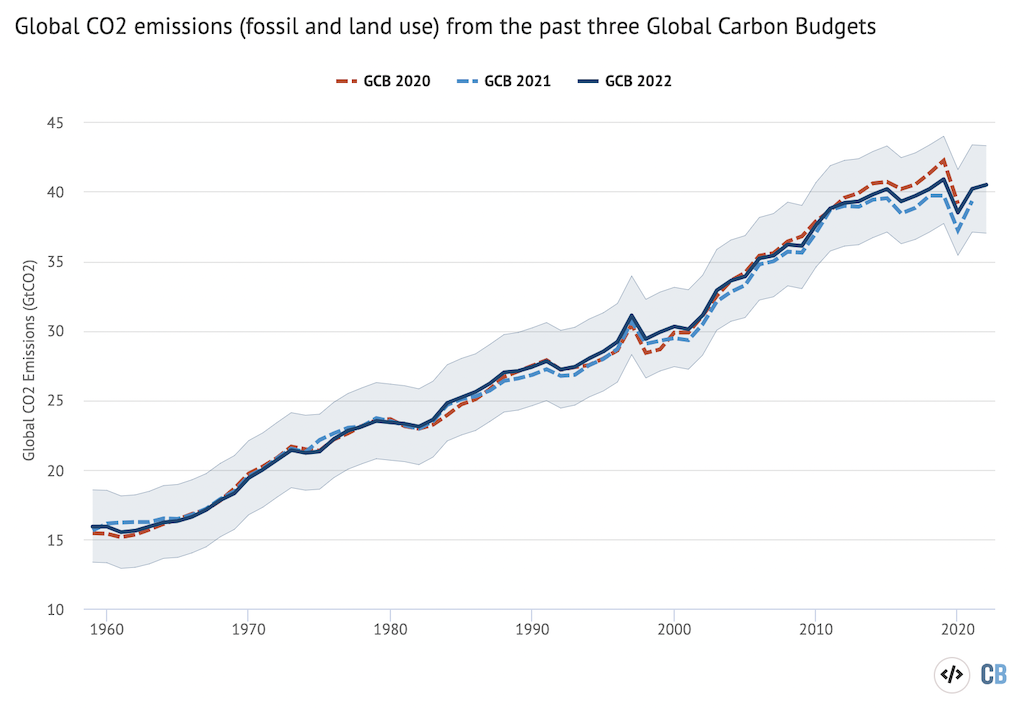
Annual total global CO2 emissions – from fossil and land-use change – between 1959 and 2022 for the 2020, 2021 and 2022 versions of the Global Carbon Project’s Global Carbon Budget, in billions of tonnes of CO2 per year (GtCO2). Shaded area shows the estimated one-sigma uncertainty for the 2022 budget. Data from the Global Carbon Project; chart by Carbon Brief using Highcharts.
While the apparent flattening of emissions in the 2022 budget is better than a world of increasing emissions, this good news comes with a few important caveats.
First, to meet global climate targets of limiting warming to well-below 2C, emissions do not just need to stabilise. They need to decline rapidly, reaching net-zero emissions in the latter half of the 21st century. As long as emissions remain significantly above zero, the world will continue to warm.
Second, the uncertainties surrounding land-use emissions remain quite high. Therefore, it is hard to rule out a scenario where these emissions have actually continued to increase over the past decade. Further research and data collection is needed to provide a better picture of trends in global land-use emissions in recent years.
"This is our critical decade to act"
— Leo Hickman (@LeoHickman) November 11, 2022
Scientists from @gcarbonproject inc @PFriedling couldn't have been clearer at their #COP27 press conf today.
Read the details about how global CO2 emissions hit record high in 2022 here…@hausfath @CarbonBriefhttps://t.co/JR4m5YWwtA pic.twitter.com/VJb3ZHxZY9
The figure below breaks down global emissions (black line) in the 2022 budget into fossil (grey) and land-use (yellow) components. Fossil CO2 emissions represent the bulk of total global emissions in recent years, accounting for approximately 91% of emissions in 2022 (compared to 9% for land-use). This represents a large change from the first half of the 20th century, when land-use emissions were approximately the same as fossil emissions.
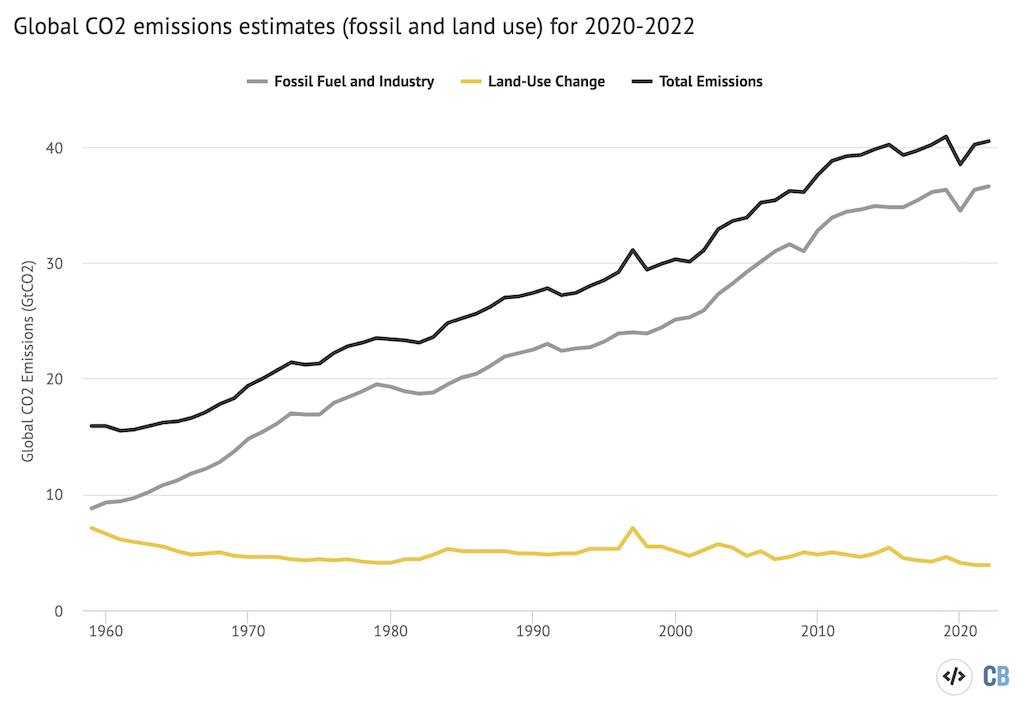
Global CO2 emissions (black line) separated out into from fossil (grey) and land-use change (yellow) components between 1959 and 2022 from the 2022 Global Carbon Budget. Note that fossil CO2 emissions are inclusive of the cement carbonation sink. Data from the Global Carbon Project; chart by Carbon Brief using Highcharts.
Global emissions from land-use are expected to be approximately 3.9GtCO2 in 2022. This is a slight decline from 2021 emissions, but the large uncertainty in the estimate makes it difficult to be confident in year-to-year changes.
Three countries – Indonesia, Brazil and the Democratic Republic of the Congo – are responsible for approximately 60% of global land-use emissions. Land-use change emissions over time from those three countries (along with their estimated uncertainties) are shown in the figure below.
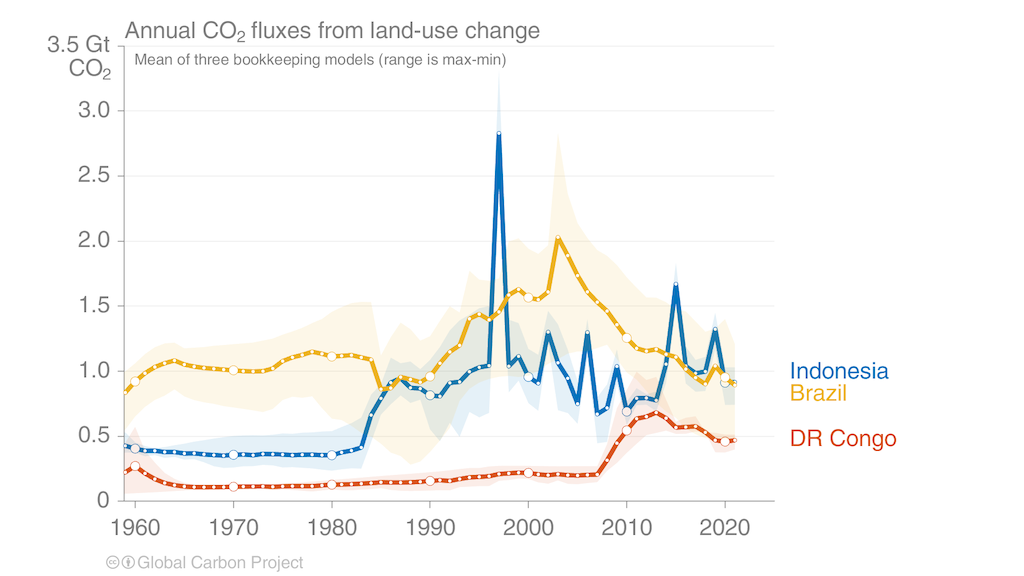
The Global Carbon Project finds that approximately half of the global emissions from deforestation (~6.7GtCO2 per year) are counterbalanced by reforestation (~3.5GtCO2 per year), while peat drainage and fires make a smaller contribution to emissions of around 0.8GtCO2.
The apparent decline in the net land-use emissions is likely driven by growing removals from reforestation, the report says.
Modest increase in fossil emissions despite declines in China
Despite a relatively modest increase of 1.0% in 2022 (with an uncertainty range of 0.1% to 1.9%), global fossil CO2 emissions will likely surpass the pre-pandemic high in 2019 to set a new record at 36.6GtCO2.
This represents a continued recovery in global emissions from the declines during the Covid-19 pandemic in 2020, as well as a failure of hopes that a “green recovery” could start taking emissions on a downward trend.
However, despite continued increases in fossil CO2 emissions, the rate of growth has slowed noticeably over the past decade.
The Global Carbon Project points out that “the latest data confirm that the rate of increase in fossil CO2 emissions has slowed, from +3% per year during the 2000s to about +0.5% per year in the past decade”.
The figure below shows global CO2 emissions from fossil fuels, divided into emissions from China (red shading), India (yellow), the US (bright blue), EU (dark blue) and the remainder of the world (grey).
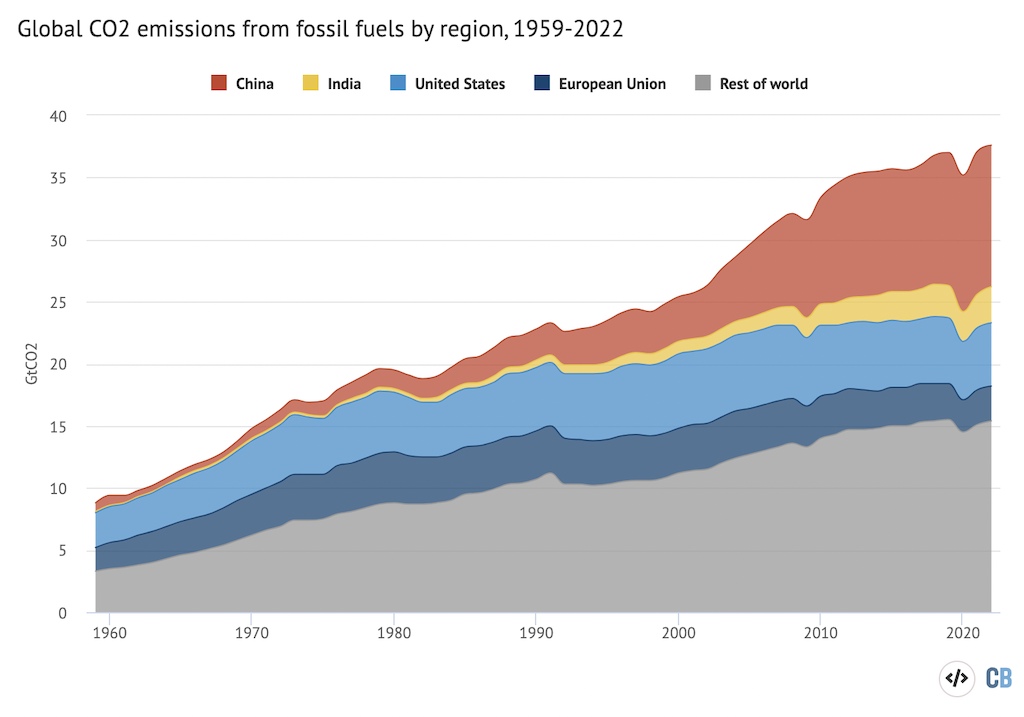
Annual fossil CO2 emissions for major emitters and rest-of-the-world from 1959-2022, excluding the cement carbonation sink as national-level values are not available. Note that 2022 numbers are preliminary estimates. Data from the Global Carbon Project; chart by Carbon Brief using Highcharts.
The US will likely see emissions increase by around 1.5% in 2022, driven by a strong rise in gas emissions (+4.7%), a modest rise in oil emissions (+2%) and a strong decline in coal emissions (-4.6%).
The European Union (EU) is likely to see a 0.8% decline in emissions in 2022, driven by lower gas use associated with Russia’s attack on Ukraine and the resulting global energy market disruption.
EU demand for gas may be down by as much as 10% this year, while emissions from coal are expected to increase by close to 7% as it substitutes for high-cost gas.
In China, emissions declined by around 0.9% in 2022, primarily driven by continued lockdowns associated with Covid-19 that slowed both industrial activity and economic growth.
Chinese emissions show declines in emissions from oil (-2.8%), gas (-1.1%) and cement production (-7%), only showing a slight increase in emissions from coal (+0.1%). The Global Carbon Project notes that cement, in particular, played a large role in declining Chinese emissions due to a slowdown in the property market. (See Carbon Brief’s recent detailed analysis by Lauri Myllyvirta of China’s Q3 2022 emissions.)
Indian emissions are projected to increase by 6% in 2022, mostly due to a large (+5%) increase in coal emissions as well as higher (+10%) oil use as the transport sector recovers from pandemic declines.
The rest of the world (including international aviation and shipping) is projected to see a 1.7% increase in emissions, driven by a rise in coal (+1.6%), oil (+3.1%) and cement (+3%). Gas emissions in the rest of the world are projected to decline very slightly in 2022 (-0.1%).
The chart below shows total emissions for each year between 2019 and 2022, as well as the contributions from major emitters and the rest of the world countries. Annual emissions for 2019, 2020, 2021 and the estimates for 2022 are shown by the black bars. The coloured bars show the change in emissions between each set of years, broken down by country. Negative values show reductions in emissions, while positive values reflect emission increases.
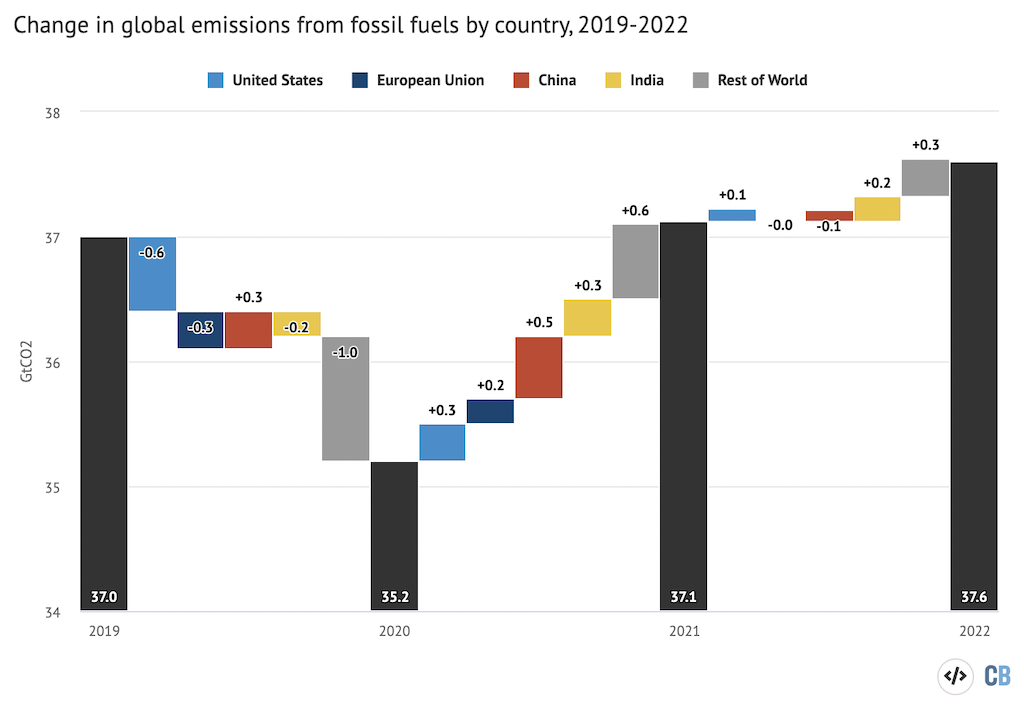
Annual global CO2 emissions from fossil fuels (black bars) and drivers of changes between years by fuel (coloured bars), excluding the cement carbonation sink. Negative values indicate reductions in emissions. Note that the y-axis does not start at zero. Data from the Global Carbon Project; chart by Carbon Brief using Highcharts.
Global fossil CO2 emissions are now approximately 0.9% higher than in 2019. While emissions in the US, EU and the rest of the world remain below pre-pandemic levels, emissions in China are now 5.8% above 2019 levels and are 9.3% above 2019 levels in India.
The figure below shows how global and national emissions in the years 2020 (blue bars), 2021 (yellow) and 2022 (red) compare to 2019 emissions.
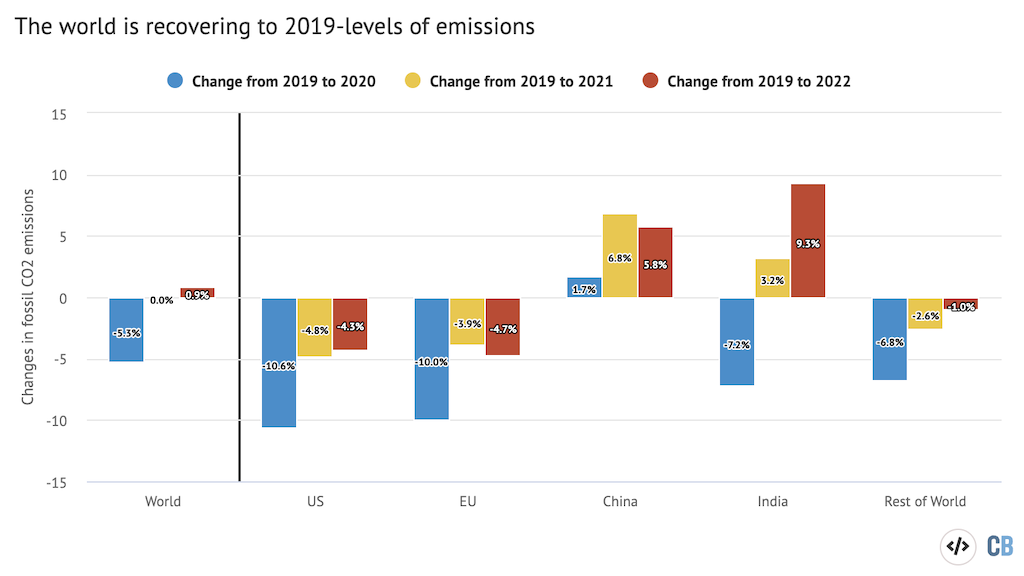
Percent change in CO2 between 2019 and 2020, 2021 and 2022 for the world as a whole and for major emitting countries/regions. Note that global emissions are inclusive of the cement carbonation sink, but national inventories are not. Data from the Global Carbon Project; chart by Carbon Brief using Highcharts.
The Global Carbon Project also notes that emissions declined over the past decade (2012-21) in 24 nations despite continued domestic economic growth, bringing hope in long-term decoupling of CO2 emissions and the economy.
| Belgium | Croatia | Czech Republic | Denmark |
| Estonia | Finland | France | Germany |
| Hong Kong | Israel | Italy | Japan |
| Luxembourg | Malta | Mexico | Netherlands |
| Norway | Singapore | Slovenia | Sweden |
| Switzerland | United Kingdom | USA | Uruguay |
These 24 countries represent around a quarter of global CO2 emissions. Fifteen of these countries also had significant declines in consumption-based emissions, which account for emissions embodied in the import and export of goods.
Coal and gas hits record high emissions
Global fossil fuel emissions primarily result from the combustion of coal, oil and gas.
Coal is responsible for more emissions than any other fossil fuel, representing approximately 40% of global fossil CO2 emissions in 2022. Oil is the second largest contributor at 32% of fossil CO2, while gas and cement production round out the pack at 21% and 4%, respectively.
These percentages reflect both the amount of each fossil fuel consumed globally, but also differences in CO2 intensities. Coal results in the most CO2 emitted per unit of heat or energy produced, followed by oil and gas.
The figure below shows global CO2 emissions from different fuels over time. While coal emissions (grey shading) increased rapidly in the mid-2000s to support the unprecedented growth of the Chinese economy, it has largely plateaued since 2013. However, coal use increased significantly in 2021 and modestly in 2022, causing 2022 to slightly edge out 2014 and set a new record of 15.1GtCO2.
By contrast, gas (blue) and oil (red) emissions have steadily grown prior to the pandemic. Gas rapidly recovered from Covid-19 disruptions, setting new all-time records for emissions in both 2021 and 2022. Oil emissions, by contrast, still remain below pre-pandemic 2019 highs as travel has not fully recovered from its severe drop during the pandemic.
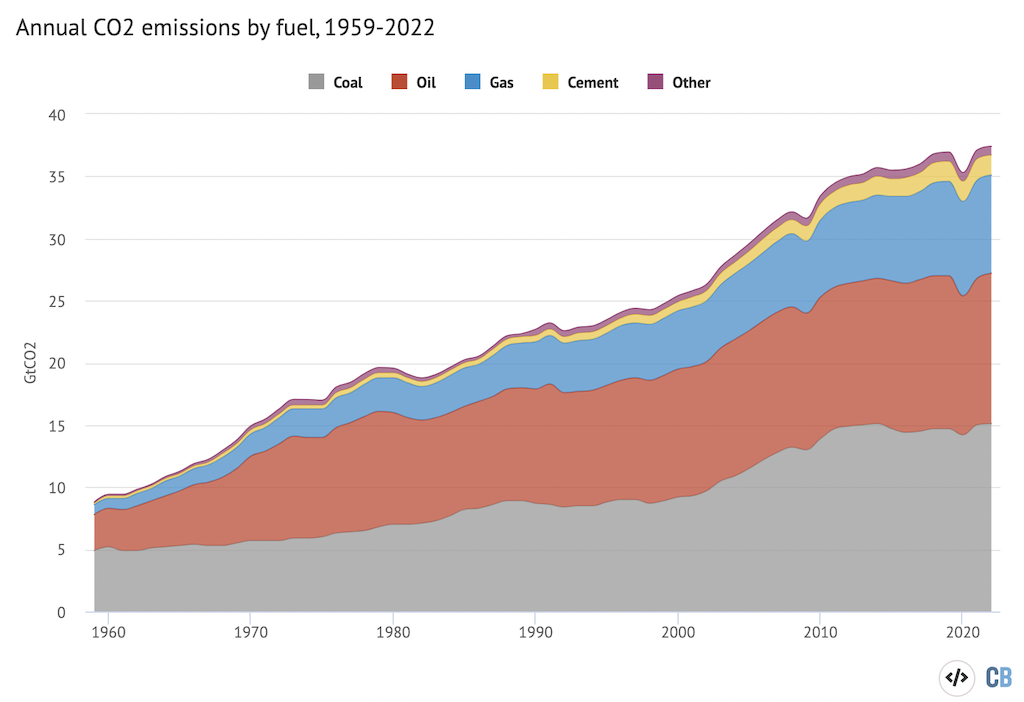
Annual CO2 emissions by fossil fuel from 1959-2022, excluding the cement carbonation sink. Note that 2022 numbers are preliminary estimates. Data from the Global Carbon Project; chart by Carbon Brief using Highcharts.
Global coal emissions are projected to rise by around 1% in 2022, relative to 2021 levels, driven primarily by increases in India, the EU and the rest of the world, despite continued declines in coal use in the US.
Oil emissions are projected to rise by around 2.2% in 2022, compared to 2021. This has been caused by continued recovery of the transport sector from pandemic-related disruptions, though it will remain below 2019 levels.
Gas emissions are expected to decline slightly by around 0.2%, driven primarily by large declines in gas use in the EU associated with high energy costs due to the war in Ukraine.
Cement emissions are projected to decrease by around 1.6%, caused largely by declines in Chinese cement production for construction.
The total emissions for each year between 2019 and 2022, as well as the change in emissions for each fuel between years, are shown in the figure below.
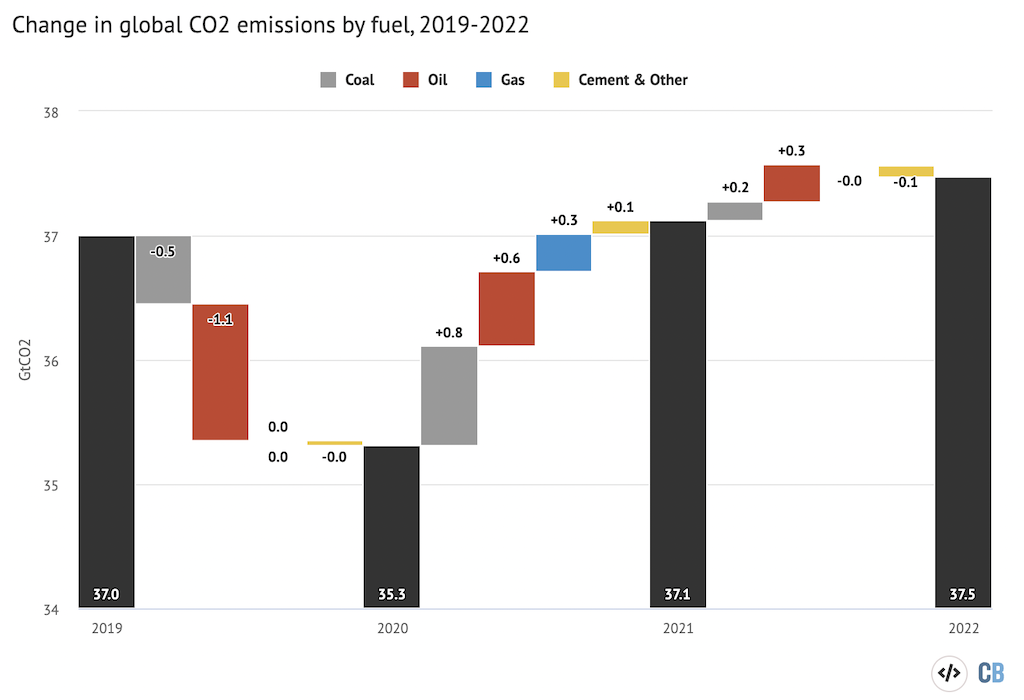
Annual global CO2 emissions from fossil fuels (black bars) and drivers of changes between years by fuel (coloured bars), excluding the cement carbonation sink. Negative values indicate reductions in emissions. Note that the y-axis does not start at zero. Data from the Global Carbon Project; chart by Carbon Brief using Highcharts.
The global carbon ‘budget’
Every year, the Global Carbon Project provides an estimate of the “global carbon budget”.
This budget is based on estimates of the release of CO2 through human activity and its uptake by the oceans and land, with the remainder adding to atmospheric concentrations of this greenhouse gas.
(This differs from the commonly used term “remaining carbon budget”, referring to the amount of CO2 that can still be released in the future while keeping warming below global limits of 1.5 or 2C.)
The most recent budget, including estimated values for 2022, is shown in the figure below. Values above zero represent anthropogenic sources of CO2 – from fossil fuels and cement (grey shading) and land use (yellow) – while values below zero represent the growth in atmospheric CO2 (bright blue) and the ocean (dark blue) and land (green) “carbon sinks” that remove CO2 from the atmosphere.
In short, any CO2 emissions that are not absorbed by the oceans or land vegetation will accumulate in the atmosphere. While observations of both emissions and carbon sinks have improved over time, the budget does not fully balance every year due to remaining uncertainties, particularly in sinks. On average, the budget imbalance is close to zero, but some individual years may have more emissions than sinks or vice versa.
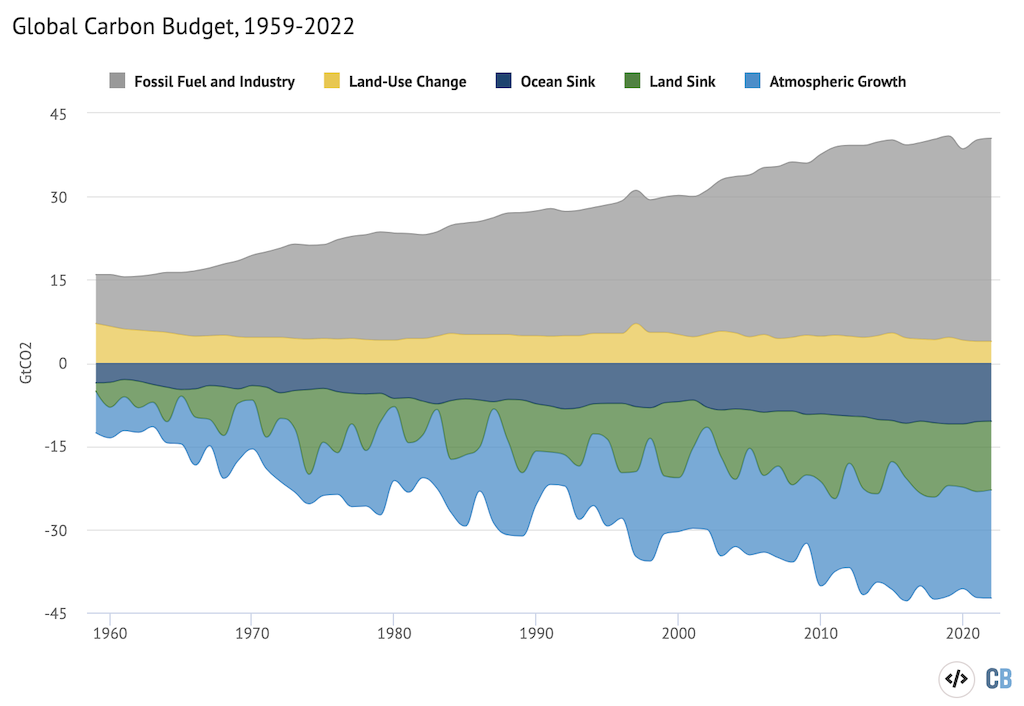
Annual global carbon budget of sources and sinks from 1959-2022. Fossil CO2 emissions include the cement carbonation sink. 2022 numbers are preliminary estimates. Data from the Global Carbon Project; chart by Carbon Brief using Highcharts.
The atmospheric CO2 concentration increased 2.5 parts per million (ppm) in 2021 and is projected to increase by around 2.5ppm in 2022, resulting in global atmospheric concentrations of 417.2ppm on average for the year.
This represents an increase in atmospheric CO2 of around 51%, relative to pre-industrial levels.
As the chart below illustrates, the fraction of CO2 emissions that end up in the atmosphere varies from year to year. The grey dashed lines shows that around 47% of total CO2 emissions have remained in the atmosphere each year over the past decade, with the remainder being taken up by ocean and land sinks.
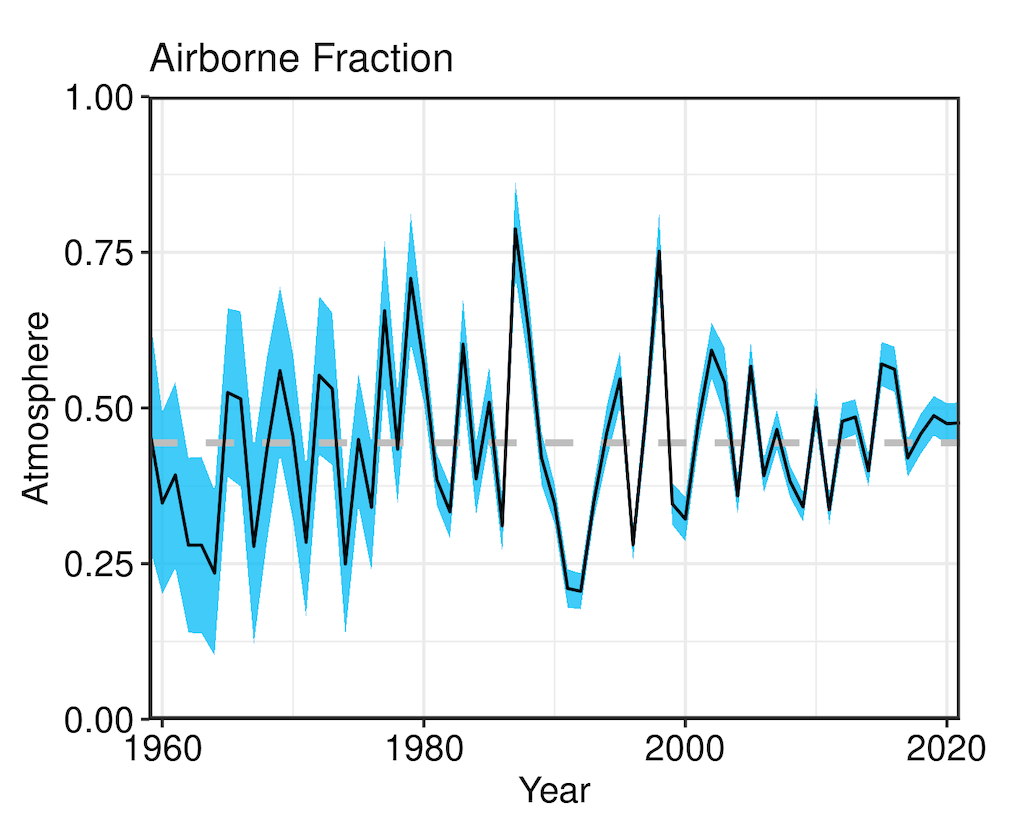
The ocean carbon sink grew rapidly over the past two decades, absorbing approximately 26% of global emissions in 2022. The land sink has also continued to increase and is projected to absorb around 31% of global emissions in 2022. These sinks are expected to grow as CO2 emissions increase, as the amount of CO2 absorbed by both the ocean and land scales proportional to atmospheric concentrations.
However, these sinks cannot expand forever; effects of climate change – and the acidification of the surface oceans – are projected to weaken these sinks over time.
The new Global Carbon Budget report warns that climate change has already reduced the CO2 uptake of the ocean sink by around 4% and the land sink by around 17%, compared to a theoretical world without climate change.
If emissions continue to increase, the portion of global emissions remaining in the atmosphere – that is, the airborne fraction – will grow, making the amount of climate change the world experiences worse than it otherwise would be.


Friedlingstein, P. et al. (2022) Global Carbon Budget 2022, Earth System Science Data, doi:10.5194/essd-14-4811-2022