Analysis: Just four years left of the 1.5C carbon budget
Update: This article has been superseded by more recent analysis on the 1.5C carbon budget and also the budgets within the IPCC special report on 1.5C.
Four years of current emissions would be enough to blow what’s left of the carbon budget for a good chance of keeping global temperature rise to 1.5C.
That’s the conclusion of analysis by Carbon Brief, which brings the Intergovernmental Panel on Climate Change’s (IPCC) carbon budgets up to date to include global CO2 emissions in 2016.
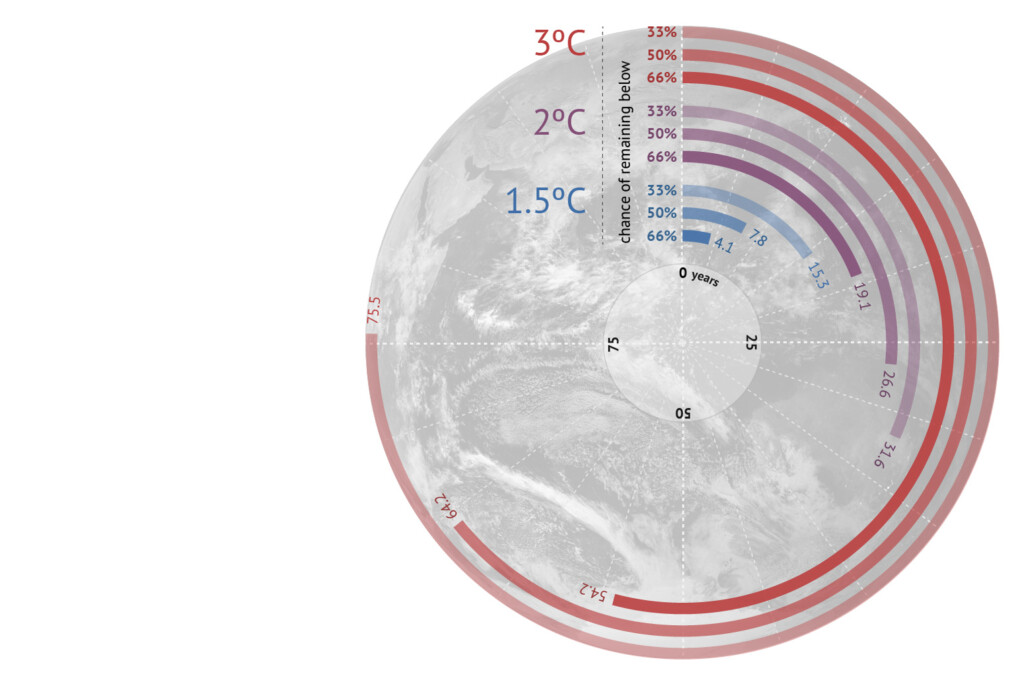
Our infographic above shows how quickly the budgets for 1.5C, 2C and 3C will be used up if emissions continue at the current rate. For 1.5C, this could be a soon as four years’ time.
CO2 emissions
The IPCC has previously laid out estimates of how much CO2 we can emit and still keep global average temperature rise to no more than 1.5C, 2C or 3C above pre-industrial levels. These are known as carbon budgets.
For each temperature limit there are three budgets, each corresponding to a different probability of staying below that limit: 66%, 50% and 33%. (Strictly speaking, these aren’t probabilities, but are the proportion of all the model simulations that keep warming below that temperature limit.)
Now that provisional data is available for 2016, we can see what shape the budgets are in after another year of emissions.
Update for 2016
According to the Global Carbon Project, CO2 emissions from fossil fuel burning and cement production in 2016 totalled 36.4bn tonnes, a rise of less than 1% compared to last year. This is the third year in a row of very small emissions growth, tentatively suggesting they may be showing signs of peaking.
Including emissions from land use change – only an estimate at present – puts total CO2 emissions at 39.9bn tonnes for 2016. This is slightly below the 41.1bn tonnes from 2015, which saw large land use emissions as a result of peat fires in Asia.
The animation below shows how the carbon budgets look at the end of 2016. With the current rate of emissions, there are now just four years and one month left in the budget for 1.5C.
You can see the calculations and full results here.
Data visualisation and animation by Rosamund Pearce for Carbon Brief, featuring the voice of Jocelyn Timperley. Data from the IPCC.You can read more about the different methods of constructing carbon budgets in an earlier Carbon Brief article.
Pathways for the 21st century
Another way to look at our CO2 emissions is to compare them with scenarios for the rest of this century.
Scientists have developed a set of pathways for how technology, energy and land use, and the concentration of greenhouse gases in the atmosphere could change over the centuries ahead. The four “Representative Concentration Pathways” (RCPs) each provide a plausible description of the future, based on socio-economic scenarios of how the global society grows, develops, and uses land and energy.
Scientists then use these pathways as inputs for climate models to generate projections of climate change impacts and assess the effects of cutting emissions. By using the same scenarios, scientists from different research centres around the world can directly compare their results.
The four RCPs are named after the amount of “radiative forcing” they cause by the end of the century – this is the change in energy that, on balance, warms the Earth as a result of a stronger greenhouse effect.
The chart below shows how actual emissions from 1959 up to the present day compare with each of the four RCP pathways for the rest of the century. At present, we are tracking closest to RCP8.5, the highest of the four.
Historical data from the Global Carbon Project and scenarios from the Potsdam Institute for Climate Impact Research, plotted by Carbon Brief.Below is a brief summary of each RCP, which describe how the concentration of CO2 in the atmosphere changes under each pathway. (Note, the chart above shows the annual CO2 emissions, not the total amount of CO2 in the atmosphere.)
RCP2.6 (also sometimes referred to as “RCP3-PD”): A “peak and decline” scenario where stringent mitigation and Carbon Dioxide Removal technologies mean atmospheric CO2 concentration peaks and then falls during this century. By 2100, atmospheric CO2 reaches around 420 parts per million (ppm) – about 20 ppm above current levels. In this scenario, global temperatures are likely to rise by 1.3-1.9C above pre-industrial levels by 2100.
RCP4.5: A “stabilisation scenario” where policies are put in place so atmospheric CO2 concentration levels off around the middle of the century, though temperatures do not stabilise before 2100. These policies include a shift to low-carbon energy technologies and the deployment of carbon capture and storage. In RCP4.5, atmospheric CO2 sits at 540 ppm by 2100 – roughly 140 ppm higher than now – and the global temperatures are likely to rise by 2-3C above pre-industrial levels.
RCP6.0: A “climate-policy intervention scenario” where emissions peak around 2060 and then decline. CO2 concentration continues to rise through the rest of the century, but at a slower rate. There are only “very modest” efforts towards mitigation between 2010 and 2060, but improvements in energy intensity and a global market for emissions permits help limit atmospheric CO2 to 670 ppm by 2100. In RCP6.0, global temperatures by 2100 are likely to be 2.6-3.7C above pre-industrial.
RCP8.5: A scenario of “comparatively high greenhouse gas emissions“ brought about by rapid population growth, high energy demand, fossil fuel dominance and an absence of climate change policies. This “business as usual” scenario is the highest of the four RCPs and sees atmospheric CO2 rises to around 935 ppm by 2100. The likely range of global temperatures by 2100 for RCP8.5 is 4.0-6.1C above pre-industrial levels.
You can read more about each RCP in the original journal articles published in Climatic Change (see links in the RCP names above). All the papers, except for RCP6.0, are free to read, download and print.
Scientists are also developing four more RCPs to fill in the gaps between and around the four already in use. Following its inclusion in the Paris Agreement, one of these new RCPs will explicitly investigate staying below 1.5C. However, these model runs will not be available in time for the IPCC’s Special Report on 1.5C, which is due to be published in September 2018.