Analysis: How December 2015 topped chart as UK’s wettest month on record
Roz Pidcock
01.05.16Roz Pidcock
05.01.2016 | 5:52pmWith pictures of flooded towns and villages still filling our national newspapers, official figures released today confirm that December 2015 was the UK’s wettest month on record, seeing more rain than any other month since 1910.
Storms delivered a total of 230mm of rain across the UK, according to the Met Office analysis. That’s nearly twice as much as the long-term December average between 1981-2010.
Today’s news has been widely covered, including by the Telegraph, Guardian, Daily Mail and BBC News.
Chart topper
The chart below, produced by Carbon Brief using the new Met Office data – updated to include the whole of December – shows how individual years in the 105-year record rank alongside each other. You can see 2015, marked out in red, topping the chart by some margin.
(Click to expand)
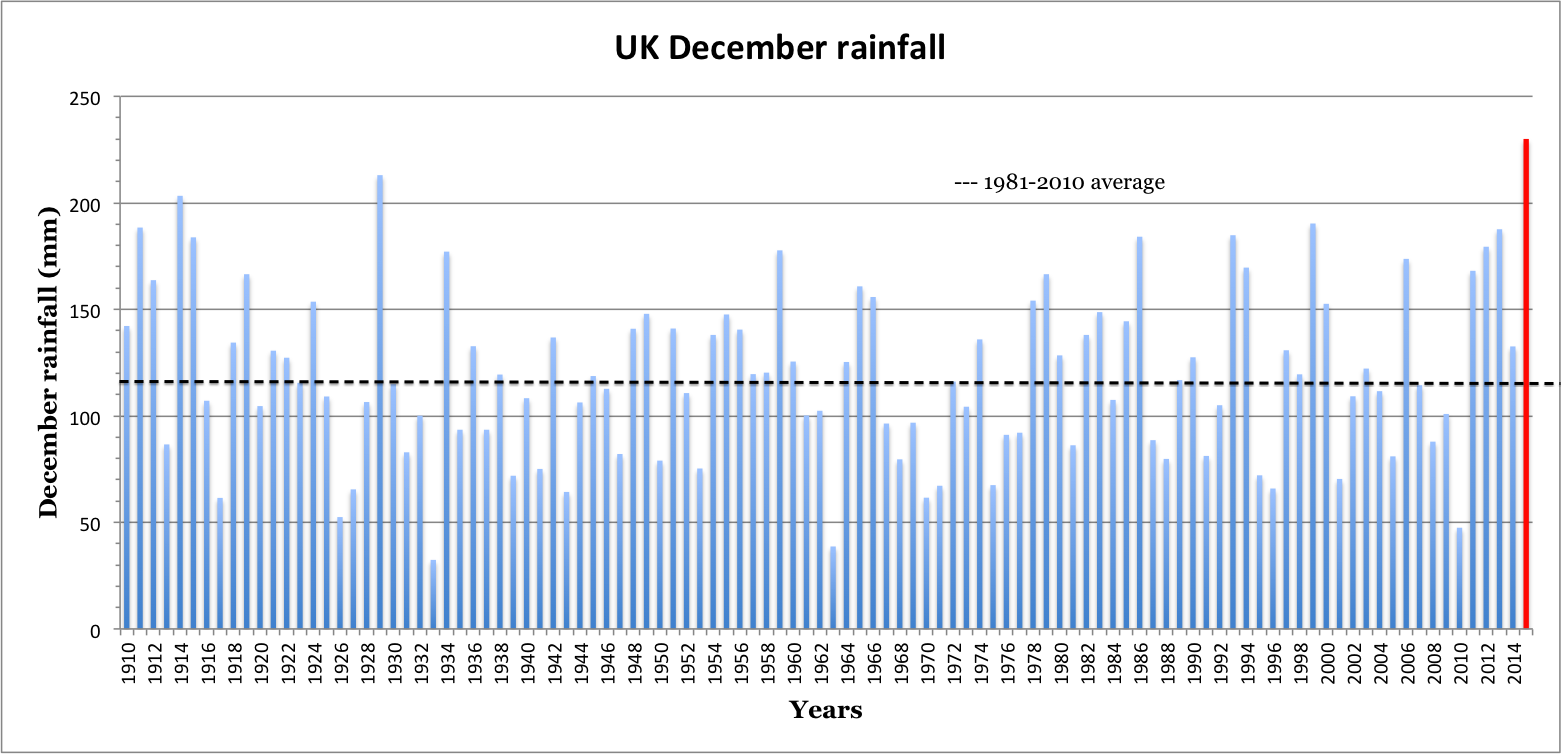
Total rainfall in mm for December from 1910-2015. Carbon Brief chart using Met Office data.
So much rain in a short space of time meant the ground quickly became saturated, leading to severe flooding.
The new Met Office data counters recent media articles attempting to downplay December’s rainfall and the possible role of climate change. In yesterday’s Times, Matt Ridley claims December 2015 saw less rain than the same month in 1929 (Incidentally, Carbon Brief recently asked climate scientists to respond to climate change claims made by Matt Ridley in a recent BBC interview. You can see the full annotated transcript here.)
In yesterday’s article, headlined “Don’t blame climate change for these floods”, Ridley says:
Finally, please resist the cheap excuse of climate change. It was Britain’s second wettest December: the same month in 1929 was wetter, so this kind of saturation could easily have happened even if climate change was not occurring.
In fact, Ridley’s article jumped the gun, using provisional figures from the Met Office that didn’t include the final few days of December. The final figures show December saw 17mm more than the same month in 1929.
Even had that not been the case, there’s another element to the recent flooding.
Compare the maps below for rainfall in December 2015 (left) and 1929 (right). Notice that the rain was very widespread in the latter, making it an exceptionally wet month for the UK as a whole. But the picture looks very different in 2015. A greater amount of rain fell over a much smaller area, largely concentrated in the north of the country.
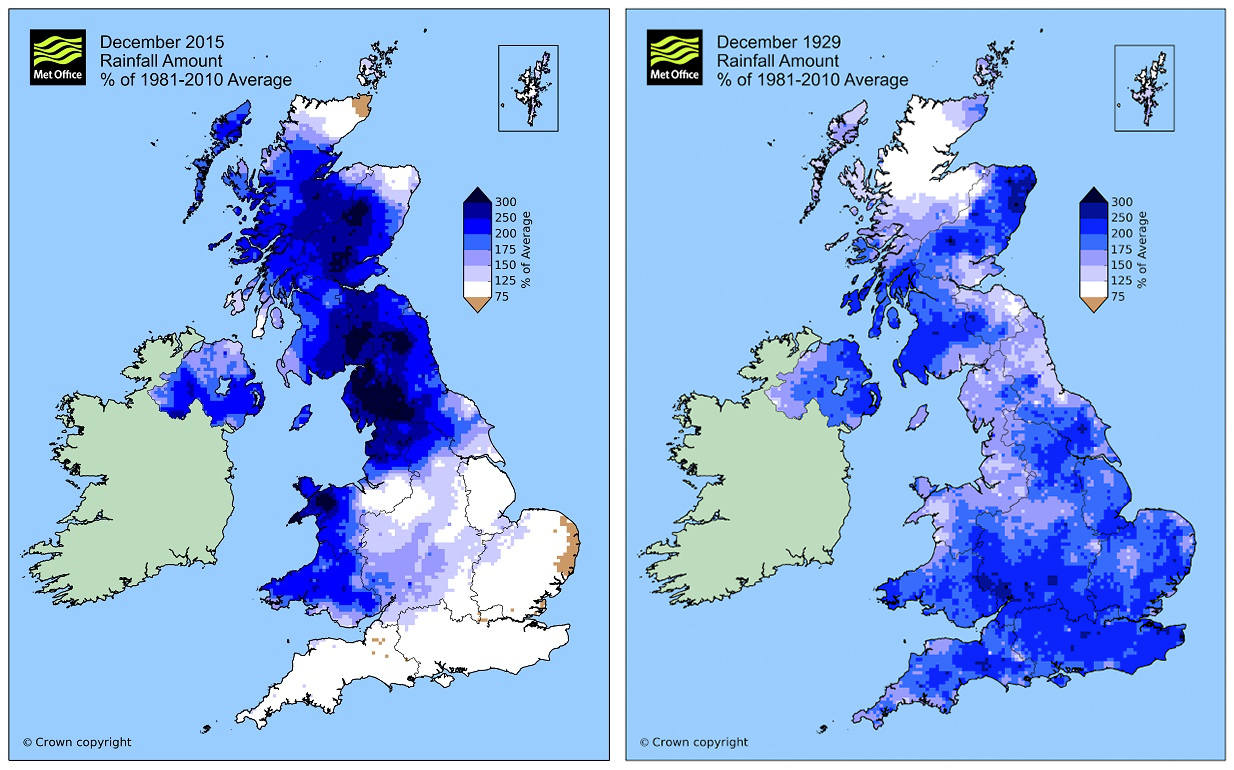
A comparison of rainfall across the UK in December 2015 (left) and December 1929 (right). Courtesy of the Met Office news blog and Dr Mark McCarthy (by email).
The dark blue colours in the maps show how large parts of northern England, Scotland and Wales saw more than 300% more rain than the 1981-2010 long-term average.
The Met Office’s Dr Mark McCarthy tweeted earlier today that Braemar in Aberdeenshire saw 420% more rain than average for the month of December.
@jimmcquaid @LeoHickman yes they are percentage anomalies. Highest values were 420% (Braemar) and 388% (Shap) …>
— Mark McCarthy (@markpmcc) January 5, 2016
Region-by-region
You can see how December’s record rainfall breaks down region-by-region in the graphs below.
The four graphs below show the top five ranking years for December rainfall for each region of the UK, with 2015 highlighted in red. The black dotted lines indicate the 1981-2010 average.
You can see that December 2015 was the wettest on record for Scotland and Wales, and the second wettest for Northern Ireland. In England, December ranks as the 12th wettest.
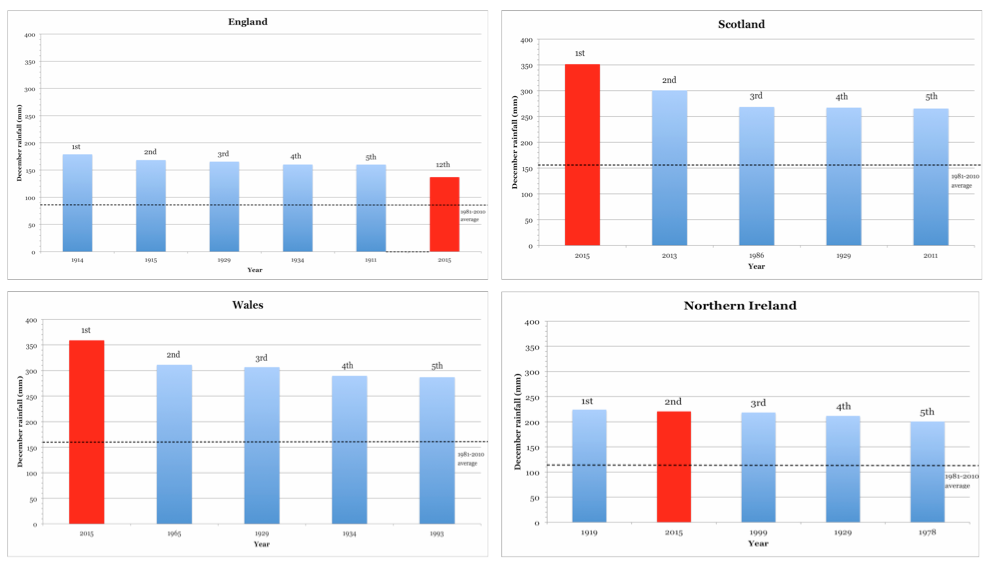
Top five ranking years on record for rainfall in England, Scotland, Wales and Northern Ireland. Plotted by Carbon Brief using Met Office data.
Though England as a whole didn’t receive record levels of rainfall, the contrast between the north and south is marked. You can see in the graphs below that while North west England saw the wettest December on record by quite some distance, southern England saw average levels.
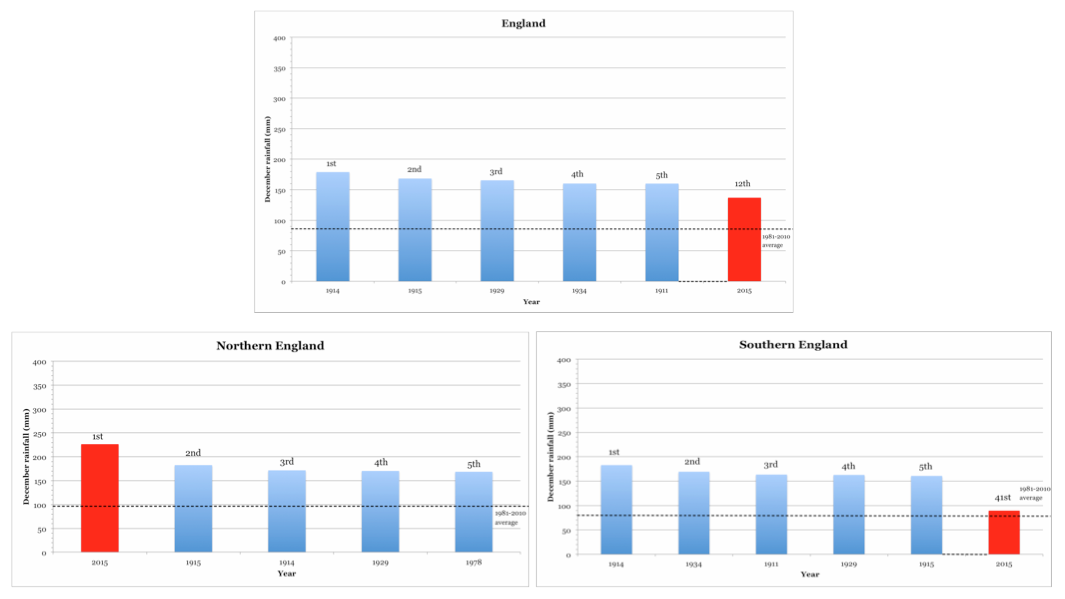
Top five ranking years on record for rainfall in England as a whole, and northern and southern England separately. Plotted by Carbon Brief using Met Office data.
Incidentally, the Met Office makes all of this monthly, seasonal and annual rainfall data freely available online – for different regions and the UK as a whole. Or you can quickly compare historical rainfall maps for any year between 1910-2015.
-

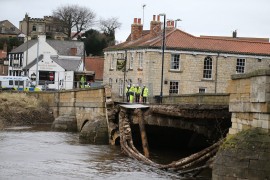
Members of the emergency service and police stand on the partially collapsed bridge in Tadcster, Yorkshire, northern England 30 December 2015 after heavy flooding caused the River Wharfe to break its banks. Residents have been evacuated from the village as Storm Frank hits many parts of the country. © EPA/NIGEL RODDIS
-
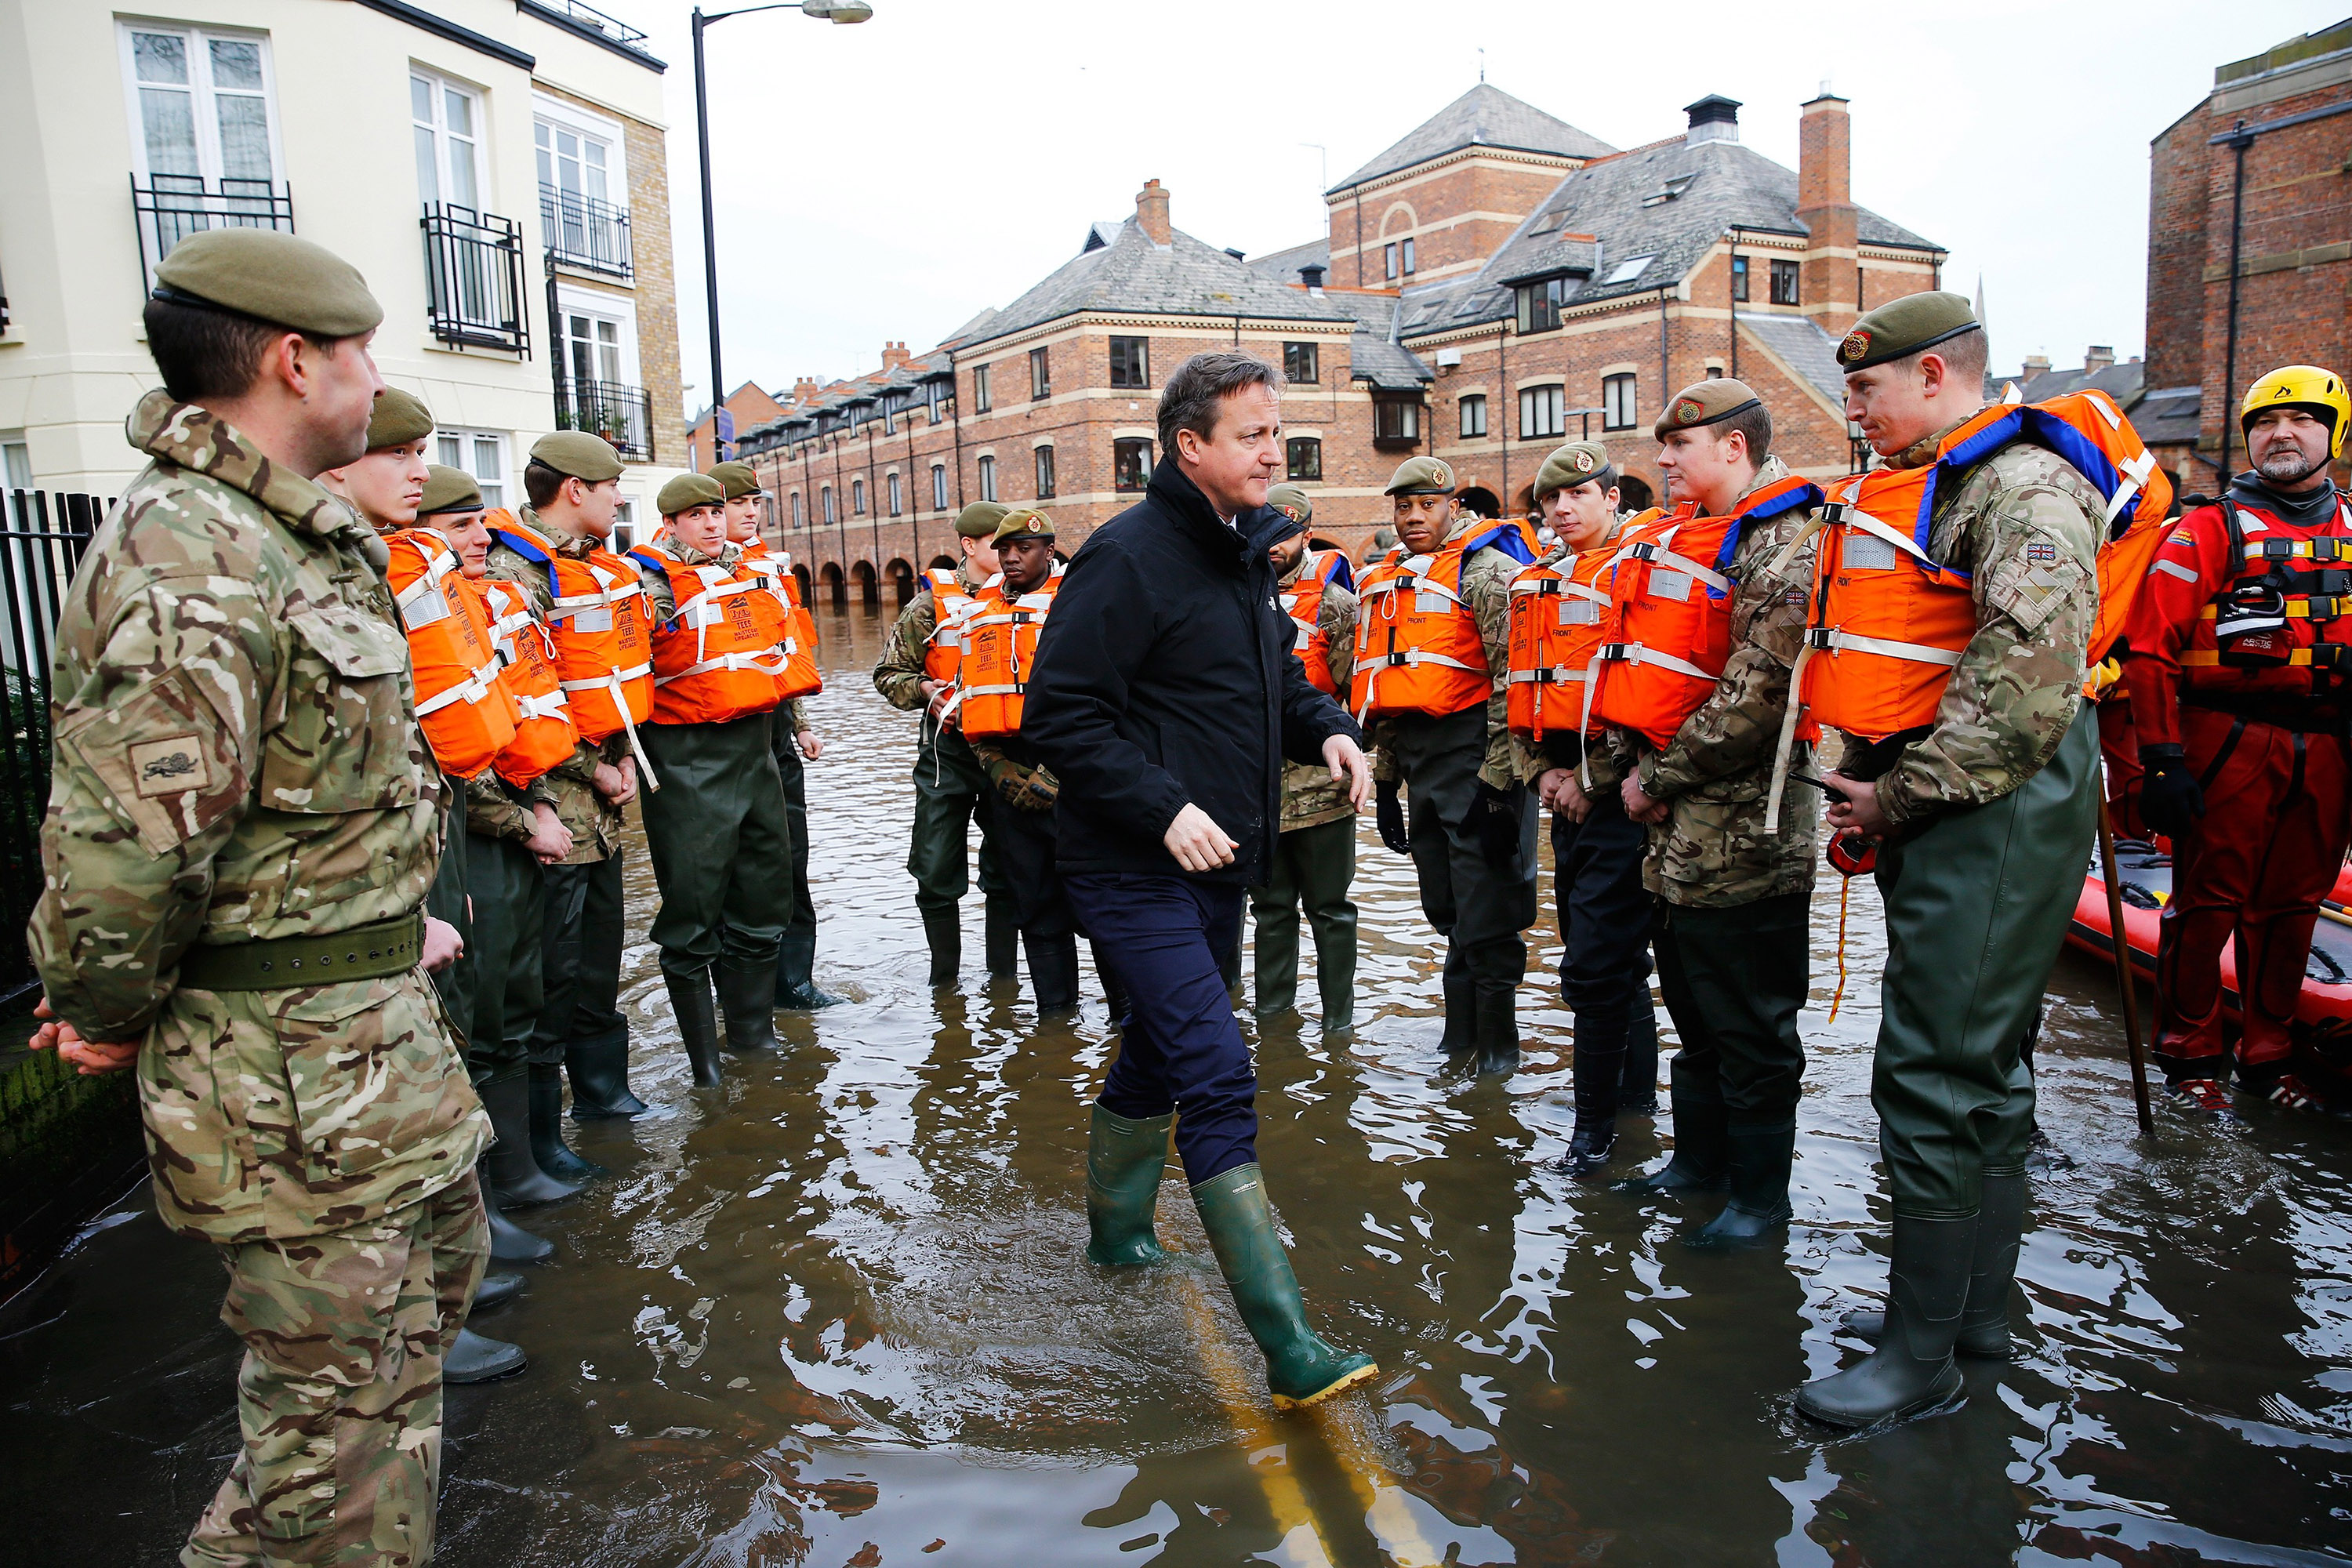
Britain's Prime Minister David Cameron greets soldiers working on flood relief in York city centre after the river Ouse burst its banks, in northern England, December 28, 2015. © DARREN STAPLES/Reuters/Corbis
-
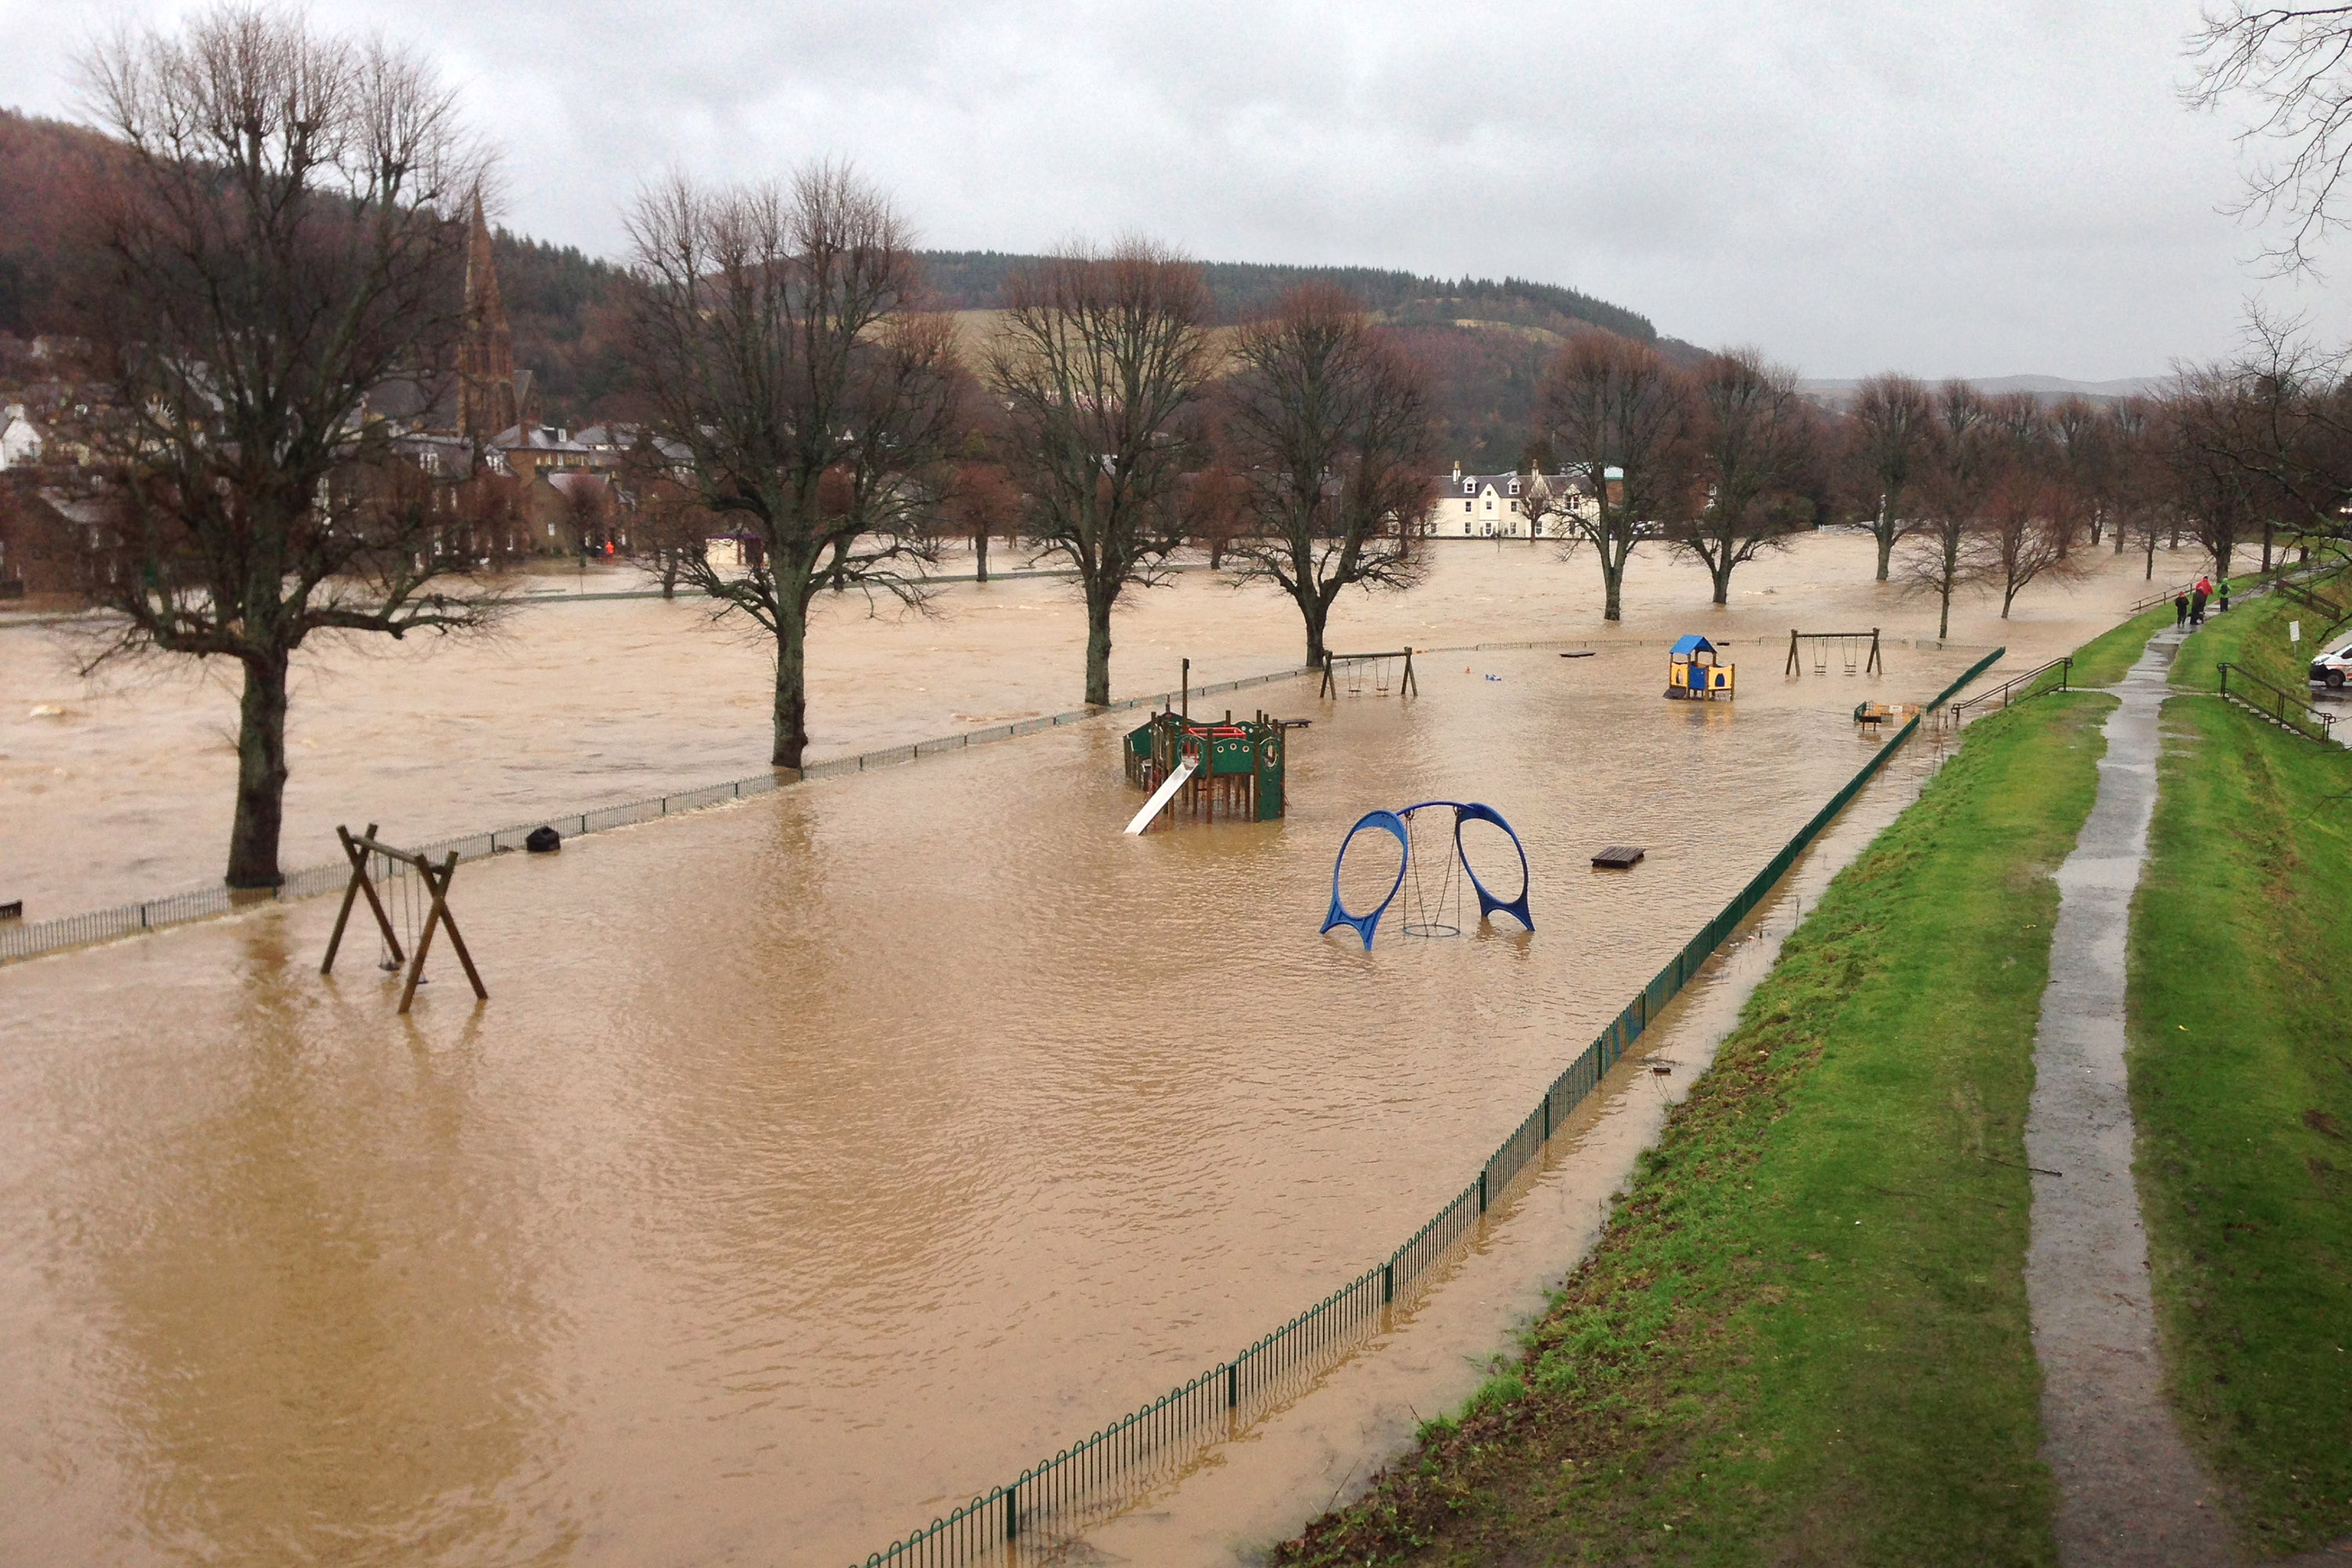
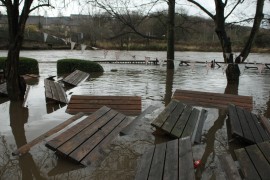
Flooding by the River Tweed in Peebles on the 30th of December. Credit: Robert McSweeney.
-

Leeds, United Kingdom. 26th December 2015. The Kirskstall Taps Public House as the beer garden is flooded as the The River Aire, at Kirkstall Leeds, breaks its banks as the Heavy Rain continues causing wide spread local flooding. -- As the heavy rain continue to rise the River Aire at Kirstall bursts its bank, causing wide spread damage to the Leeds Rhinos Rugby League Training complex and the Airedale Train Line. © touchlinepics Steve Gaunt/Demotix/Corbis
-
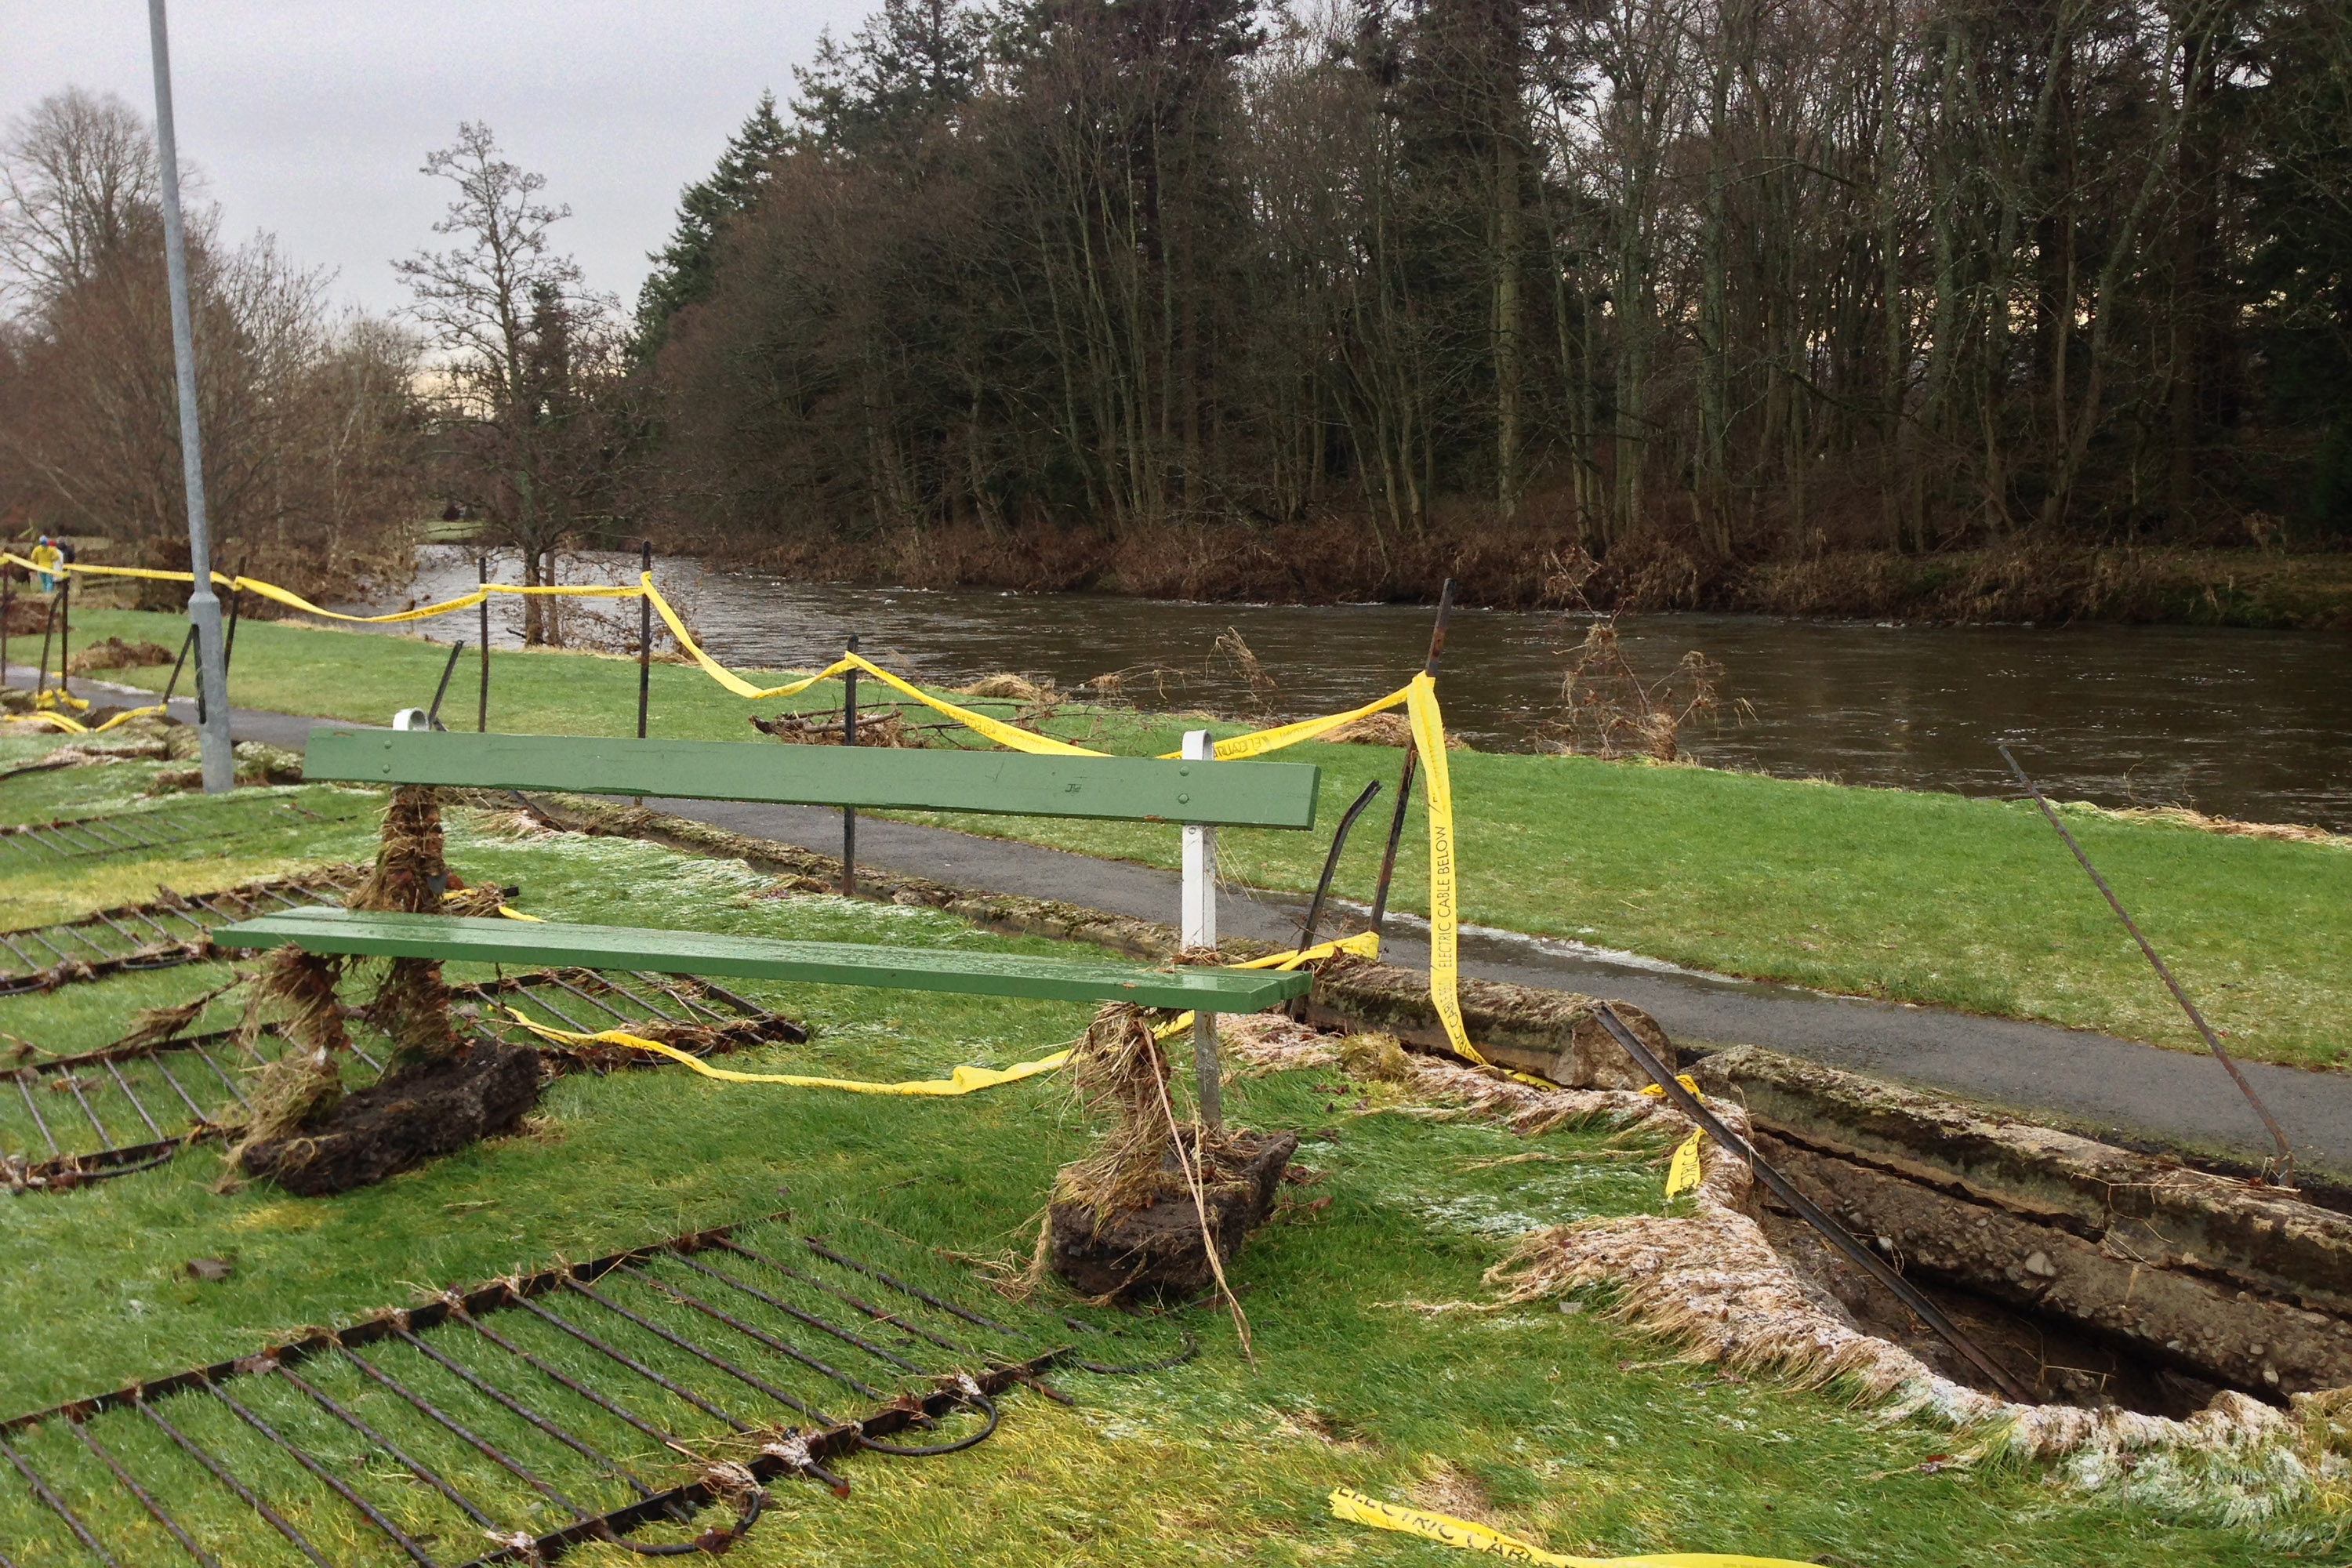
Flooding by the River Tweed in Peebles on the 30th of December. Credit: Robert McSweeney.
-

Flooding by the River Tweed in Peebles on the 30th of December. Credit: Robert McSweeney


Drivers
A string of storms in quick succession delivered the bulk of the rain – first Storm Desmond, then Eva, then Frank. But other factors influenced how much rain those storms dumped on the UK, say scientists.
It’s simple physics that warmer air holds more moisture. So, when conditions are right for it to rain, climate change means that it is likely to fall in heavier bursts. As Dame Julia Slingo, chief scientist at the Met Office, said in a recent blog post:
From basic physical understanding of weather systems it is entirely plausible that climate change has exacerbated what has been a period of very wet and stormy weather arising from natural variability.
This quote from Slingo featured in a number of media articles in past weeks, as newspapers grappled with why December’s weather was so unusual. In fact, a number of climate scientists were on hand to explain the role of climate change in this winter’s dramatic scenes.
Dr Paul Williams from Reading University is quoted in The Independent and Buzzfeed as saying:
Simple physics tells us that warmer air can hold more water vapour. The global warming that we have experienced so far has increased the atmosphere’s moisture storage capacity by about 7%. This is undisputed science and it clearly increases the potential for extreme rainfall and flooding.
Or as Penn State climate scientist Prof Mike Mann told The Washington Post:
While climate change didn’t ‘cause’ the storms themselves, it has increased the potential for heavy rainfall and flooding with these storms.
On the BBC’s Today Programme this morning (1:20:15), Prof Myles Allen from the University of Oxford echoed the point using the analogy of an athlete on steroids, saying:
Just as if an athlete starts popping pills, it doesn’t guarantee they’re going to win every race but it obviously changes their chances.
The physics is actually relatively simple, Allen continues.
As we warm up the atmosphere, the systems that move in from the Atlantic contain more moisture and so they dump more rain on the citizens of Cumbria. And it’s not that much more complicated than that.
Despite so many scientists seemingly being on hand to explain the UK’s extreme weather, the Daily Express, meanwhile, chose to forgo expert analysis in favour of comments by UK-based climate skeptic lobbyist and former sports science lecturer, Benny Peiser.
Despite attributing its claim that “although devastating, the floods have nothing to do with global warming but are part of a natural weather cycle” to “climatologists”, the Express piece neither quotes nor mentions any by name.
Record breakers
Of course, one month of record-breaking rainfall doesn’t signify a trend. That’s why scientists look at how the picture changes decade-by-decade.
A 2014 paper by the Met Office’s Mike Kendon looked at how much more frequently rainfall records are being broken now than they were at the beginning of the century. The paper finds the period since 2000 accounts for 45% of all wet-records since 1910.
Below is a figure from the paper, showing the “clustering” of wet records (blue) in the last 15 years or so compared to dry records (orange). (Note that the records have been weighted so that an annual record has more importance than a daily one, and a national one has more importance than a local one, for example.)
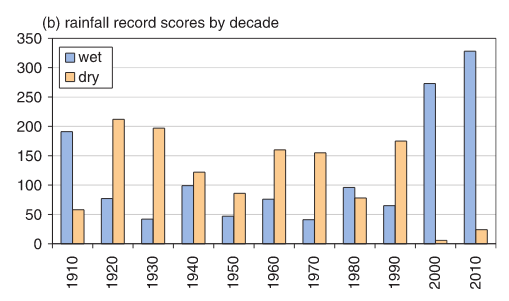
Number of wet records (blue) and dry records (orange) broken per decade, weighted by importance. Kendon et al., (2014)
Scientists can go a step further and look at how much climate change is increasing the odds of a particular extreme weather event. This is known as “single event attribution”.
The topic has received quite a lot of attention in recent weeks after a very rapid analysis of Storm Desmond by UK, US and Dutch scientists suggested climate change had made the heavy rainfall about 40% more likely.
The study was cited in the Independent, New Scientist, New York Times and Guardian, to name a few. Read the Carbon Brief coverage.
El Niño
There was another factor at play in 2015. The huge El Niño underway in the Pacific is also likely to have influenced December weather, peaking as it does in the northern hemisphere winter.
In a video on the Met office website, Dr Adam Scaife describes the possible consequences of the weather phenomenon for the UK. He says:
The big El Niño that’s currently going on in the Pacific is likely to increase the risk of a strong jet stream, heavy rainfall and stormy conditions for early winter.
There are other factors, too, but El Niño is one of the things we can point to, said Scaife.
On the defensive
Many scientists have been making the point in recent weeks that the likely impact of climate change on flood risk in the UK isn’t new science. The government has known about these projections for a long time, said Oxford economist Prof Simon Wren-Lewis in a blog post quoted by Buzzfeed’s Tom Chivers:
We have known since at least the Pitt Review of 2007 that climate change was going to greatly increase the incidence of record-breaking bursts of rainfall in the UK. Government ministers can carry on claiming they are unprecedented, but they are not unexpected.
Or as Prof Allen told The New York Times:
As scientists, it’s a little humbling that we’ve kind of been saying this for 20 years now, and it’s not until people notice daffodils coming out in December that they start to say, ‘Maybe they’re right.’
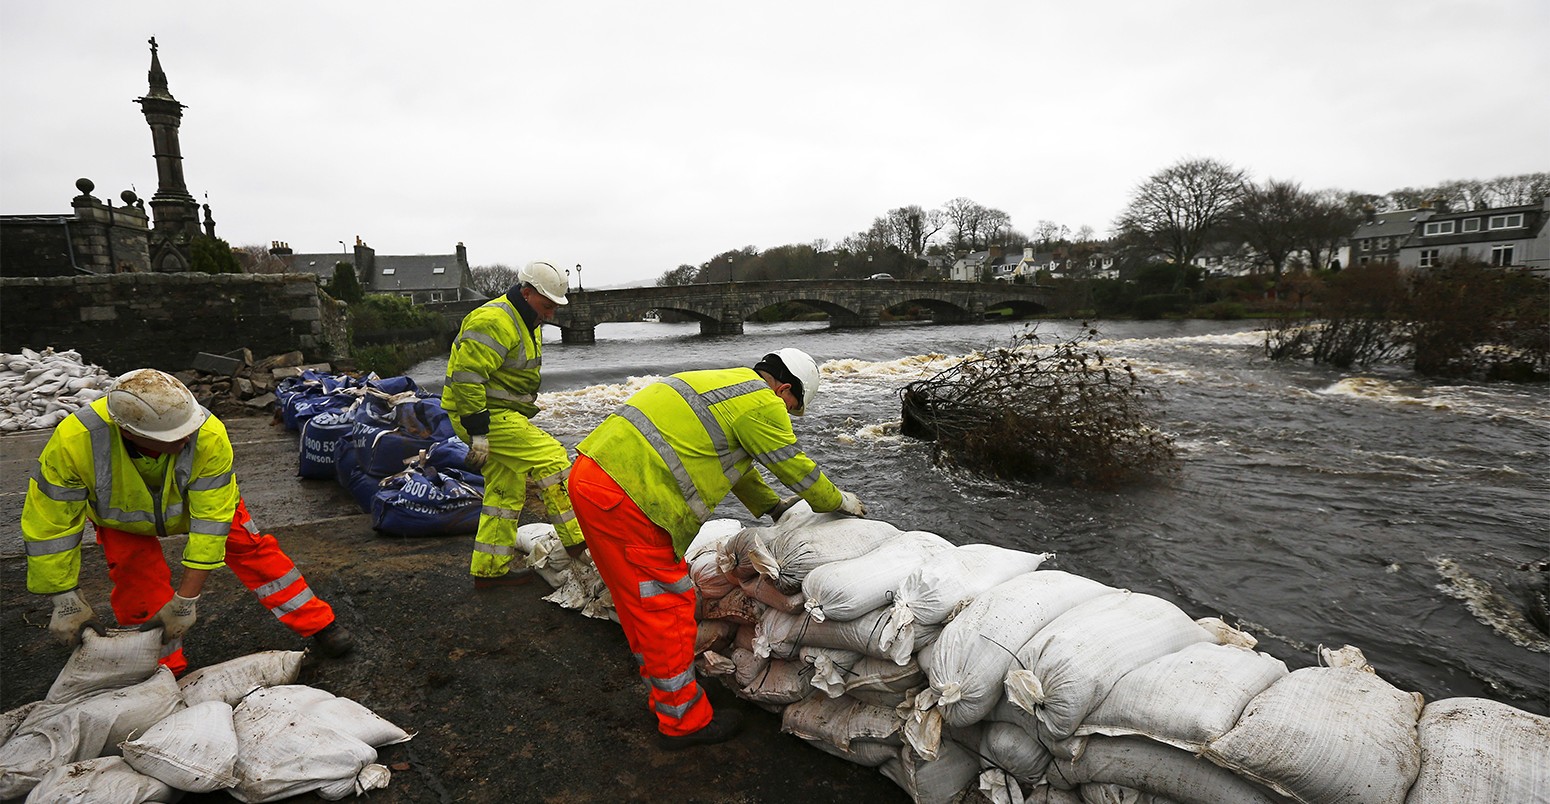
Main image: Council workers rebuild a wall with sandbags following flooding at Newton Stewart in Scotland, Britain December 31, 2015. © DARREN STAPLES/Reuters/Corbis.
-
Analysis: How December 2015 topped chart as UK's wettest month on record
-
Official figures released today confirm that December 2015 was the UK's wettest month on record, seeing more rain than any other month since 1910.