
Analysis: UK nuclear output falls to lowest level since 1982
Simon Evans
01.07.22The UK’s nuclear output has plunged to its lowest level since 1982, Carbon Brief analysis shows.
The 9% drop in 2021, due to retirements and outages at the UK’s ageing reactors, contributed to a record 17 terawatt hour (TWh) fall in low-carbon electricity last year, with wind generation also falling 15%.
The government aims to have a fully decarbonised power system by 2035 – but the latest figures show it is going in the wrong direction. The figures are based on Carbon Brief analysis of data from BM Reports and the Department of Business, Energy and Industrial Strategy (BEIS).
They show that the carbon intensity of electricity generation rose last year by nearly 10% to 199 grams of carbon dioxide (CO2) per kilowatt hour (gCO2/kWh), up from a record-low 183gCO2/kWh in 2020.
This is because electricity generation from fossil fuels was some 9% higher than a year earlier, of which nearly 90% came from higher gas output. Coal’s share remained below 2%, despite growing slightly compared with a year earlier, while gas increased its share from 34% to 37%.
Nevertheless – with demand barely recovering from coronavirus lockdowns in 2020 – low-carbon sources still generated more than half of UK electricity in 2021, including 19% from wind, 14% from nuclear, 12% from biomass and 4% from solar.
Plunging nuclear
Many recent headlines have focused on Germany’s deliberate strategy to end its use of nuclear power, with three of its remaining six reactors having switched off at the start of the year.
Few, though, have noted the significant declines in countries including France and the UK – albeit forced rather than due to policy choices – as ageing reactors come to the end of their lives.
Electricity generation from the UK’s nuclear power plants fell by another 9% in 2021 to just 46TWh, less than half the peak in 1998 and the lowest in nearly four decades.
This is shown in the figure below, which charts the expansion and subsequent decline of the UK’s nuclear output.
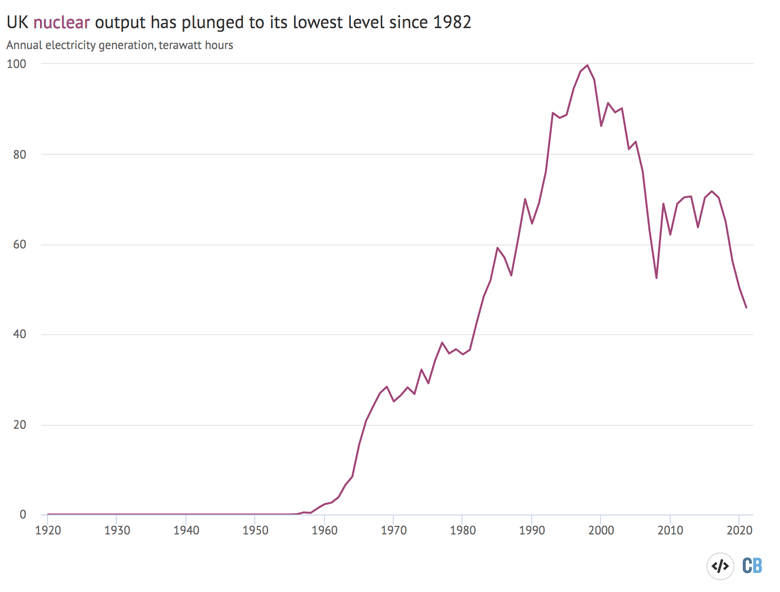
Electricity generation from nuclear power plants in the UK, terawatt hours (TWh), 1920-2021. Source: BEIS and Carbon Brief analysis. Chart by Joe Goodman for Carbon Brief using Highcharts.
Electricity generation from the current UK nuclear fleet is set to decline further as the reactors reach their scheduled retirement, with all except Sizewell B in Suffolk due to close by 2030.
Two new reactors at Hinkley Point C in Somerset are due to come online later this decade and the government hopes to secure a deal for an identical plant at Sizewell C during this parliament.
Together, these new nuclear plants would roughly replace current nuclear output.
(The government is also supporting the development of small nuclear reactors, the first of which it hopes to see coming online in the “early 2030s”.)
Low-carbon low
The UK’s windfarms also had a challenging year in 2021, with generation falling by an estimated 15% – despite rising capacity – as a result of the lowest average windspeeds in a decade.
Reduced sunshine hours and below-average rainfall caused 9% and 26% drops in solar and hydro generation, respectively, with the reported capacity of both sources barely changing.
In combination with the decline in nuclear output, this means the UK’s low-carbon electricity generation saw its largest ever one-year fall of 17TWh, shown in the chart below.
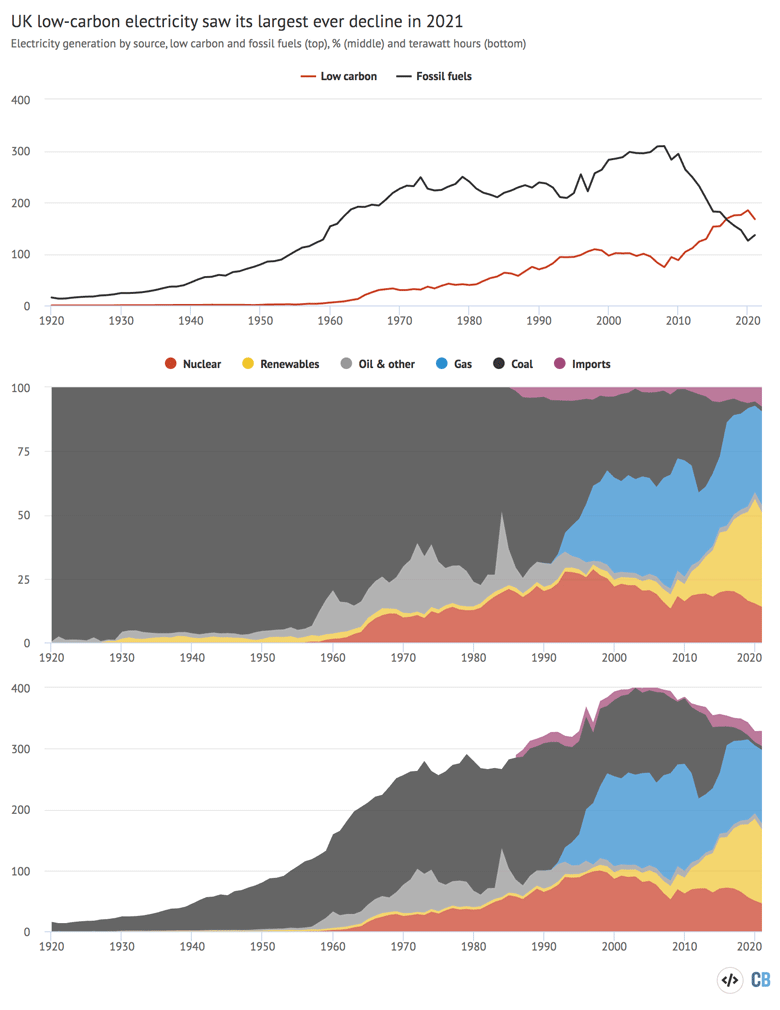
Top: Electricity generation from low-carbon sources and fossil fuels, TWh. Middle: Share of UK electricity by source, %, 1920-2021. Bottom: Generation by source, TWh, 1920-2021. Source: BEIS and Carbon Brief analysis. Chart by Joe Goodman for Carbon Brief using Highcharts.
Despite the record fall in 2021, low-carbon sources still generated more than half of UK electricity (51%), as the chart above shows, with fossil fuels making up 39% and imports another 8%.
In part, this was due to the fact that demand barely increased from the lockdown-induced lows seen in 2020 (bottom panel).
Another contributor was two new interconnector cables – the North Sea Link with Norway and IFA2 with France – which helped boost electricity imports, despite a prolonged outage for the existing IFA1 cross-channel cable.
The remaining 3% of the mix in 2021 was from pumped hydro storage (1%) and other sources (2%), including the UK’s growing fleet of battery storage sites, as well as waste incinerators.
Changing mix
The chart below shows a more granular picture of UK electricity generation since 2010, with renewables broken down into its constituent parts.
It shows that increased generation from gas (dark blue, up 9%) and imports (red, up 37%) compensated for reduced low-carbon supplies in 2021.

UK electricity generation by source, terawatt hours, 2010-2021. Source: BEIS and Carbon Brief analysis. Chart by Joe Goodman for Carbon Brief using Highcharts.
Notably, despite rising last year, gas generation remained some 8% below 2019 levels and well below previous highs, at nearly a third lower than output from the fuel in 2010.
Similarly, the 12% bump in coal generation (black) left the fuel well below its 2019 figure and still at historically low levels. There were 90 full days without coal generation in 2021, Carbon Brief analysis shows, down from 180 days in 2020, but still above 83 in 2019 and 21 in 2018.
Combined generation from coal and gas last year, at 127TWh, was some 55% below 2010 levels. Meanwhile, imports reached their highest level on record, at 25TWh and 8% of the mix overall.
The chart also shows the stark reduction in wind generation in 2021 (light blue) as above-average wind conditions in 2020 gave way to the lowest average wind speeds in a decade.
Biomass grew by 2% to account for 12% of UK electricity in 2021, nearly a third of the total from all renewables. Some two-thirds of the biomass output is from “plant biomass”, primarily wood pellets burnt at Lynemouth in Northumberland and the Drax plant in Yorkshire. The remainder was from an array of smaller sites based on landfill gas, sewage gas or anaerobic digestion.
The government’s advisory Climate Change Committee (CCC) says the UK should “move away” from large-scale biomass power plants, once existing subsidy contracts expire in 2027.
Using biomass to generate electricity is not zero-carbon and in some circumstances could lead to higher emissions than from fossil fuels. Moreover, there are more valuable uses for the world’s limited supply of biomass feedstock, the CCC says, including carbon sequestration and hard-to-abate sectors with few alternatives.
Fully decarbonised?
The UK government has set an ambition to “fully decarbonise” the electricity system by 2035 as part of its strategy to reach net-zero greenhouse gas emissions by 2050.
This means bringing the carbon intensity of the grid – the amount of CO2 emitted per unit of electricity generation – down, or at least very close to zero.
There had been rapid and steady progress towards this goal over the past decade, with eight years of successive falls in carbon intensity from 486gCO2/kWh in 2012 to just 183gCO2/kWh in 2020.
However, last year’s increase in fossil fuels to compensate for the fall in low-carbon output means the carbon intensity of UK electricity increased by 9% to 199gCO2/kWh, Carbon Brief estimates.
In order to fully decarbonise the grid by 2035, low-carbon sources will need to replace the roughly 40% of demand that is currently met by fossil fuels. At the same time, demand is expected to increase by around 15% by 2035 as a rising share of heat and transport is electrified.
This challenge is illustrated in the illustrative figure below, which shows the current makeup of UK electricity generation on the left and, in round numbers, the situation in 2035 on the right.
The figure shows that there is a shortfall between current plans and what would be needed to fully decarbonise the grid, even with relatively favourable assumptions. Any shortfall is likely to be met by fossil fuels, breaching the government’s 2035 ambition.
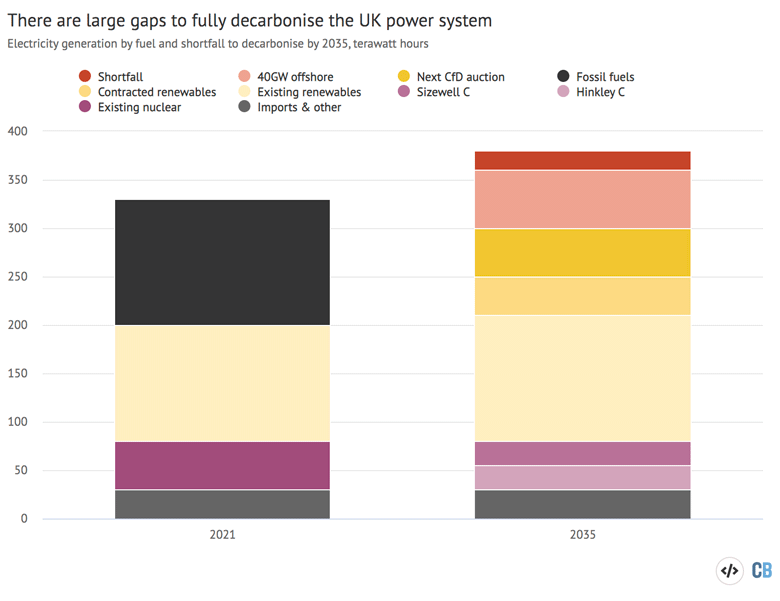
The UK electricity mix in 2021 (left) and 2035 (right) broken down by source, in round numbers of terawatt hours. Source: Carbon Brief analysis. Chart by Joe Goodman for Carbon Brief using Highcharts.
Fossil fuels, primarily gas, supplied around 40% of the UK’s electricity last year – some 130TWh (dark grey). To meet the government ambition, this would all need replacing.
For illustrative purposes, Carbon Brief has assumed that imports and other sources continue to supply around 30TWh of electricity each year by 2035.
The 50TWh of low-carbon electricity from existing nuclear power plants (purple wedge, left) is set to disappear as they are all scheduled to close by 2035. This output could be replaced by the under-construction Hinkley C and proposed Sizewell C plants (lighter purples, 25TWh each).
Much of the UK’s existing renewable capacity – with an expected output of 130TWh in an average year, but closer to 120TWh in 2021 – will still be operating by 2035 (light yellow).
A large proportion of biomass subsidies are due to expire in 2027 and the oldest wind and solar farms will start to reach the end of their life, but, for illustrative purposes, Carbon Brief has assumed that all existing renewable capacity will remain operational.
Existing contracts for difference (CfDs) mean an additional 9 gigawattts (GW) of offshore wind is due to come online in the next few years and will generate roughly 40TWh per year (mid yellow).
The next CfD auction, which is currently open and will announce results this summer, is due to secure another 12GW of capacity, including up to 5GW of onshore renewables and 6-8GW of offshore wind. This would be enough to generate roughly 50TWh (dark yellow).
The prime minister Boris Johnson has set a target of 40GW of offshore wind by 2030, meaning an additional 12-14GW on top of those already contracted or expected to win CfDs in the next auction. Reaching this target would mean roughly another 60TWh of low-carbon generation (pale red).
Assuming all of the above and given demand in 2035, as expected by the government, there would still be a shortfall of roughly 20TWh to fully decarbonise the grid (red).
If some of the UK’s existing renewable capacity were to close, if imports were to fall or if plans and targets for new nuclear and offshore wind were not met then there would be a larger shortfall to fully decarbonising the grid in 2035, with the risk that any gap would be filled by fossil fuels.
On the other hand, if utility firm EDF wins approval to extend the life of the 1.2GW Sizewell B nuclear plant beyond 2035, as it hopes to do, then this would help close the shortfall in low-carbon output.
Methodology
The figures in the article are from Carbon Brief analysis of data from BEIS Energy Trends chapter 5 and chapter 6, as well as from BM Reports. The figures from BM Reports are for electricity supplied to the grid in Great Britain only and are adjusted to include Northern Ireland.
In Carbon Brief’s analysis, the BM Reports numbers are also adjusted to account for electricity used by power plants on site and for generation by plants not connected to the high-voltage national grid. This includes many onshore windfarms, as well as industrial gas combined heat and power plants and those burning landfill gas, waste or sewage gas.
The analysis of carbon intensity is based on the methodology published by National Grid ESO.
BEIS historical electricity data, including years before 2009, is adjusted to reflect on-site generation and combined with data on imports from a separate BEIS dataset.
The Times, Observer and Daily Express reported preliminary results from this same analysis.
-
Analysis: UK nuclear output falls to lowest level since 1982
-
Analysis: UK low-carbon electricity sees largest ever fall in 2021