
Analysis: What are the causes of recent record-high global temperatures?
Zeke Hausfather
12.10.25Zeke Hausfather
10.12.2025 | 3:00pmThe past three years have been exceptionally warm globally.
In 2023, global temperatures reached a new high, after they significantly exceeded expectations.
This record was surpassed in 2024 – the first year where average global temperatures were 1.5C above pre-industrial levels.
Now, 2025 is on track to be the second- or third-warmest year on record.
What has caused this apparent acceleration in warming has been subject to a lot of attention in both the media and the scientific community.
Dozens of papers have been published investigating the different factors that could have contributed to these record temperatures.
In 2024, the World Meteorological Organization (WMO) discussed potential drivers for the warmth in a special section of its “state of the global climate” report, while the American Geophysical Union ran a session on the topic at its annual meeting.
In this article, Carbon Brief explores four different factors that have been proposed for the exceptional warmth seen in recent years. These are:
- A strong El Niño event that developed in the latter part of 2023.
- Rapid declines in sulphur dioxide emissions – particularly from international shipping and China.
- An unusual volcanic eruption in Tonga in 2022.
- A stronger-than-expected solar cycle.
Carbon Brief’s analysis finds that a combination of these factors explains most of the unusual warmth observed in 2024 and half of the difference between observed and expected warming in 2023.
However, natural fluctuations in the Earth’s climate may have also played a role in the exceptional temperatures, alongside signs of declining cloud cover that may have implications for the sensitivity of the climate to human-caused emissions.
An unusually warm three years
Between 1970 and 2014, average surface temperatures rose at a fairly steady rate of around 0.18C per decade.
Set against this long-term trend, temperature increases during the period from 2015 to 2022 were on the upper end of what would be expected.
The increases seen in 2023, 2024 and 2025 were well outside of that range.
The high temperatures of the past three years reflect a broader acceleration in the rate of warming over the past decade.
However, the past three years were unusually warm, even when compared to other years in the 2010s and 2020s.
Record-breaking warmth in 2023 meant that it beat the prior warmest year of 2016 by 0.17C – the largest magnitude of a new record in the past 140 years.
The year 2024 then swiftly broke 2023’s record, becoming the first year where average global temperatures exceeded 1.5C above pre-industrial levels.
The 10 months of data available for 2025 indicates that the year is likely to be slightly cooler than 2023 – though it is possible it may tie or be slightly warmer.
The figure below shows global surface temperatures between 1970 and 2025. (The figures for 2025 include uncertainty based on the remaining three months of the year.)
It includes a smoothed average based on temperature data for 1970-2022 that takes into account some acceleration of warming – and then extrapolates that smoothed average forward to 2023-25 to determine what the expected temperature for those years would have been. (This follows the approach used in the WMO’s “state of the global climate 2024” report.)
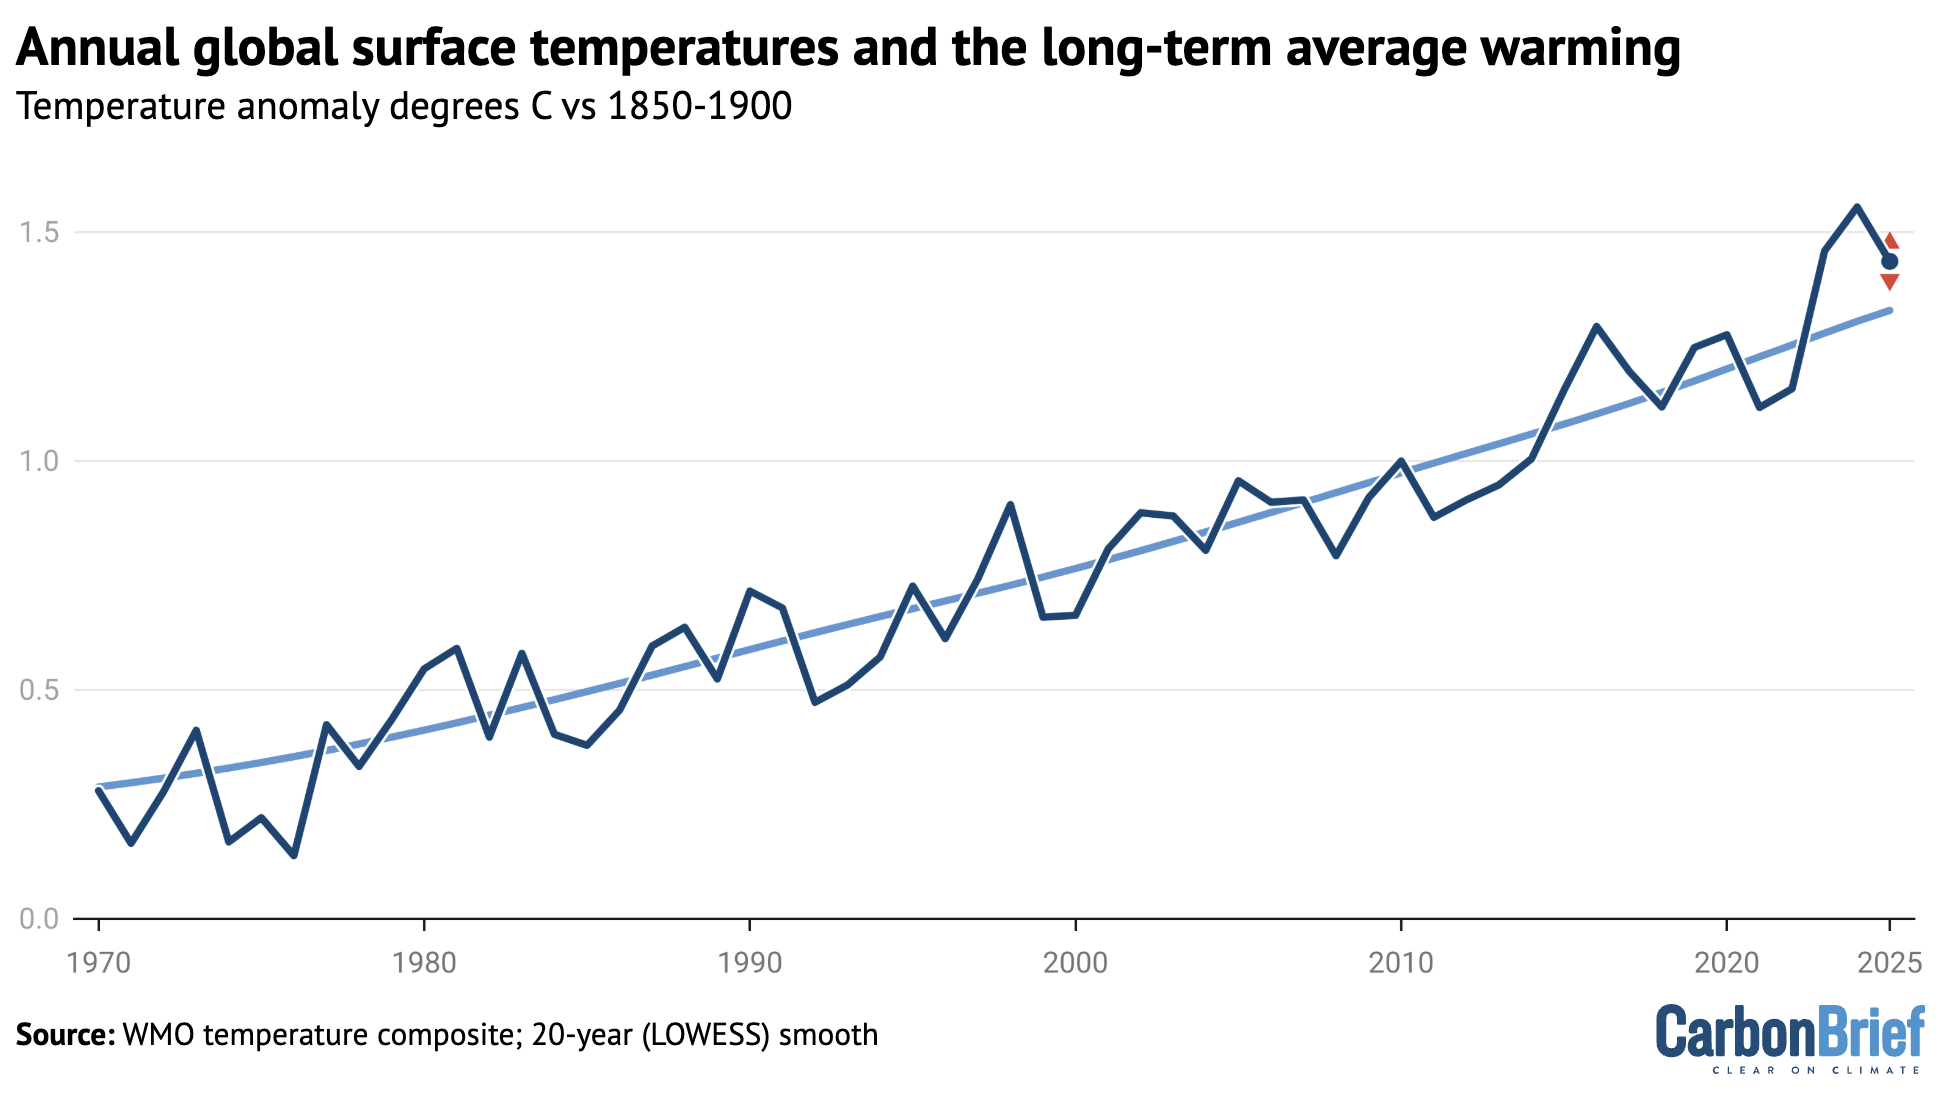
This approach calculates how much warmer the past three years were than would be expected given the long-term trend in temperatures.
It shows that 2023 was around 0.18C warmer than expected, 2024 was a massive 0.25C warmer and 2025 is likely to be 0.11C warmer.
Researchers have identified a number of potential drivers of unexpected warmth over 2023-25. Here, Carbon Brief looks at the evidence for each one.
A weirdly behaving El Niño event
El Niño is a climate pattern of unusually warm sea surface temperatures (SSTs) in the tropical Pacific that naturally occurs every two to seven years. Strong El Niño years generally have warmer global temperatures, with the largest effect generally occurring in the months after El Niño conditions peak (when SSTs reach their highest levels in the tropical Pacific).
A relatively strong El Niño event developed in the latter half of 2023, peaking around November before fading in the spring of 2024.
This event was the fourth-strongest El Niño ever recorded, as measured according to SSTs in the Niño 3.4 region in the central tropical Pacific. However, it was notably weaker than the El Niño events in both 1998 and 2016.
This can be seen in the chart below, which shows the strength of El Niño events (red shading) since the 1980s. (The blue shading indicates La Niña events – the opposite part of the cycle to El Niño, which results in cooler SSTs in the tropical Pacific.)
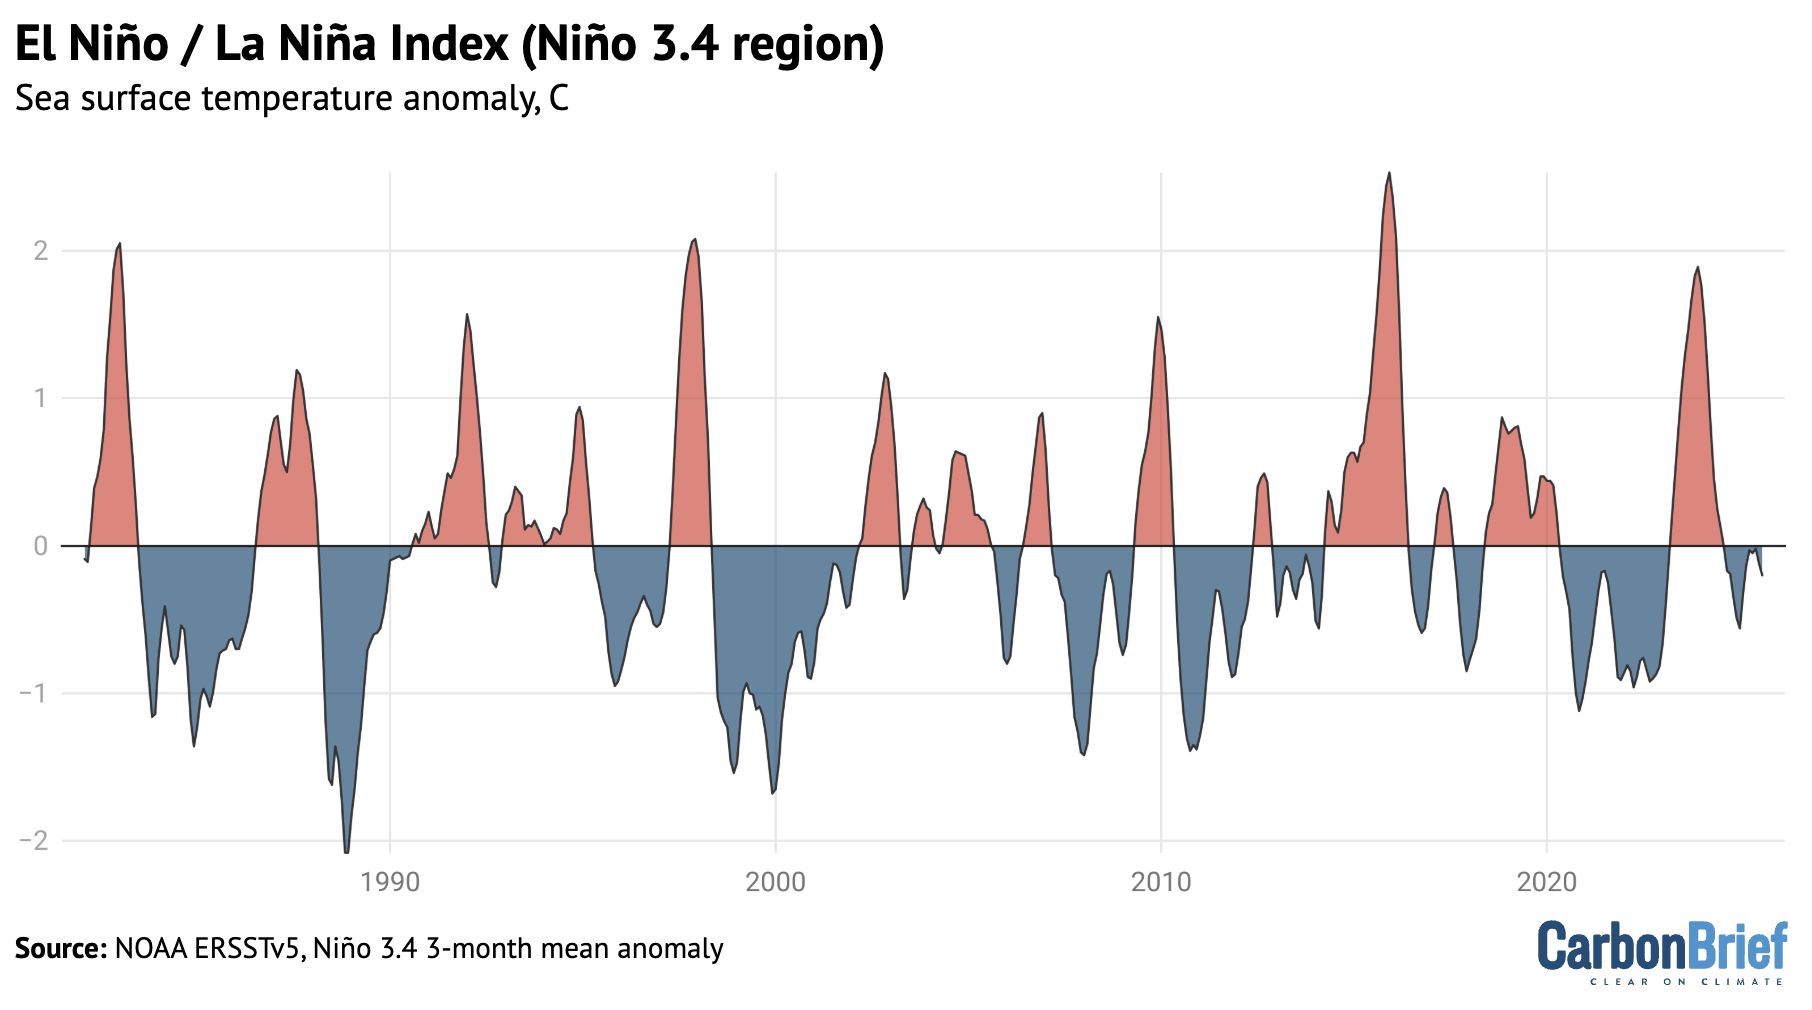
(It is worth noting that measuring the strength of El Niño events is not entirely straightforward. Other tools used by scientists to monitor changes to El Niño – such as the US National Oceanic and Atmospheric Administration’s (NOAA’s) multivariate ENSO index – show the 2023-24 event was much weaker than indicated in the Niño 3.4 dataset.)
Global surface air temperatures tend to be elevated by around 0.1-0.2C in the six months after the peak of a strong El Niño event – defined here as when SSTs in the Niño 3.4 region reach 1.5C above normal.
The figure below shows the range of global temperature change for the 12 months before and 22 months after the peak of all 10 strong El Niño events since 1950. The light line represents the average of past strong El Niño events, the dark blue line the temperature change observed during the 2023-24 event and the shaded blue area the 5-95th percentile range.
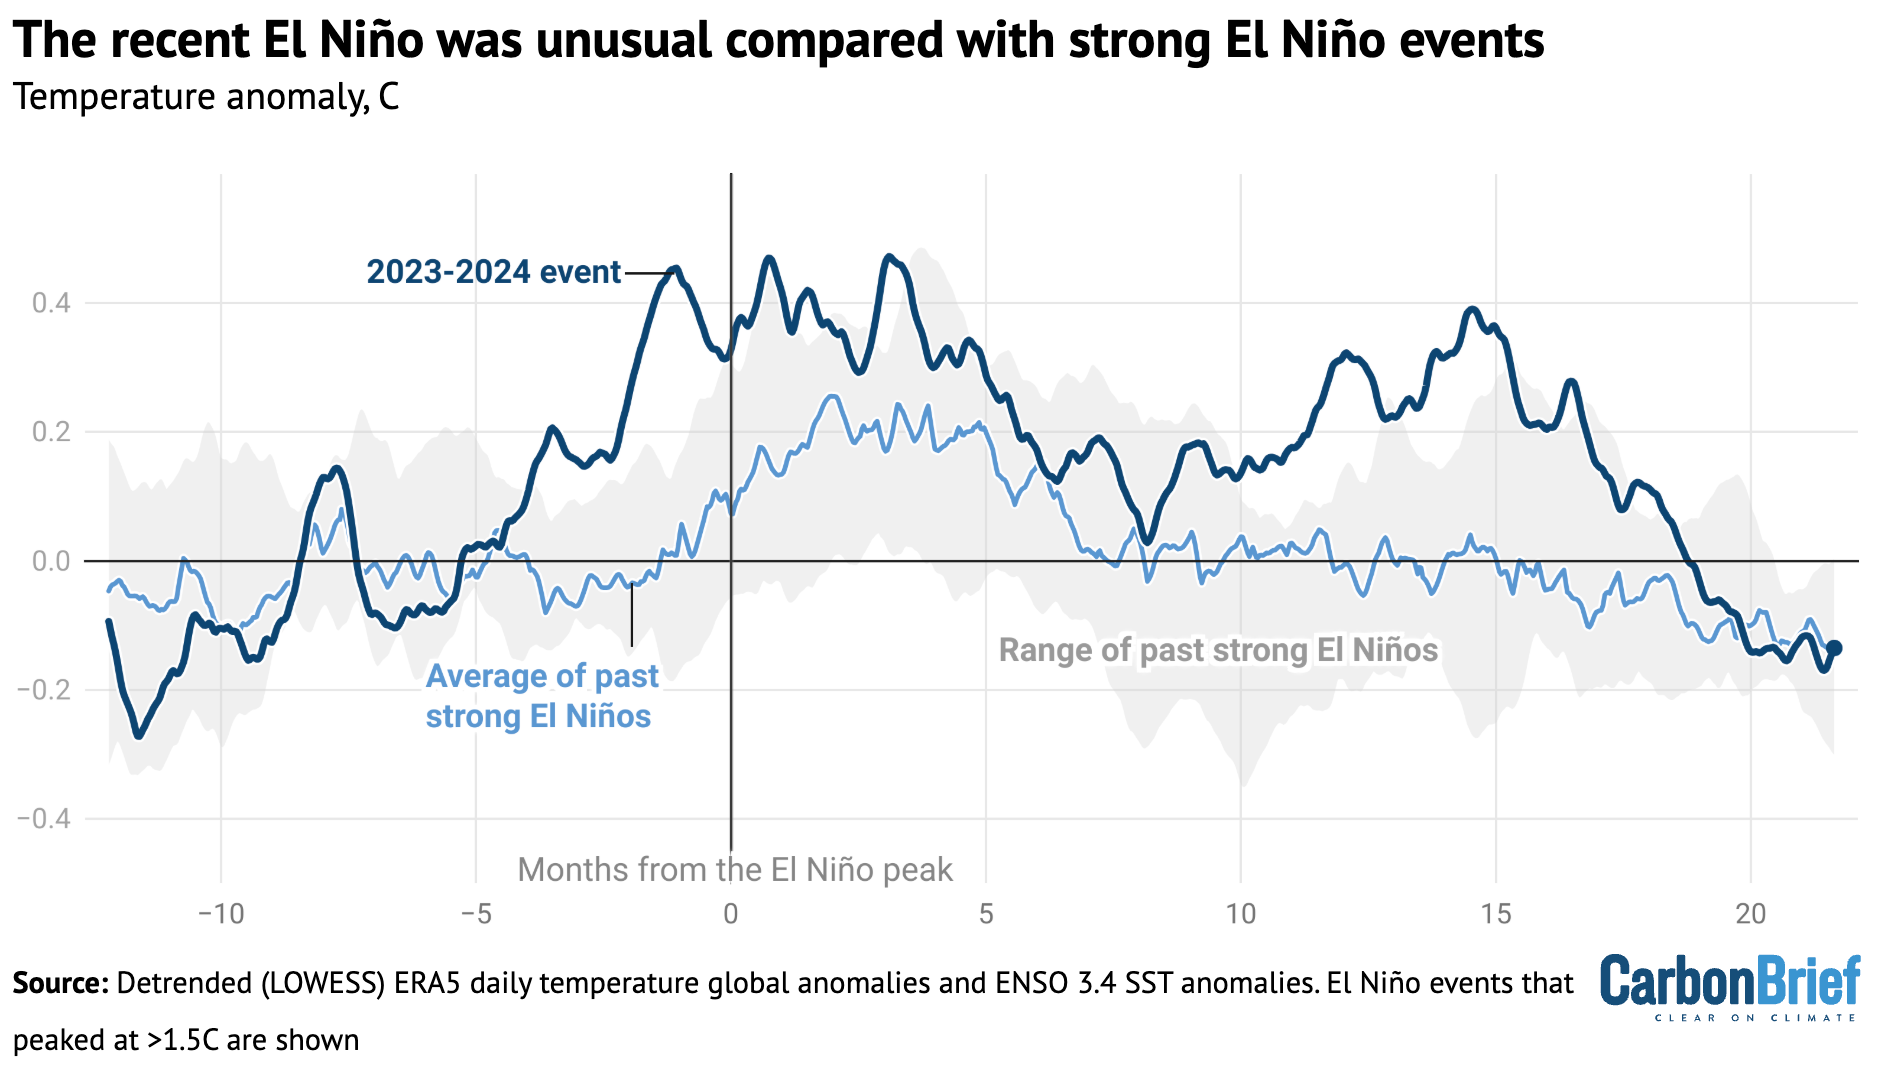
The figure shows the 2023-24 El Niño was quite unusual compared to other strong El Niño events since 1970. Global temperatures rose to around 0.4C above expected levels – which is on the high side of previous El Niños.
The heat also came early, with high temperatures showing up around four months before the El Niño event peaked. This early heat is unlike any other El Niño event in modern history and is one of the reasons why 2023’s global temperatures were so unexpectedly warm.
Global temperatures remained elevated for a full 18 months after the El Niño peaked, well after conditions in the tropical Pacific shifted into neutral conditions – and even after mild La Niña conditions developed at the end of 2024 and into early 2025.
This figure does not explain how much of this unusual heat was actually caused by El Niño, compared to other factors, but it does suggest that El Niño behaviour alone does not fully explain unusually high temperatures in recent years.
Based on the historical relationship between El Niño and global temperatures, Carbon Brief estimates that El Niño contributed a modest 0.013C to 2023 temperatures and a more substantial 0.128C to 2024 temperatures, albeit with large uncertainties. (See “methodology” section at the end for details.)
However, it is possible that this 2023 estimate is too low. There are some suggestions in the literature that 2023-24 El Niño’s early warmth may have been caused by the rapid transition out of a particularly extended La Niña event. There are indications that temperatures have spiked in similar situations further back in the historical temperature record.
Falling sulphur dioxide emissions
Sulphur dioxide (SO2) is an aerosol that is emitted into the lower atmosphere by the burning of coal and oil. It has a powerful climate cooling effect – Carbon Brief analysis shows that global emissions of SO2 have masked about one-third of historical warming.
Global SO2 emissions have declined around 40% over the past 18 years, as countries have increasingly prioritised reducing air pollution, including through the installation of scrubbers at coal plants.
These declines have been particularly concentrated in China, which has seen a 70% decline in SO2 emissions since 2007. In addition, a rule introduced for international shipping in 2020 by the International Maritime Organization (IMO) has resulted in an 80% decline in the sulphur content of shipping fuel used around the world.
The decline of SO2 emissions is shown in the figure below.

Shipping in particular has been suggested as a potential culprit for recent temperatures, given that ships emit SO2 over oceans where the air tends to be cleaner and so emissions have a bigger effect.
Seven of the eight studies that have explored the temperature impact of the IMO regulations have suggested a relatively modest effect, in the range of 0.03-0.08C. However, one study – led by former NASA scientist Dr James Hansen – calculated a much stronger effect of 0.2C that would explain virtually all the unusual warmth of recent years.
The figure below shows Carbon Brief’s estimate of the global average surface temperature changes caused by the low-sulphur shipping fuel rules, using the estimates produced by all eight studies. The central estimate (dark blue line) is relatively low, at around 0.05C, but the uncertainty range (light blue shading) across the studies remains large.
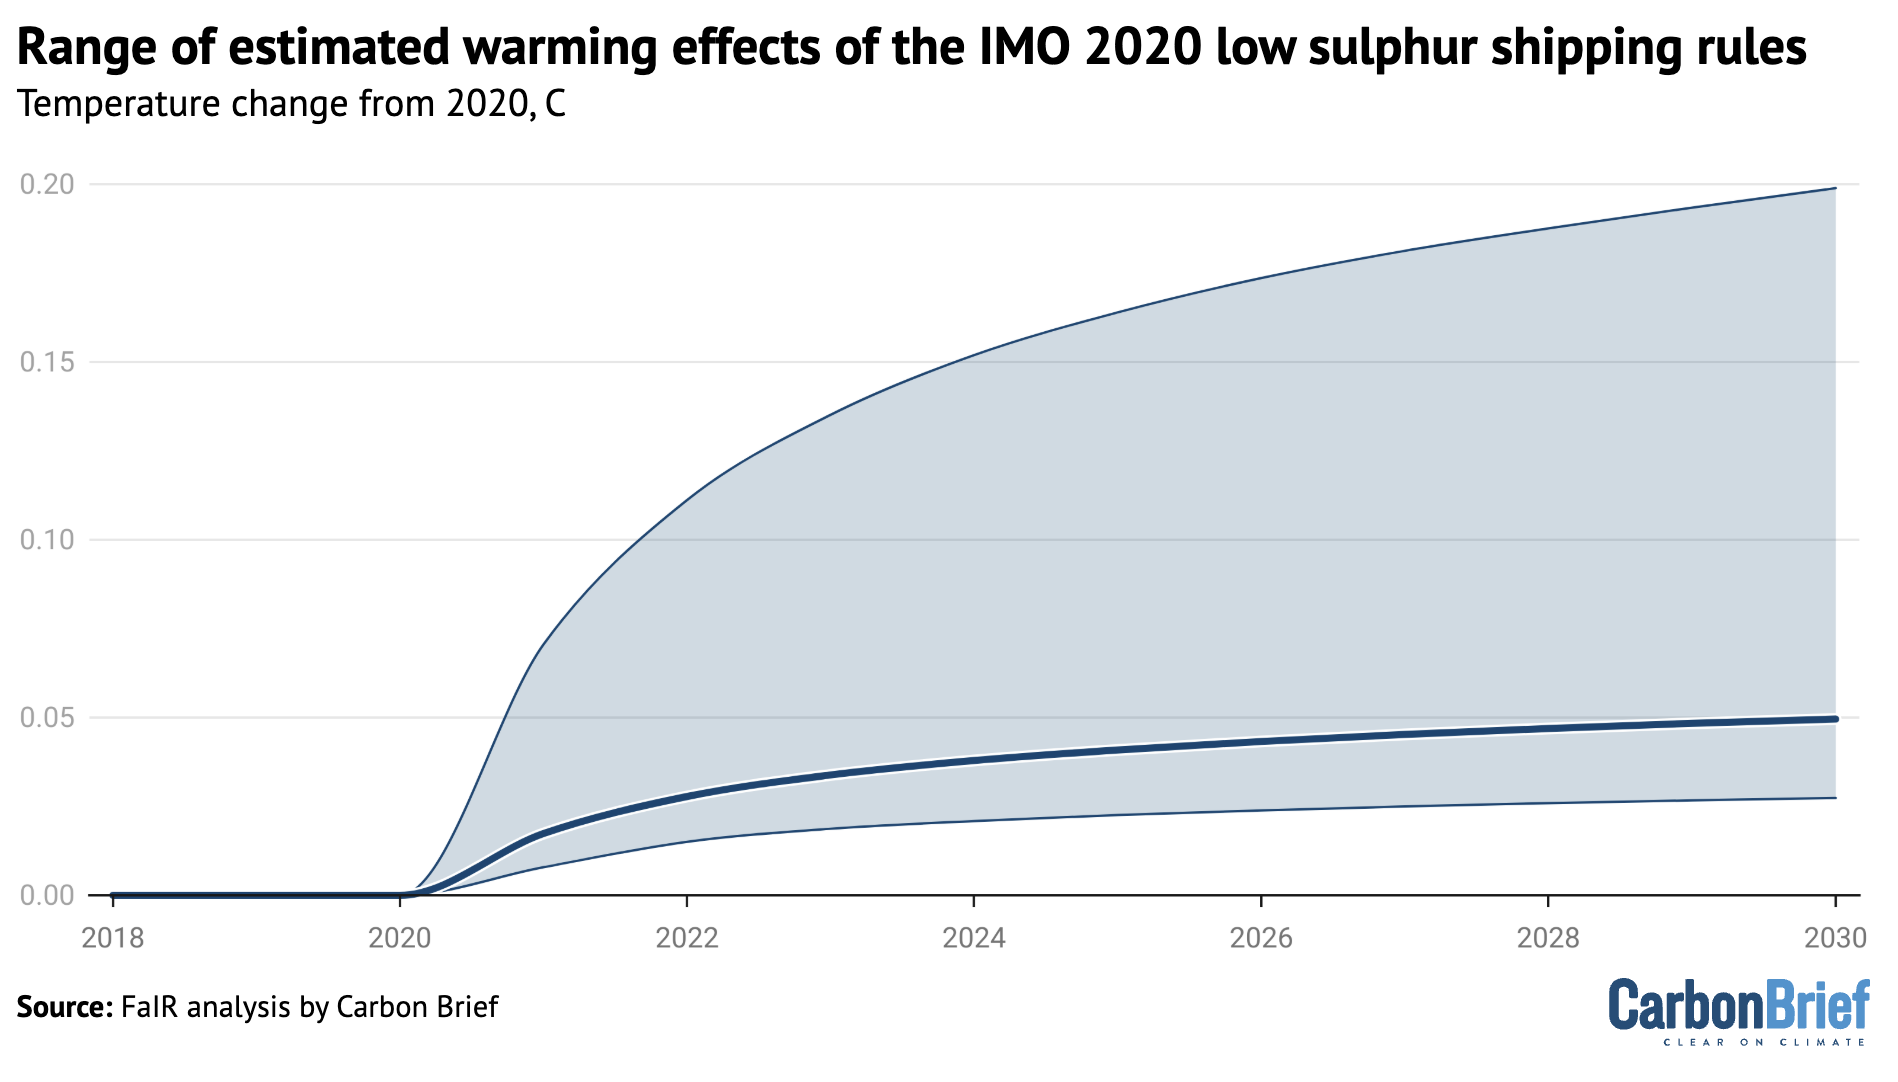
Overall, Carbon Brief’s analysis finds that around 0.04C of warming over 2020-23 and 0.05C of warming over 2020-24 can be attributed to SO2 declines from shipping and other sources.
However, this approach might slightly overstate the effects of SO2 on the exceptional temperatures of the past three years, as shipping and other SO2 declines would have had some effect on 2021 and 2022 as well.
It is also worth noting that the total effects of SO2 declines on global temperatures have been considerably larger and are estimated to be responsible for around one-quarter of all warming since 2007.
However, these SO2 decreases occurred over a long period of time and do not clearly explain the recent spike in temperatures.
An unusual volcanic eruption in Tonga
In early 2022, the Hunga Tonga-Hunga Ha’apai underwater volcano erupted spectacularly, sending a plume 55km into the atmosphere. This was by far the most explosive volcanic eruption since Mount Pinatubo erupted in 1991.
This was a highly unusual volcanic eruption, which vaporised vast amounts of sea water and lofted it high into the atmosphere. Overall, around 146m metric tonnes of water vapour ended up in the stratosphere, which is the layer of the atmosphere above the troposphere.
Water vapour is a powerful greenhouse gas. While it is short-lived in the lower atmosphere, it can stick around for years in the stratosphere, where it has a significant warming effect on the climate.
The figure below shows the concentration of water vapour in the stratosphere between 2005 and mid-2025. It shows how the 2022 eruption increased atmospheric concentrations of the greenhouse gas by around 15%. More than half the added water vapour has subsequently fallen out of the upper atmosphere.
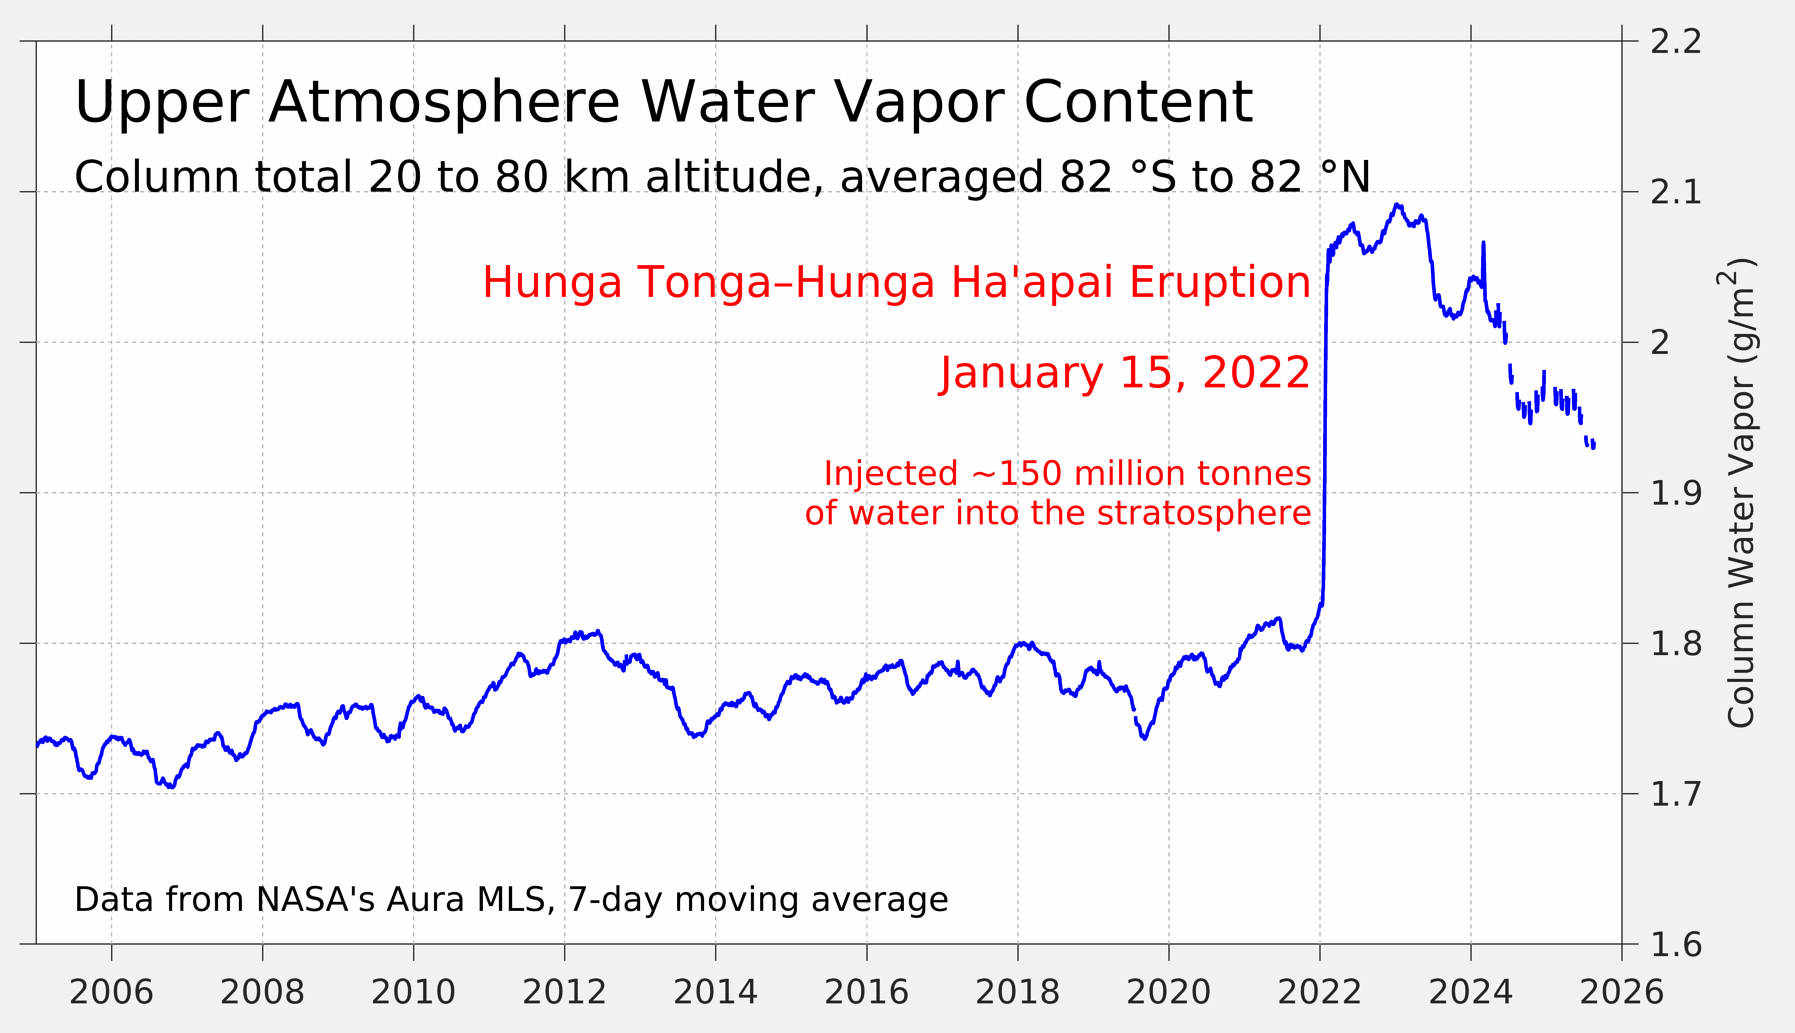
Most early studies of the Hunga Tonga-Hunga Ha’apai volcano focused specifically on the effects of stratospheric water vapour. These tended to show strong warming in the lower stratosphere and cooling in the middle-to-upper stratosphere, but only a slight warming effect on global surface temperatures of around 0.05C.
Hunga Tonga-Hunga Ha’apai had much lower sulphur emissions than prior explosive eruptions, such as Pinatubo and El Chichon. However it put 0.5–1.5m tonnes of sulphur into the stratosphere – the biggest increase in “aerosol optical depth” (a measure of how much sunlight is blocked by aerosols) from an eruption since Pinatubo.
Studies that included both sulphur and water vapour effects tend to find that the net effect of the eruption on surface temperatures was slight global cooling, concentrated in the southern hemisphere.
By using the estimates published in a 2024 study published in Geophysical Research Letters, which used the FaIR climate emulator model, Carbon Brief estimates that the Hunga Tonga-Hunga Ha’apai eruption cooled global surface temperatures by -0.01C in 2023 and -0.02C in 2024.
This suggests that the eruption was likely only a minor contributor to recent global surface temperatures.
A stronger-than-expected solar cycle
The source of almost all energy on Earth is the sun. Over hundreds of millions of years, variations in solar output have a big impact on the global climate.
Thankfully, over shorter periods of time the sun is remarkably stable, helping keep the Earth’s climate habitable for life. (Big changes – such as ice ages – have more to do with variations in the Earth’s orbit than changes in solar output.)
However, slight changes in solar output do occur – and when they do, they can influence climate change over shorter periods of time. The most important of these is the roughly 11-year solar cycle, which is linked with the sun’s magnetic field and results in changes in the number of sunspots and amount of solar energy reaching Earth.
The figure below shows a best-estimate of changes in total solar irradiance since 1980, based on satellite observations. Total solar irradiance is a measure of the overall amount of solar energy that reaches the top of the Earth’s atmosphere and is measured in watts per metre squared.
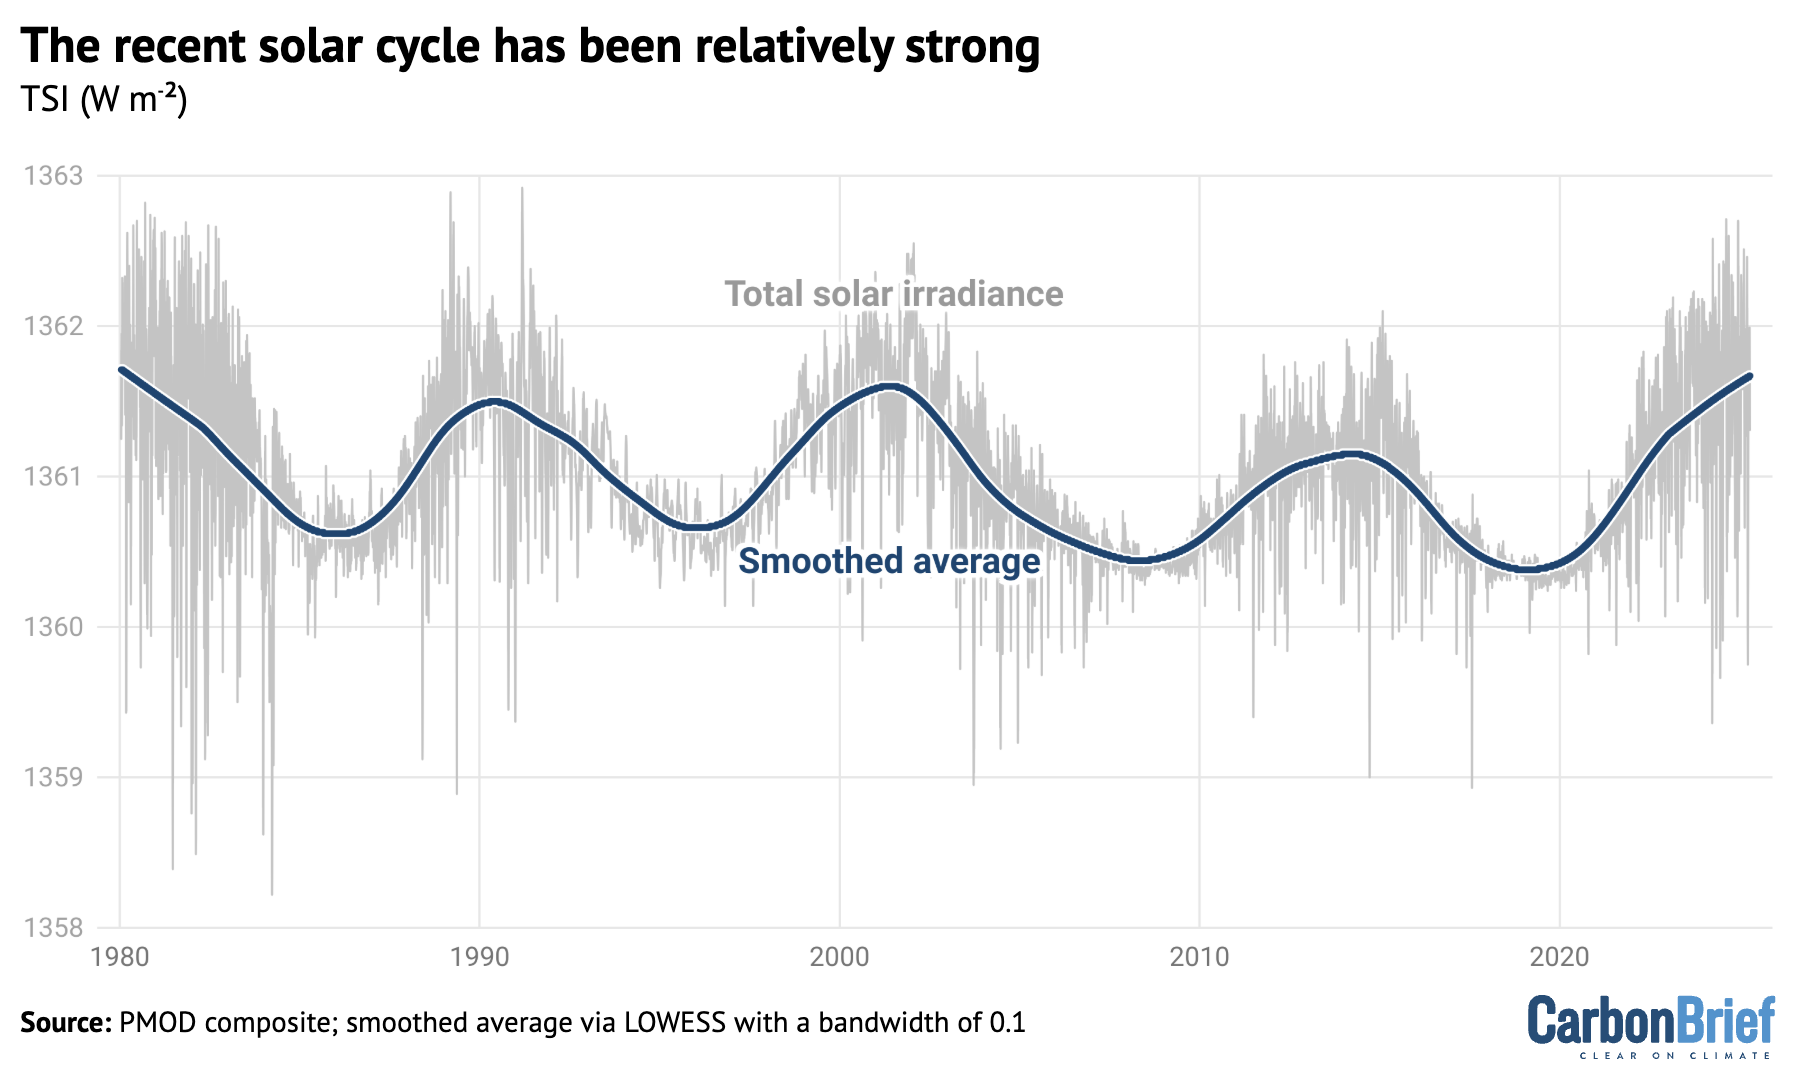
The 11-year solar cycle is relatively modest compared to the sun’s total output, varying only a few watts per metre squared between peak and trough – amounting to around 0.01% of solar output. However, these changes can result in variations of up to 0.1C in global temperatures within a decade.
The most recent solar cycle – solar cycle 25 – began around 2020 and has been the strongest solar cycle measured since 1980. It was stronger than most models had anticipated and likely contributed to around 0.04C global warming in 2023 and 0.07C in 2024.
Putting together the drivers
By combining earlier estimates of different factors contributing to 2023 and 2024 global surface temperatures, about half of 2023’s unusual warmth and almost all of 2024’s unusual warmth can be effectively explained.
This is illustrated in the figure below, which shows the five different factors discussed earlier – El Niño, shipping SO2, Chinese SO2, the Hunga Tonga-Hunga Ha’apai volcano and solar cycle changes – along with their respective uncertainties.
The sum of all the factors is shown in the “combined” bar, while the actual warming compared to expectations is shown in red.
The upper chart shows 2023, while the lower one shows 2024.
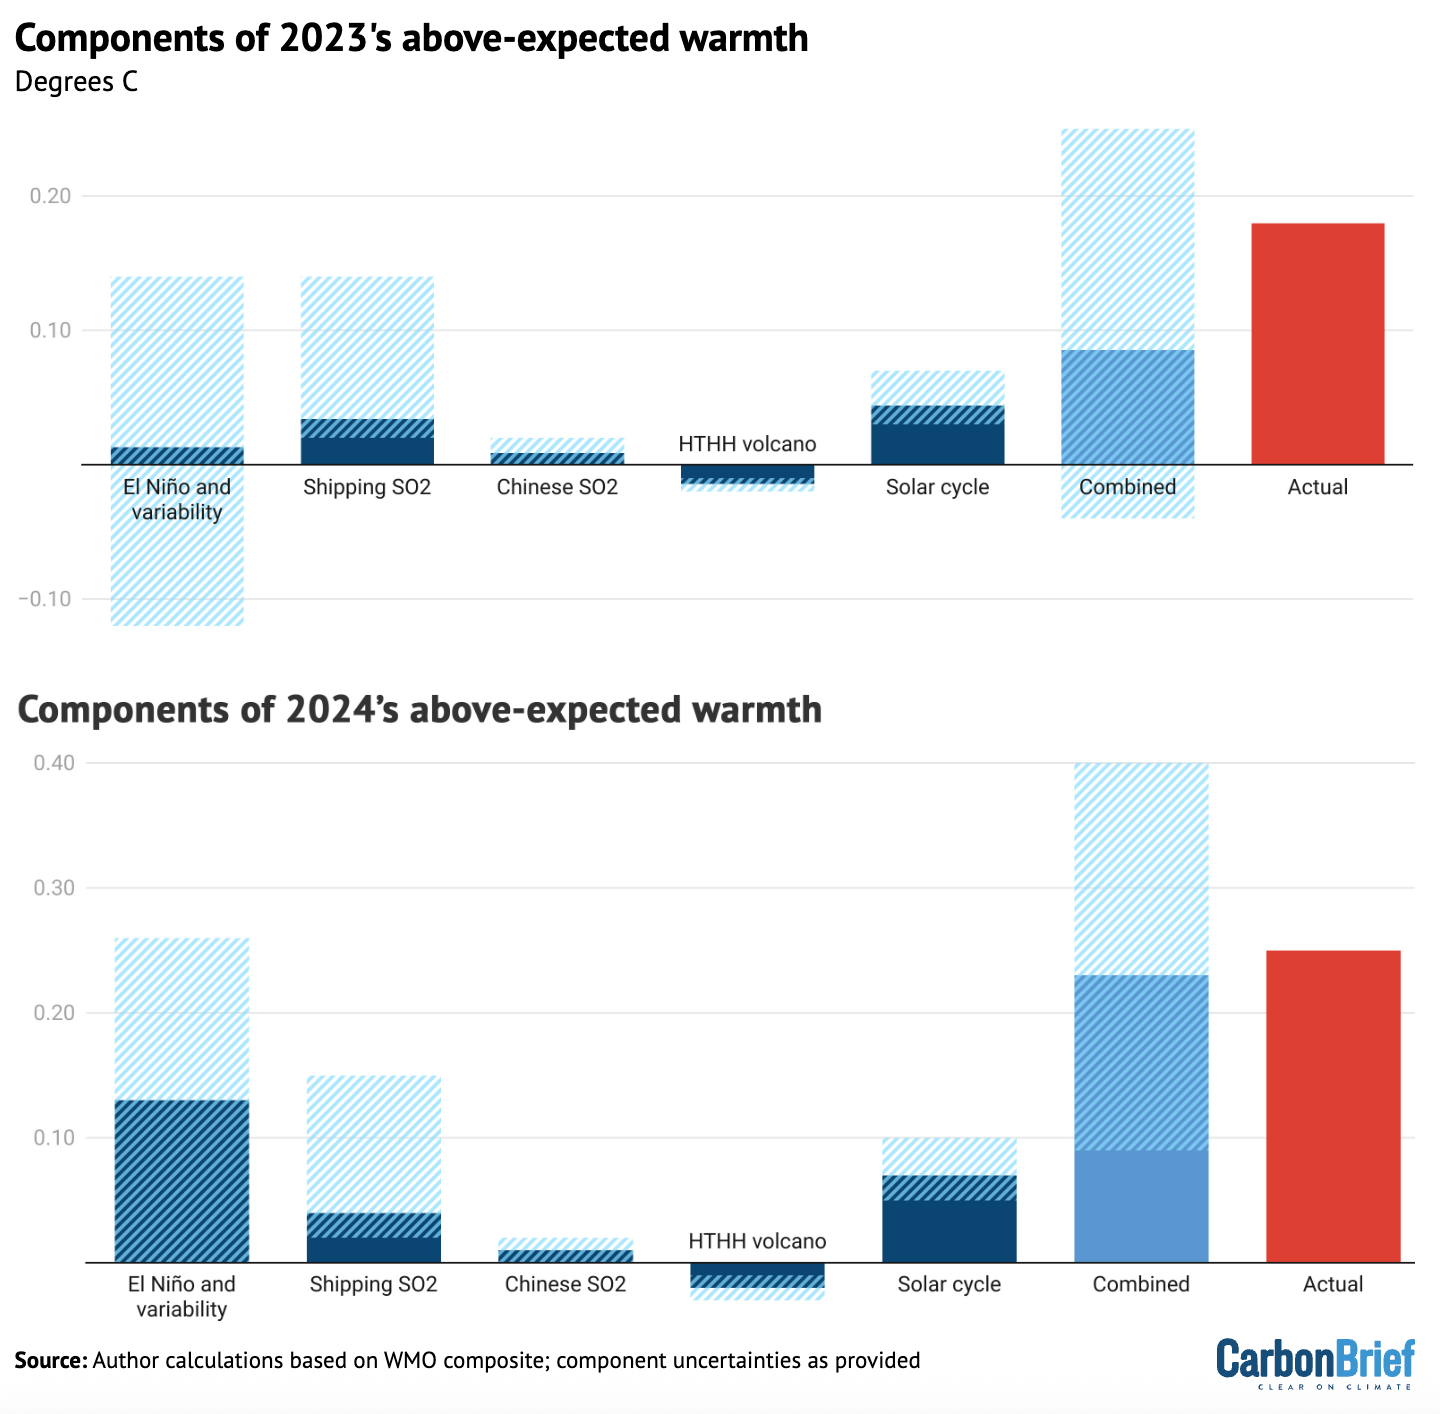
It is important to note that the first bar includes both El Niño and natural year-to-year variability; the height of the bar reflects the best estimate of El Niño’s effects, while the uncertainty range encompasses year-to-year variability in global temperatures that may be – at least in part – unrelated to El Niño.
The role of natural climate variability
Large natural variability to the Earth’s climate is one of the main reasons why the combined value of the different drivers of expected warmth in 2023 has an uncertainty range that exceeds the observed warming – even though the best-estimate of combined factors only explains half of temperatures.
Or, to put it another way, there is up 0.15C difference in global temperatures year-on-year that cannot be explained solely by El Niño, human-driven global warming, or natural “forcings” – such as volcanoes or variations in solar output.
The figure below shows the difference between actual and expected warming in the global temperature record for every year in the form of a histogram. The vertical zero line represents the expectation given long-term global warming and the other vertical lines indicate the warming seen in 2023, 2024 and 2025.
The height of each blue bar represents the number of years over 1850-2024 when the average global temperature was that far (above or below) the expected level of warming.
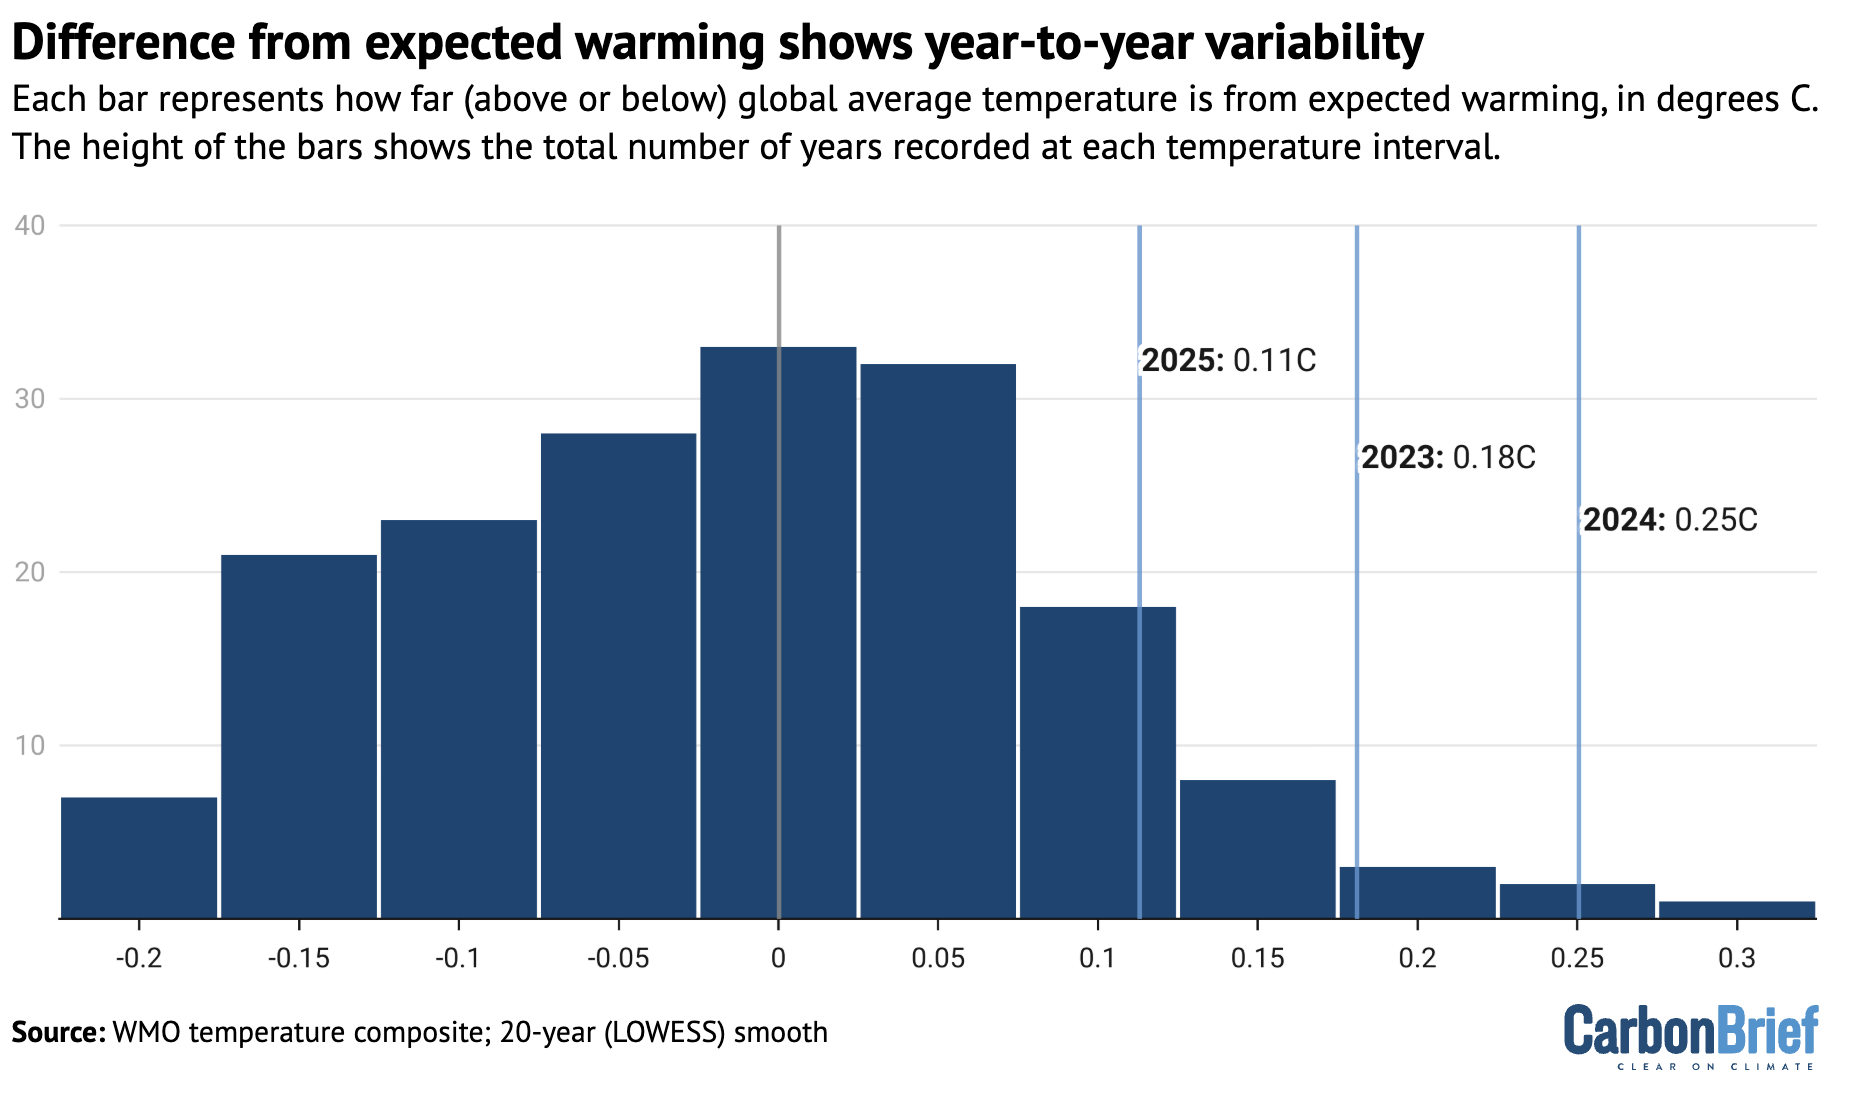
Based on the range of year-to-year variability, temperatures would be expected to spike as far above the long-term trend as they did in 2023 once every 25 years, on average. The year 2024 would be a one-in-88 year event, whereas 2025 would be a less-unusual, one-in-seven year event.
These likelihoods for the past three years are sensitive to the approach used to determine what the longer-term warming level should be.
In this analysis, Carbon Brief used a local smoothing approach (known as locally estimated scatterplot smoothing) to determine the expected temperatures, following the approach used in the WMO “state of the climate 2024” report.
This approach results in a warming of 1.28C in 2023 and 1.30C in 2024, against which observed temperatures are compared.
Other published estimates put the longer-term warming in 2024 notably higher.
Earlier this year, the scientists behind the “Indicators of Global Climate Change” (IGCC) report estimated that human activity caused 1.36C of recent warming in 2024. They also found a slightly lower overall warming level for 2024 – 1.52C, as opposed to the WMO’s 1.55C – because they looked exclusively at datasets used by IPCC AR6. (This meant estimates from the Copernicus/ECMWF’s ERA5 dataset were not included.)
Based on climate simulations, the IGCC report finds the likelihood of 2024’s warmth to be a one-in-six year event and 2023’s a one-in-four event.
Using the same assumptions as the IGCC, Carbon Brief’s approach calculates that 2024 would be a less-common, one-in-18 year event.
However, the IGCC estimate of current human-induced warming is based on the latest estimates of human and natural factors warming the climate. That means that it already accounts for additional warming from low-sulphur shipping fuel, East Asian aerosols and other factors discussed above.
Therefore, the results from these two analyses are not necessarily inconsistent: natural climate variability (including El Niño) played a key role – but this came in addition to other factors. Natural fluctuations in the Earth’s climate alone would have been unlikely to result in the extreme global temperatures seen in 2023, 2024 and 2025.
A cloudy picture
Even if unusual recent global warmth can be mostly attributed to a combination of El Niño, falling SO2 emissions, the Hunga Tonga-Hunga Ha’apai volcano, solar cycle changes and natural climate variability, there are a number of questions that remain unanswered.
Most important is what the record warmth means for the climate going forward. Is it likely to revert to the long-term average warming level, or does it reflect an acceleration in the underlying rate of warming – and, if so, what might its causes be?
As explained by Carbon Brief in a 2023 article, climate models have suggested that warming will speed up. Some of this acceleration is built into the analysis presented here, which includes a slightly faster rate of warming in recent years than has characterised the period since 1970.
But there are broader questions about what – beyond declining SO2 and other aerosols – is driving this acceleration.
Research recently published in the journal Science offered some potential clues. It found a significant decline in planetary reflectivity – known as albedo – over the past decade, associated with a reduced low-level cloud cover that is unprecedented in the satellite record.
The authors suggest it could be due to a combination of three different factors: natural climate variability, changing SO2 and other aerosol emissions and the effects of global warming on cloud reflectivity.
Natural climate variability seems unlikely to have played a major role in reduced cloud cover, given that it was relatively stable until 2015. However, it is hard to fully rule it out given the relatively short satellite record.
Reductions in SO2 emissions are expected to reduce cloud reflectivity, but the magnitude of the observed cloud reflectivity changes are much larger than models simulate.
Models might be underestimating the impact of aerosols on the climate. But, if this were the case, it would indicate that climate sensitivity might be on the higher end of the range of model estimates, because models that simulate stronger aerosol cooling effects tend to have higher climate sensitivity.
Finally, cloud cover might be changing and becoming less reflective as a result of warming. Cloud responses to climate change are one of the largest drivers of uncertainty in future warming. One of the main reasons that some climate models find a higher climate sensitivity is due to their simulation of less-reflective clouds in a warming world.
The Science study concludes that the 2023 heat “may be here to stay” if the cloud-related albedo decline was not “solely” caused by natural variability. This would also suggest the Earth’s climate sensitivity may be closer to the upper range of current estimates, it notes.
Methodology
Carbon Brief built on work previously published in the IGCC 2024 and WMO state of the global climate 2024 reports that explores the role of different factors in the extreme temperatures in 2023, 2024 and 2025.
The impact of El Niño Southern Oscillation (ENSO) on the temperatures was estimated using a linear regression of the annual mean global temperature anomaly on the Feb/Mar Niño 3.4 index. This resulted in an impact of −0.07C, 0.01C and 0.13C for 2022, 2023 and 2024 respectively (with a 95% confidence interval of ±0.13 ºC).
It is important to note that the uncertainties in the ENSO response estimated here also incorporate other sources of unforced internal (modes of variability in other basins such as AMV), and potentially some forced variability. The bar in the combined figure is labelled “El Niño and variability” to reflect this.
For details on calculations of the temperature impact of shipping and Chinese SO2 declines, see Carbon Brief’s explainer on the climate impact of changing aerosol emissions.
Solar cycle 25 was both slightly earlier and slightly stronger than prior expectations with a total solar irradiance anomaly of 0.97 watts per metre squared in 2023 relative to the mean of the prior 20 years. This resulted in an estimated radiative forcing of approximately 0.17 watts per metre squared and an estimated global surface temperature increase of 0.07C (0.05C to 0.10C) with a one- to two-year lag based on a 2015 study. Thus, the impact on 2023 and 2024 is around 0.04C and 0.07C, respectively (+/- 0.025C). This is a bit higher warming than is given by the FaIR model, as the 2015 study is based on global models that have ozone responses to the UV changes, which amplifies the temperature effects a bit.
The Hunga Tonga-Hunga Haʻapai volcanic eruption added both SO2 and water vapour to the stratosphere (up to 55km in altitude). The rapid oxidation of SO2 to sulphate aerosol dominated the radiative forcing for the first two years after the eruption. As a result, the net radiative forcing at the tropopause was likely negative; −0.04 watts per metre squared and −0.15 watts per metre squared in 2022 and 2023, respectively, implying a temperature impact of -0.02C (-0.01C to -0.03C) calculated using the FaIR model.