Analysis: What do China’s gigantic wind and solar bases mean for its climate goals?

Guest authors
05.03.22Guest authors
03.05.2022 | 3:19pmChina is set to add at least 570 gigawatts (GW) of wind and solar power in the 14th five-year plan (FYP) period (2021–25), more than doubling its installed capacity in just five years, if targets announced by the central and provincial governments are realised.
Our compilation and analysis of targets and projects announced by the central and provincial governments shows wind and solar capacity would reach more than 1,100GW by 2025, tripling the 360GW total installed in 2015 and doubling the 536GW at the end of 2020.
The wind and solar plans emerging from recent policymaking are far ahead of the pace implied by China’s headline climate commitments. As a part of the country’s goal to peak its carbon dioxide (CO2) emissions before 2030 and achieve carbon neutrality before 2060, President Xi Jinping announced that China would increase its total installed capacity of wind and solar power to “over” 1,200GW by 2030.
This target would have required maintaining the pace of 70GW per year of new capacity already achieved in the previous FYP period (2016-20). Installing the 570GW of wind and solar we identified would put China on track to meet the 1,200GW target in 2026, four years earlier than planned, our analysis shows.
The acceleration is driven in large part by the so-called “clean energy bases” – unprecedentedly large-scale concentrations of wind and solar power.
The National Development and Reform Commission (NDRC), China’s state economic planner, has published two lists of gigantic wind and solar clean energy bases – one last November and one in March this year. These bases will host about half of the wind and solar capacity to be connected to the grid by 2025, primarily located in China’s deserts and other barren land.
Along with other plans for clean energy expansion, the new wind and solar power could be enough to peak China’s fossil fuel consumption – and CO2 emissions – before 2025.
What are ‘clean energy bases’?
The concept of “clean energy bases” was first introduced in China’s overarching 14FYP in early 2021, showing the importance of the concept – most energy sector plans are designated to the sectoral FYP.
The bases are areas designated for the simultaneous construction of numerous large wind and solar parks, each a gigawatt-scale development in its own right, combined with long-distance transmission lines to demand centres and – in most cases – “supporting” coal power plants. The earlier FYPs for 2011-15 and 2016-20 had featured a similar concept of “coal bases”, many of which are located in the same less-developed western provinces as the clean energy bases.
A major reason for both the coal bases and the clean energy bases is to utilise the resources of the sparsely populated western provinces to satisfy the energy demand of the more populous and prosperous east.
Large-scale renewable energy development requires large amounts of land. China has 2.6m square kilometres of desertified land, accounting for a quarter of its landmass or roughly four times the size of France.
Building large clean energy bases concentrated in sandy and rocky deserts, other types of barren lands, as well as wasteland left behind by coal mining across the country, can reduce the costs of land, construction, operation and maintenance for the projects.
Choosing the deserts and other arid regions also has the ecological benefits of transforming the landscape and unlocking new-found uses for marginalised areas.
The largest clean energy bases make use of the vast deserts of Inner Mongolia and Gansu, as seen in the map below. The two provinces plan to install approximately 190GW of new wind and solar capacity by 2025, on top of the current installed capacity of 74GW.

China’s ‘clean energy bases’ will help double its wind and solar capacity in five years
Desert base
Offshore base
Provincial plans and other bases
Inner Mongolia
Inner Mongolia
Beijing
Beijing
Beijing
Gansu
Gansu
Hebei
Hebei
Shaanxi
Shaanxi
Henan
Henan
Shanghai
Hunan
Hunan
GW
50>
>10
Shenzhen
Shenzhen
Hainan
Hainan
1,000 km
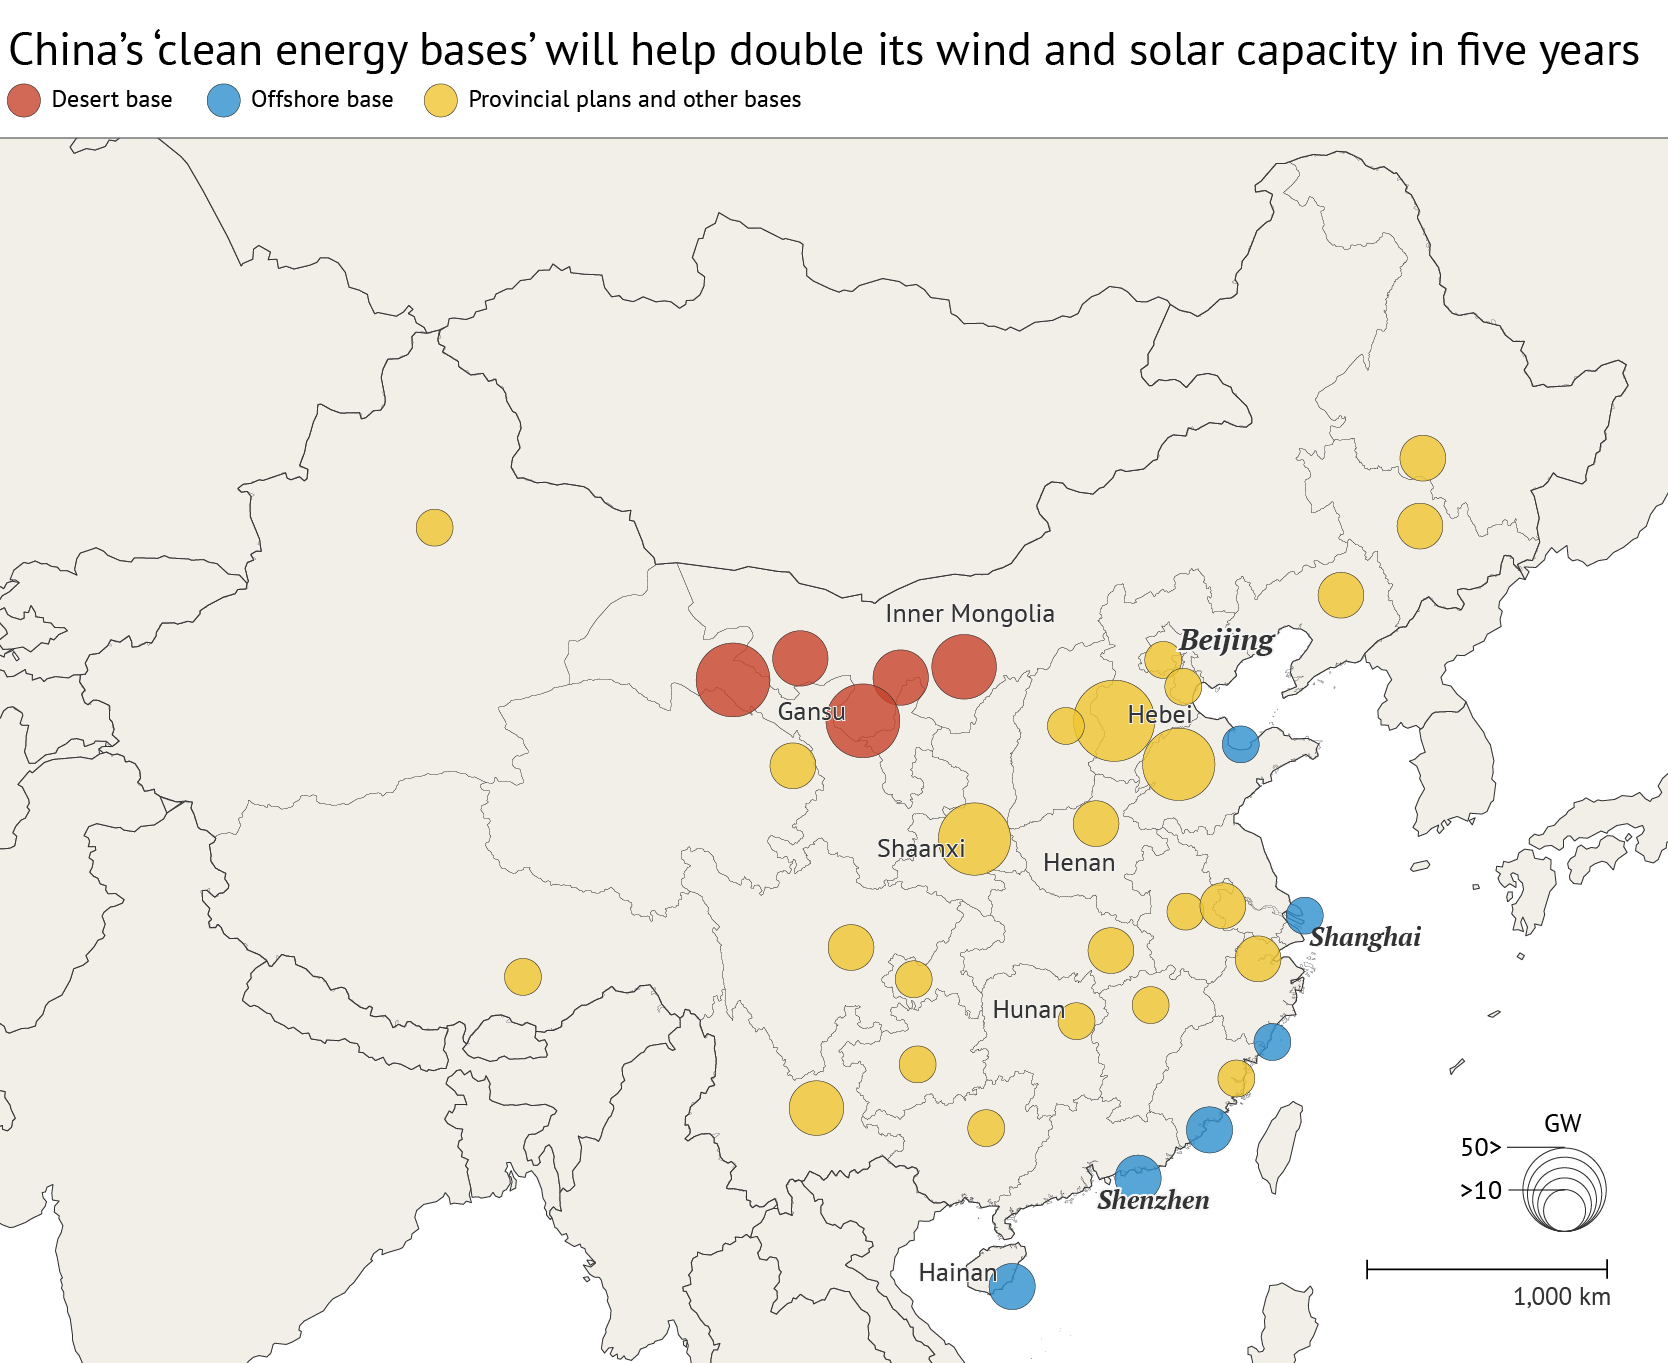
Clean energy bases and provincial clean energy installation plans with targeted installed wind and solar capacity by 2025 indicated by the size of the circles. The desert bases (red circles) in western Inner Mongolia and Gansu, offshore wind bases across the coast (blue) and provinces’ own clean energy expansion (yellow) will all provide electricity to the demand centres in the east. Source: Authors’ compilation of targets from policy documents. Map by Tom Prater for Carbon Brief.
Projects in the first list have a total installed capacity of 97GW, scattered across 19 provinces, with 43GW in the Gobi and other deserts in north and north-west China. Construction was started in 2021 on 75GW of the projects and the rest is scheduled to start in the first quarter of 2022. All the projects aim to be completed between 2022 and 2023.
Projects in the second list are primarily situated around the Kubuqi, Ulan Buhe, Tengger and Badain Jaran desert with a combined capacity of 284GW. Another 134GW of capacity is distributed in other desert areas. A further 37GW will be built in coal mining subsidence areas.
Of the total capacity of the bases in 2025, 150GW is dedicated to long-distance transmission to the demand centres in the eastern coastal provinces. The number is set to rise to 315GW before 2030.
The bases will be an important counterweight to the coal industry. For example, the main host province, Inner Mongolia, is China’s second largest coal miner and largest coal power producer, with per-capita CO2 emissions twice as high as the US average. Without carving out a new role in clean energy, the province’s industrial sector would lose out economically from China’s energy transition.
The huge clean energy bases make use of the government’s ability to plan, finance and implement gigantic construction projects. They also provide an economic replacement for the coal industry and large-scale coal-based industrial projects that are a central part of China’s regional development policy.
The scale
The two lists contain a total of 555GW wind and solar capacity to be installed by 2030. In addition to the 97GW projects in the first list, the central government has announced in the second list that it would arrange a total of 300GW of clean energy base projects by 2025, with another 255GW of capacity to be added after 2025.
To give an idea of the size of the clean energy bases, the total wind and solar installed capacity in 2020 of the top six countries after China was 537GW, equal to the total capacity installed in China.
The targeted expansion of wind and solar energy in the 14FYP period in the northwestern deserts alone is equal to the total installed wind and solar capacity in the US in 2020.
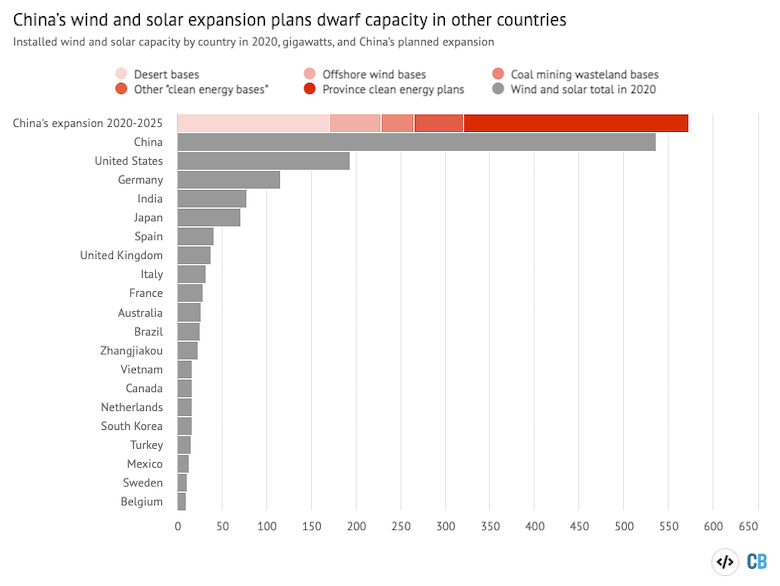
Total installed wind and solar capacity by country at the end of 2020, in comparison with China’s planned expansion from 2020 to 2025. Source: Capacity by country for wind and solar; China’s planned expansion based on authors’ compilation of central and provincial government targets. Chart by Joe Goodman for Carbon Brief using Highcharts.
Provincial ambitions
Along with the national-level projects championed by the central government, province-level targets and initiatives are also going to drive clean energy expansion. After Inner Mongolia and Gansu, the highest targets for wind and solar expansion have been set by Shaanxi, another major coal-producing western province, followed by Hebei and Shandong, which are major heavy industry hubs in the east. Between them, these three provinces are planning another 190GW of wind and solar added in 2021-25.
Hebei’s wind and solar plans build on the Zhangjiakou clean energy base, which is a pilot for the gigantic wind and solar clean energy bases and demonstrated its ability by powering the winter Olympics.
Coastal provinces are planning major offshore wind developments. By the end of 2025, the total installed capacity of offshore wind power in Guangdong will reach 18GW, while the provinces of Fujian, Zhejiang and Jiangsu are aiming for 13.3GW, 6GW and 9GW of offshore wind power projects, respectively.
Shandong province is aiming to build 35GW of offshore wind by 2030, with the construction of 10GW to start during the 14FYP period and 5GW capacity to be added to the grid by 2025. The National Energy Administration (NEA), which is responsible for formulating and implementing energy development plans and industrial policies, has permitted Hainan province to build 12.3GW of offshore wind during the 14FYP period.
Rethinking the role of coal power
The planned installation of wind and solar projects will see their share of China’s power generation rise close to 20% in 2025 – up from 12% in 2021 – and their installed capacity increase to 45% of the total installed capacity of power generation by the same year.
To absorb this increase in power generation from variable sources, major changes will need to take place in the operation of China’s power grid and coal-fired power plants.
China’s power generation is still dominated by coal, with a share of 60%, although its installed capacity has dropped below 50%, as the chart below shows.
The share of wind and solar has risen rapidly, reaching 27% of installed capacity and 12% of generation in 2021. Hydropower accounts for 16% of power generation, with nuclear providing 5% and gas 6% of the total.
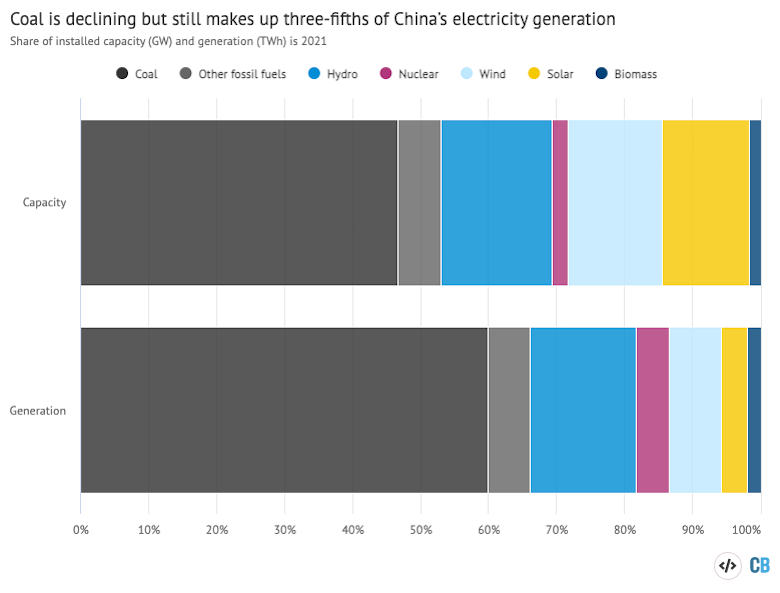
Shares of China’s installed power generating capacity at the end of 2021 (top) and electricity generation in 2021 (bottom). Source: China Electricity Council. Chart by Joe Goodman for Carbon Brief using Highcharts.
The new 14FYP for energy places a significant emphasis on the functioning of the power system, including flexible operation of coal power plants, demand-side response, development of electricity markets, electricity storage and green hydrogen.
A key theme running through the plan appears to be creating the preconditions for emissions to peak and decline after 2025 – rather than aiming for a specific emissions target.
For coal-fired power, the major change is that it should become a “supporting” power source for grid stability and for wind and solar power, rather than the “mainstay” of power generation – which is the role China has assigned to coal for the time being. This means that the plants will have to operate more flexibly, ramping up and down in response to variations in wind and solar power generation and in electricity demand.
A part of this change is technical retrofits allowing the plants to increase or decrease their output more rapidly. Another, more challenging aspect is creating the incentives for flexible operation of coal power.
This is being put into action in the plans for many of the clean energy bases, where typically one gigawatt of new coal power is built for every six gigawatts of wind and solar, in addition to retrofitting some of the existing plants.
The five-year plan target for the western bases is for 50% of the additional power generation to be zero-carbon – with the rest coming from coal. This means that the provinces have a licence to add coal-fired power plants as “supporting” sources.
The target implies that coal-fired power generation will still increase in China’s west, but the increase should displace coal power in the east, a change that has been a politically challenging shift to implement, as provinces tend to pursue a mercantilist policy of maximising local production.
In Inner Mongolia and Gansu, at least 28GW of “supporting” coal power are planned to be added. In addition, 16GW of existing coal power plants will be repurposed as “supporting” sources for the bases. This likely means that two-thirds of the additional power generation added under the programme is zero-carbon, as the average utilisation of coal-fired capacity is twice as high as that of wind and solar.
Achieving even this share of clean electricity will require significant changes to the way the long-distance transmission lines are operated. Electricity exporters wish to reduce the amount of electricity sent out during peak times to avoid local power shortages. Grid operators in the receiving provinces have tended to treat the importing power lines as on-demand resources. Utilising the wind and solar output when it is available means that the receiving provinces have to adjust the operation of local coal power plants to the variations of wind and solar output elsewhere, often thousands of kilometres away.
A key to the success of the programme is to overcome the resistance towards this change from local governments and generating companies, which would see the utilisation and revenue of their local power plants fall as a result.
Coal power being designated a “supporting” power source also means that new coal power should only be built when required for grid stability or to enable the integration of wind and solar into the grid.
Approvals of new coal power plants have surged in recent months, with many projects hard to justify under these criteria. For example, the justification given by a local government statement for a 2,000-megawatt (MW) coal power plant on an island off the coast of the eastern Zhejiang province was to “reduce cross-province electricity trading”, in direct contradiction with the central government priorities.
In another case in the western province of Ningxia, a 6GW clean energy base was supposed to be “supported” by repurposed existing coal power plants. However, the provincial government reactivated the plan to build a 1,320MW coal power project, which – as local officials said – would “support” the base.
Will the expansion be enough to deliver peak emissions?
Replacing coal, oil and gas use in transport, industry and heating with electricity is the cornerstone of the plans outlined by Chinese researchers for reaching carbon neutrality. The country has also recently unveiled a hydrogen industry development plan that aims to pilot green hydrogen production and the key hydrogen-using technologies by 2025, with large-scale adoption by 2030. These plans require vast amounts of zero-carbon power generation to succeed.
To achieve carbon neutrality before 2060, the annual installations of renewable power capacity need to reach around 150-200GW. So further growth will be needed after 2025. As energy demand growth is projected to slow down and clean energy additions accelerate, the clean energy scale-up during this five-year period certainly puts China on track to peak emissions in the 2025–30 period, which is sufficient to meet the country’s international commitments.
However, those commitments are rated as “highly insufficient” and an earlier peak is needed to align with the goals of the Paris Agreement.
The clean energy expansion targeted from 2020 to 2025 will deliver around 1,500 terawatt hours (TWh) of clean power generation. This is sufficient to cover average electricity demand growth of 4% without increasing fossil power generation. Around 70% of the increase will come from wind and solar, with nuclear, hydro and biomass making up the rest.
Electricity demand surged in late 2020 and early 2021, with a 16.5% increase in the first six months of 2021. In the second half of 2021, electricity demand was flat year-on-year.
Amid these sharp changes in electricity demand, growth to 2025 is hard to forecast. Growth rates will depend on the economic policies adopted now that the economy is slowing down again. The earlier surge in demand was a result of Covid-related stimulus policies favouring construction and heavy industry sectors.
Before the surge, different institutions were forecasting an average growth rate of 3–5% from 2020 to 2025. If total energy consumption returns to the growth trajectory that was predicted before the Covid-related surge in demand, meaning that the rapid growth in 2021 is offset by slower-than-projected growth over the rest of the period, the zero-carbon energy additions shown on the right in the chart below are likely to more than cover total demand growth (dark red bar on the left).
This would enable fossil energy consumption and CO2 emissions to peak before 2025.
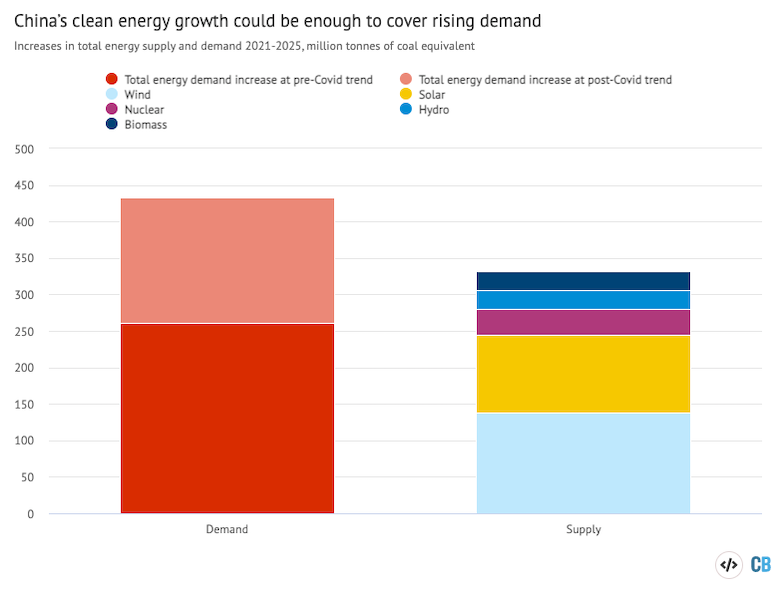
The projected increase in the supply of zero-carbon (non-fossil) energy from 2021 to 2025, compared with two different projections for the increase in total energy consumption. Sources: Energy demand growth from Tsinghua Institute of Climate Change and Sustainable Development’s low-carbon roadmap; supply projections based on authors’ compilation of capacity targets. Chart by Joe Goodman for Carbon Brief using Highcharts.
However, if growth continues from the 2021 level at the annual rate projected before the jump in demand, zero-carbon sources are still likely to fall short of covering demand growth, implying a continued increase in emissions.
Electrification of transport, industry and household heating could accelerate electricity demand growth. But, similarly, if total energy demand returns to the trend that was projected before the Covid-related surge, the increase in total primary energy demand from 2020 to 2025 could be covered by clean energy.
Electricity sector emissions would increase over the period, but the increase would be offset by the reduction in energy use outside the power sector, as coal, oil and gas use are replaced with electricity.
If the various clean energy plans for this five-year period analysed here are fully realised, they could enable an emissions peak before 2025. This depends, however, on energy demand growth and, above all, on economic policy over the next few years.
Methodology
Targeted wind and solar capacity has been compiled from the provinces’ five-year plans and announced clean energy base plans. For each province, the amount of capacity that needs to be added to meet all of the targets has been assessed. Targets for total installed capacity have been converted to added capacity based on installed capacity at the end of 2020 (the base year for the 14th five-year plan). Targets for the share of renewable energy in total installed capacity have been converted to the required amount of installed capacity on the basis of targeted total power generation capacity at the end of 2025.
Power generation from wind and solar has been projected based on the “incremental capacity factor” for each source in 2017-21, the ratio of added generation to added capacity over this period. Newer installations tend to have higher capacity factors, especially for wind, due to larger turbines, changes in turbine design and the increased share of offshore installations. For other sources, the average capacity factor has been used.
-
Analysis: What do China's gigantic wind and solar bases mean for its climate goals?