Analysis: World has already passed ‘peak oil’, BP figures reveal
Simon Evans
09.15.20Simon Evans
15.09.2020 | 5:25pmThe world has already passed “peak oil” demand, according to Carbon Brief analysis of the latest energy outlook from oil major BP.
The 2020 edition of the annual outlook reveals – albeit indirectly – that global oil demand will not regain the levels seen last year. It adds that demand could soon fall rapidly in the face of stronger climate action – by at least 10% this decade and by as much as 50% over the next 20 years.
The latest outlook was delayed by six months so that it could reflect the unprecedented impact of the coronavirus pandemic. The delay also reflects BP’s plans, set out over the course of this year, to reach net-zero emissions by 2050 – as an “integrated energy company”, rather than an oil major.
This means that alongside its conservative “business-as-usual” scenario – in which demand for gas continues to rise indefinitely – BP has also looked at the effect of stronger climate action. In its “rapid” and “net-zero” scenarios, coal and oil see fast declines, while gas peaks by 2025 or 2035.
Although the net-zero focus is new, Carbon Brief analysis shows the outlook continues the trend of previous editions, by cutting the prospects for fossil fuels while raising the bar for renewables.
‘Peak oil’
Global oil demand has doubled over the past 50 years, reaching around 100m barrels per day in 2019, equivalent to an annual energy consumption of 192 exajoules (EJ).
In earlier editions of the BP outlook, global oil demand was expected to continue rising steadily. Indeed, successive editions had raised the outlook for oil, shown in blue lines in the chart below.
By 2018, BP’s outlook started to foresee an end to the upwards march for oil, with demand peaking by the mid-2030s. But the downwards revision in this year’s edition is much more dramatic (red lines), showing demand having already peaked in 2019, with large potential downside risks.
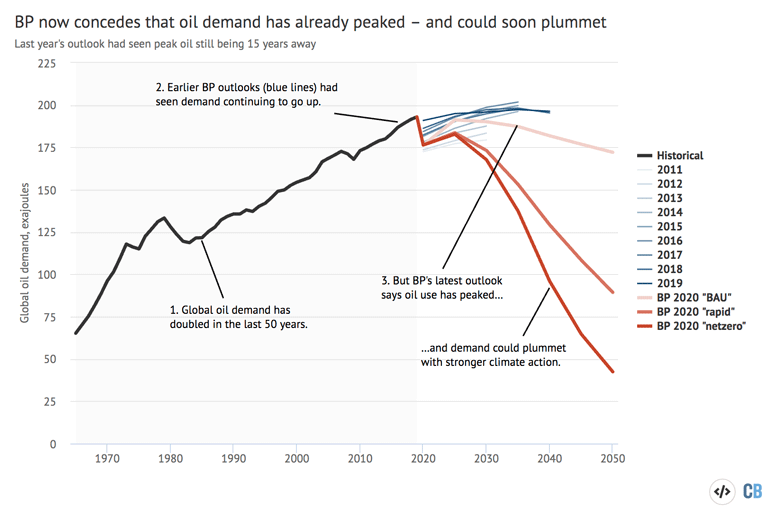
In his presentation for the new outlook, BP chief economist Spencer Dale does say that it shows oil demand having peaked in 2019, but only in two of the three scenarios. For the “business-as-usual” scenario, he says demand is “more resilient” and recovers to “around its pre-Covid levels” by 2025.
However, Carbon Brief analysis of the outlook, combined with BP figures released separately in June, shows that oil demand would never surpass levels seen in 2019, when measured in terms of the energy it contains.
[The outlook data puts oil demand in 2018 at 190.4EJ, but does not include a figure for 2019. The BP statistical review reported oil demand growth of 0.8% between 2018 and 2019, which Carbon Brief used to estimate demand in 2019 of 191.9EJ. This is marginally higher than the level of demand in 2025 under the business-as-usual outlook, some 191.3EJ.]
It is interesting to compare the latest outlook to the words co-authored by Dale in a January 2018 commentary with Bassam Fattouh, director of the Oxford Institute of Energy Studies. In that piece, the pair argued that the focus on peak oil “seems misplaced”. They continued:
“More importantly, there is little reason to believe that once it does peak, that oil demand will fall sharply. The world is likely to demand large quantities of oil for many decades to come.”
In contrast, the newly released BP outlook shows that oil demand could indeed “fall significantly”, declining by at least 10% by 2030 and by as much as 50% by 2040.
The largest reduction in oil demand is in BP’s “net-zero” scenario, where global CO2 emissions fall by more than 95% in 2050, compared to their 2018 levels.
This trajectory is, says BP, “slower” than in “below 1.5C” scenarios published by the Intergovernmental Panel on Climate Change, meaning faster declines in fossil fuel use – or reliance on negative emissions – would be needed to stay within this temperature limit.
Slowing demand
As ever, a key underlying feature of the BP outlook is its assumptions about the overall increase in global energy demand as populations rise and incomes expand.
Historically, energy demand has risen steadily with few interruptions, as the chart below shows. Previous editions of the BP outlook have seen demand continuing to rise at a similar pace (blue lines), with improvements in energy efficiency being offset by economic and population growth.
This year’s outlook marks a dramatic shift in this view, with global energy demand growth either slowing down or even levelling off over the next three decades (red lines).
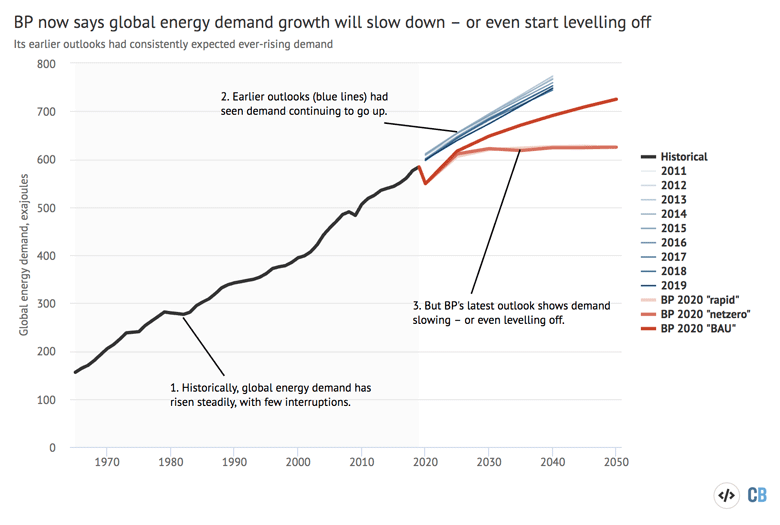
As Carbon Brief showed last year, an ever-expanding demand for energy has been the central driver of long-term demand for fossil fuels in BP’s outlooks. In contrast, other organisations have suggested that demand could slow down, leaving fossil fuels squeezed out by renewable growth.
Part of this year’s shift from BP is down to the coronavirus pandemic, seen clearly in the charts above, where demand in 2020 is estimated using International Energy Agency (IEA) forecasts.
According to BP, the pandemic has cut the outlook for long-term energy demand in two ways. First, it cuts the prospects for economic growth and, second, it is assumed that some behavioural changes – notably, home working – will persist, even as other changes dissipate over time.
Shifting outlook
The weaker prospects for global energy demand and slower growth for oil are a continuation of the trend in each successive edition of BP’s outlook over the past decade.
This year’s edition once again cuts the outlook for fossil fuels, as the charts below show, with the most dramatic revisions having been applied to coal use. (BP’s past outlooks have also consistently raised the bar for renewable growth, but this year leaves it largely unchanged.)
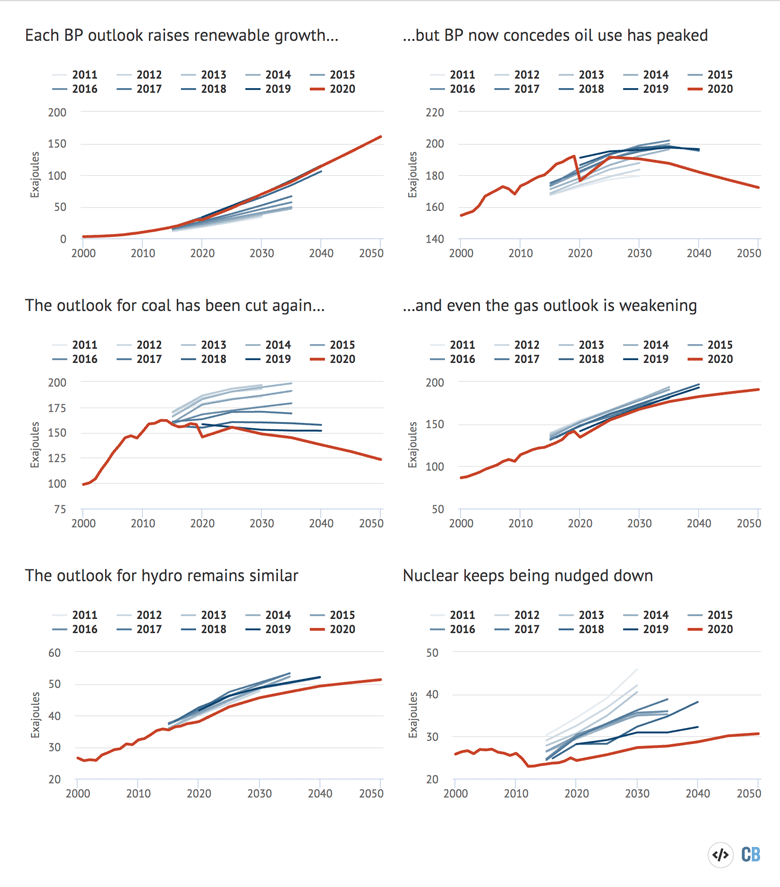
While this year’s “business-as-usual” scenario does not significantly alter the outlook for renewables compared with last year’s edition, the “rapid” and “net-zero” pathways show the likes of wind and solar recording explosive growth over the next three decades.
In the net-zero scenario, renewables supply some 130EJ in 2030, more than four times their output in 2019 and similar to current supplies from gas. By 2040, renewables more than double again to reach 296EJ, equivalent to the current total from coal and gas combined.
Just three years ago, BP’s outlook included a peak in global coal demand for the first time. Now, it sees demand falling ever faster, dropping to a fifth below 2019 levels by 2050. In the “rapid” and “net-zero” scenarios, demand for coal falls by one-third by 2030 and by around 90% by 2050.
Notably, this year’s outlook also trims the prospects for gas more significantly than had been the case in previous years. There is even greater downside risk for gas in the “net-zero” pathway, where demand peaks by 2025 and falls to 36% below 2019 levels by 2050. The “rapid” pathway sees gas demand peaking by 2035 and returning to 2019 levels by mid-century.
-
Analysis: World has already passed ‘peak oil’, BP figures reveal
-
Analysis: BP concedes world has already passed ‘peak oil’