Arctic sea ice hits second-lowest winter peak on record
Robert McSweeney
03.26.18Arctic sea ice has experienced its maximum extent for the year, reaching 14.48m square kilometers on 17 March – the second smallest in the 39-year satellite record.
The provisional data from the National Snow and Ice Data Center (NSIDC) shows the 2018 winter peak only narrowly avoided taking 2017’s record.
The run of low extents in recent winters suggests that “profound ice loss is no longer limited to summer but now extends across all seasons”, an NSDIC scientist tells Carbon Brief.
Meanwhile, in Antarctica, sea ice has already reached its minimum extent following the summer melt season. This also clocked in as the second lowest on record.
Second place
As the northern hemisphere emerges from winter, the annual expansion of sea ice in the Arctic slows to a stop. This peak signals the start of the melt season in spring and summer.
Using satellites, scientists can mark this point every year, recording when the Arctic sea ice hit its largest extent and the size it reached. It is one way of monitoring the “health” of the Arctic.
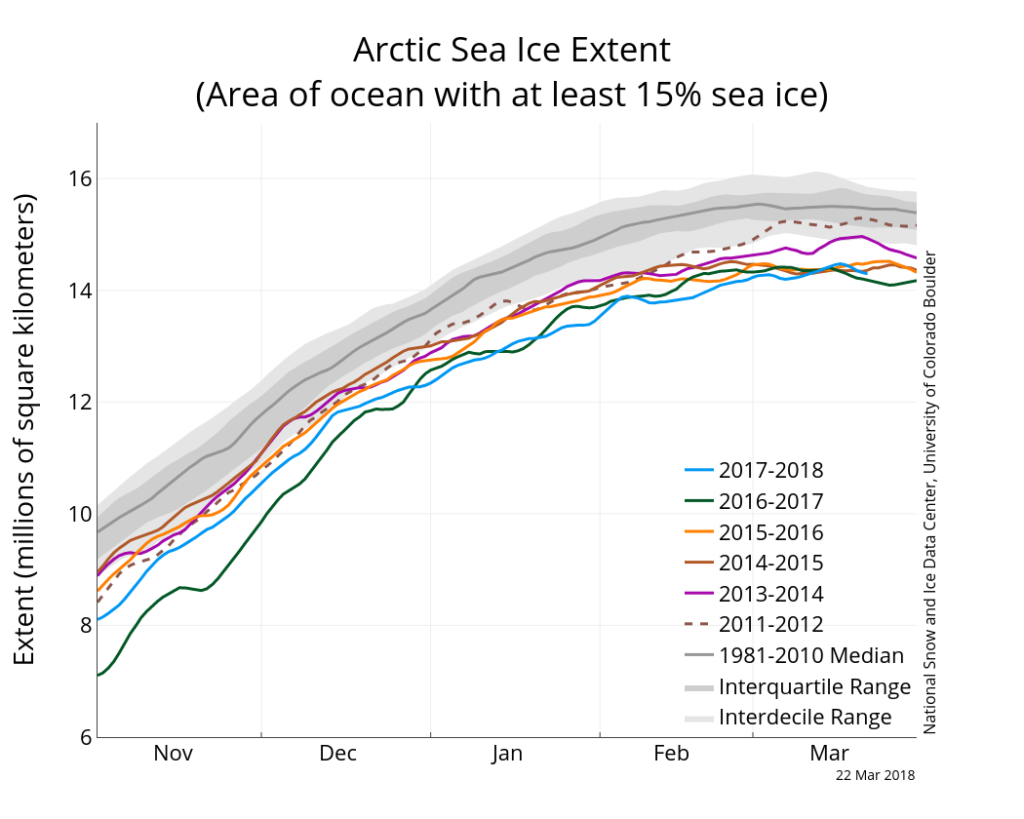
Arctic sea ice extent as of 22 March 2018 for the 2017-18 summer (blue line), along with daily ice extent data for the four previous years: 2016-17 (green), 2015-16 (orange), 2014-15 (brown) and 2013-14 (purple). Also shown is 2011-2012 in dashed brown, the 1981-2010 median (dark grey) and the grey shading shows the range around the median. Credit: NSIDC
Early indications suggest that Arctic sea ice reached an annual maximum of 14.48m square kilometers (sq km) on 17 March. This is the second lowest winter peak in the 39-year satellite record – just 60,000 sq km larger than the 2017 record – and 1.16m sq km smaller than the 1981-2010 average. The chart above shows how closely the 2017 (green) and 2018 (blue) extents tracked through their respective winters.
At the point of this winter’s peak, there were two particular areas with very low sea ice extents, the NSIDC says – the Bering Sea (in the Pacific Ocean between Russia and Alaska) and the Barents Sea (in the Atlantic Ocean to the north of Scandinavia).
The image below gives a snapshot of the sea ice cover for 17 March. The orange line shows the average extent of sea ice for that day over 1981-2010.
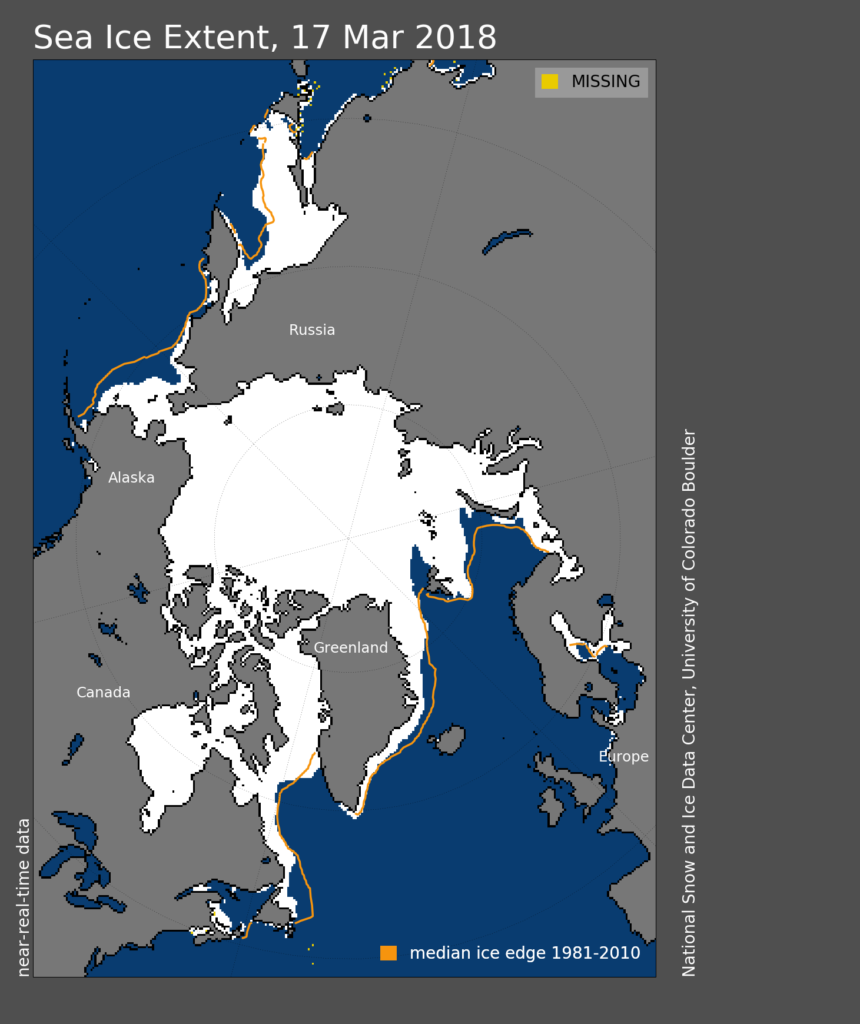
Arctic sea ice extent for 17 March 2017. The orange line shows the 1981- 2010 average extent for that day. Credit: NSIDC
This year has already been marked by new records, with both January and February seeing the smallest average sea ice cover for their respective months. The winter peak looked set to be a record itself before a spell of cold conditions caused a late growth spurt in mid-March.
#Arctic sea ice still has not reached its annual maximum extent. Cold weather across the area is allowing for a late season expansion.
[Graphics: https://t.co/yI6Sgd5QoY] pic.twitter.com/ZshEXCQO0Z
— Zack Labe (@ZLabe) March 14, 2018
The Arctic winter has been marked by some unusually high temperatures, which has in turn pushed bitterly cold conditions over Europe in recent weeks. The chart below, by Zack Labe at the University of California at Irvine, shows how daily average air temperatures over the Arctic (red line) have spent most of January and February substantially above average (white line).
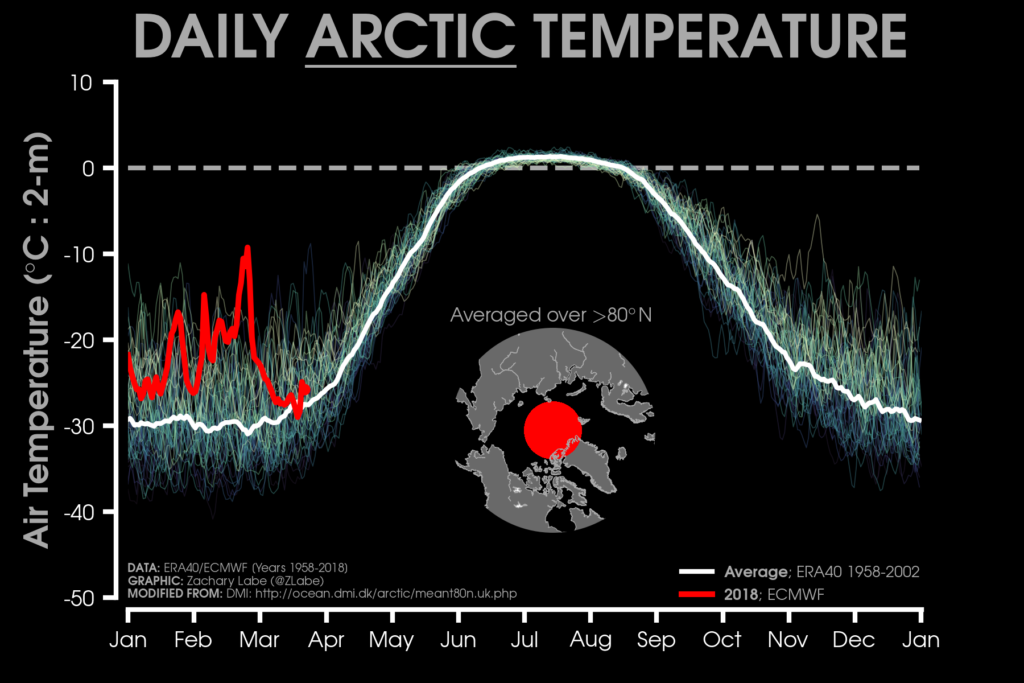
Daily surface air temperature (at two metres above the surface) for the Arctic, averaged above 80 degrees North. Bold lines show 2018 (red) and 1958-2002 average (white). Credit: Zack Labe
This warmth has also likely affected how thick Arctic sea ice is at the moment, says Prof Andrew Shepherd, professor of earth observation at the University of Leeds. He tells Carbon Brief:
“Although Arctic sea ice started this winter about 5cm thicker than the previous year, there was slower growth in December – possibly as a result of the relatively warm weather – and by the end of last month it was around 166cm thick, almost identical to 2017.”
Although Arctic sea ice has reached its maximum extent, it will take a little longer for it to reach its peak volume for the season, adds Shepherd:
“In most years, Arctic sea ice continues to thicken for a few more weeks after the peak extent is reached as it usually takes a while for summer heat to reach the far North, and so we don’t expect the maximum volume to occur until mid-March.”
Top four
This year’s near-record low extent for the winter maximum follows new records in 2015, 2016 and 2017.
This means that the four lowest maximum extents in the satellite record have all occurred in the past four years, notes the NSIDC.
The pattern shows that it is not just the summer where significant sea ice loss is seen, says Prof Julienne Stroeve, a professor of polar observation and modelling at University College London and senior research scientist at the NSIDC. She tells Carbon Brief:
“Profound ice loss is no longer limited to summer, but now extends across all seasons. These winter changes will help hasten the transition towards a seasonal ice-free Arctic.”
The chart below, made for Carbon Brief by Prof Ed Hawkins of the University of Reading, shows how the Arctic sea ice extent has declined over the satellite era. It shows that it is not just the annual maximum that is decreasing (pale blue line), but also the average for the whole month of March (bold blue line) when the peak usually occurs.
And although the decline for winter sea ice is not as steep as that for summer – shown by the bold red (September average) and the pale red (annual minimum) lines – there is still a prominent downward trend.
For example, NSIDC data shows average sea ice extents in January and February are declining at a rate of 3.3% and 3.1% per decade, respectively.
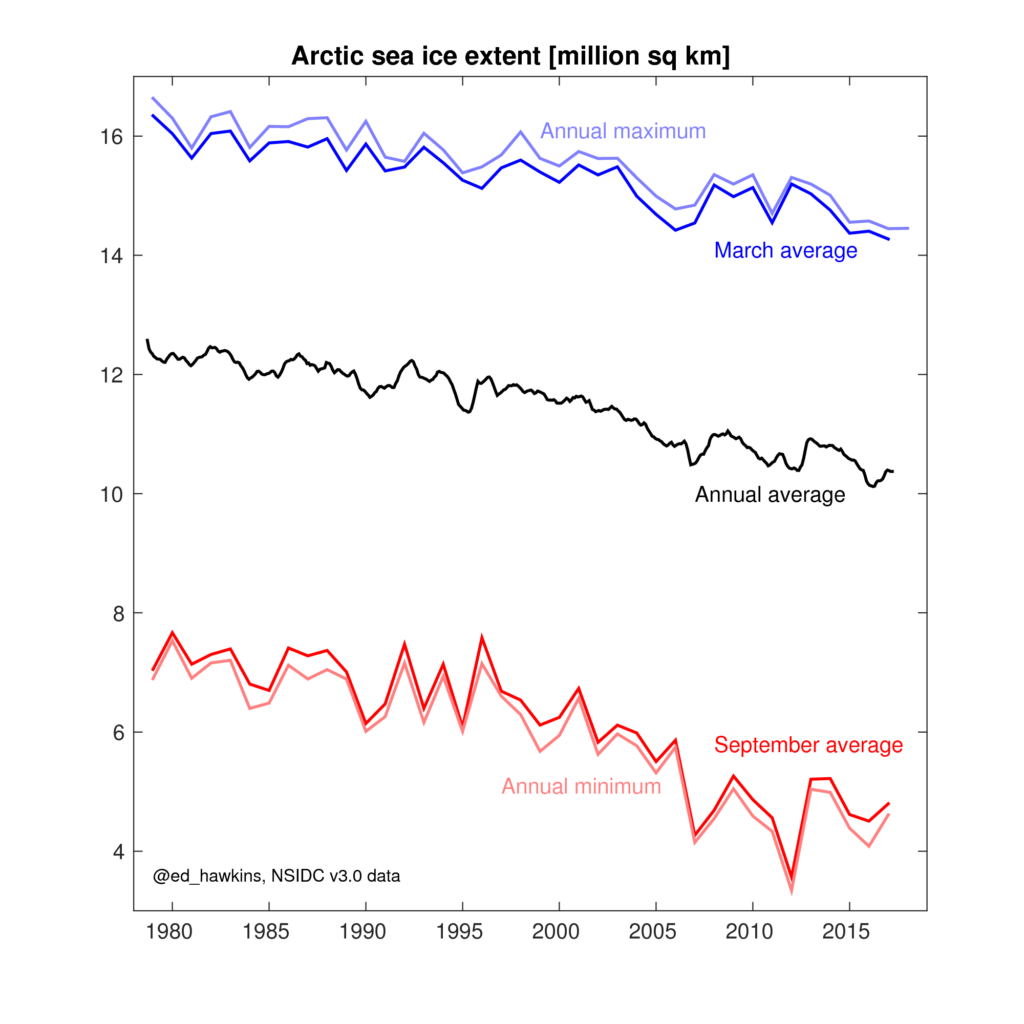
Average Arctic sea ice extent for March (bold blue line), the whole year (black), September (bold red) and the annual maximum (pale blue) and minimum (pale red). Data for 1979 to 2018 in million square kilometres. Credit: Prof Ed Hawkins
Antarctica
While the Arctic has been gaining ice over the cold, dark winter, Antarctic sea ice has been melting through the southern hemisphere summer.
Antarctic sea ice reached its summer minimum at the end of February, clocking in at 2.18m sq km. This is the second lowest minimum extent in the satellite record, 70,000 sq km larger than the record set in 2017.
The chart below shows how the 2017-18 summer (blue line) compares to previous years in the satellite record. The 2017-18 season was tracking in second place for most of the winter, apart from briefly in February where it dipped lower than 2016-17.
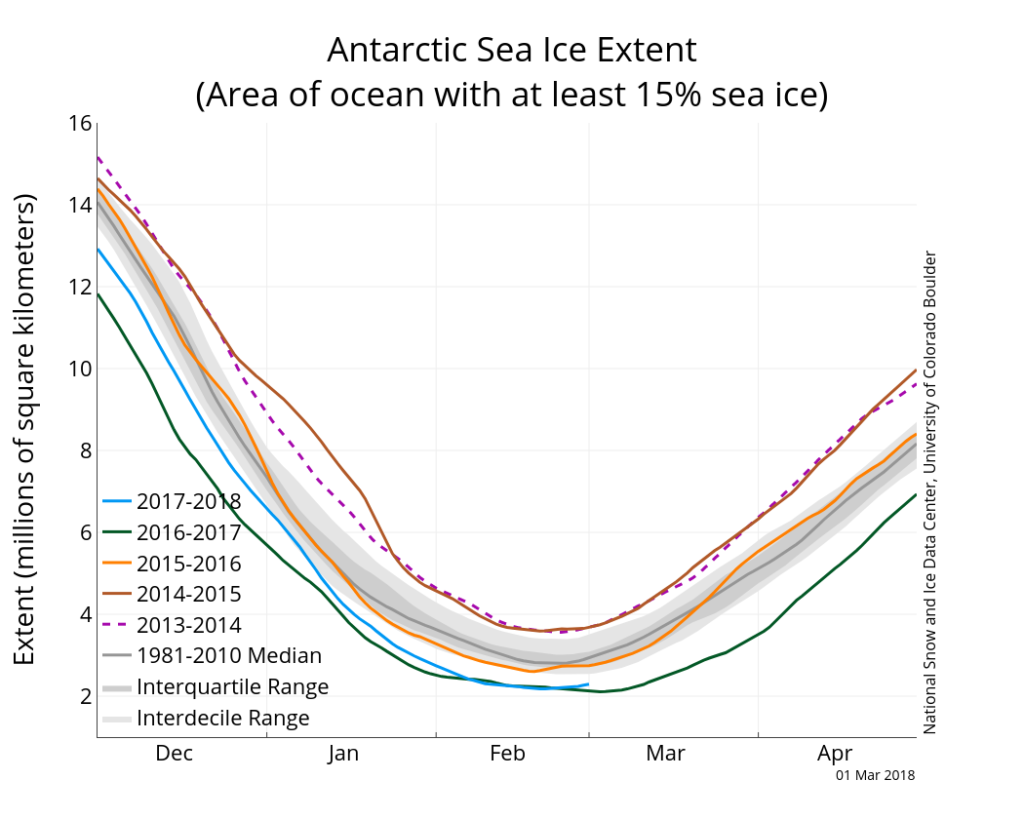
Antarctic sea ice extent as of 1 March 2018 for the 2017-18 summer (blue line), along with daily ice extent data for the four previous years: 2016-17 (green), 2015-16 (orange), 2014-15 (brown) and 2013-14 (purple). Also shown is 2011-2012 in dashed pink, the 1981-2010 median (dark grey) and the grey shading shows the range around the median. Credit: NSIDC
The 2017-18 melt season had begun low. Its starting point was the second lowest winter maximum on record in October. It “went downhill from there”, explains Dr Ted Scambos, senior research scientist at NSIDC and lead scientist for their science team. He tells Carbon Brief:
“A big factor in the rapid loss in November and December was the growth of a large area of open water within the pack, the Maud Rise Polynya. This is thought to be due to ocean upwelling driven by deep currents that pass over a large seamount [underwater mountain] in the Weddell Sea. This then was breached by the retreating ice edge.”
At the point of the minimum last month, “almost every area of the Antarctic coastal ocean had less sea ice than normal,” notes Sambos, “except for the western Weddell Sea – pressed against the eastern side of the Antarctic Peninsula – that was normal in extent and fearsomely well-packed.” The image gives a snapshot of Antarctica’s sea ice at the end of February.
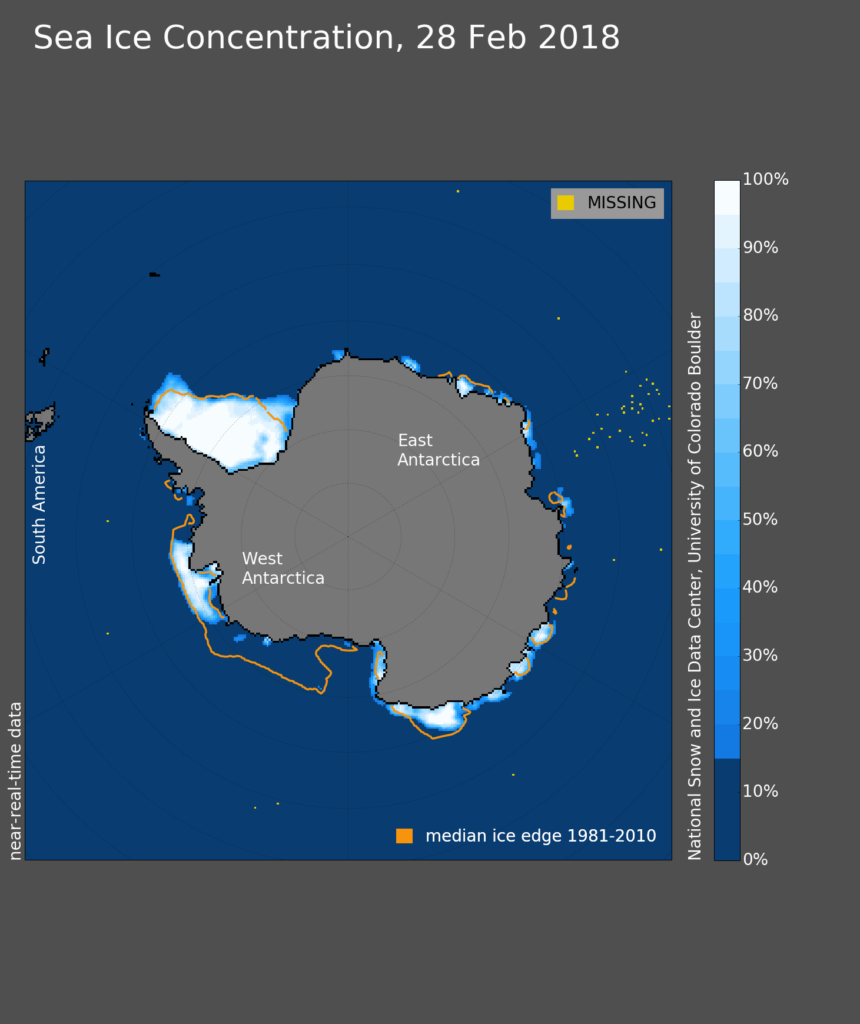
Antarctic sea ice extent for 28 February 2018. The orange line shows the median sea ice edge for 1981-2010. Credit: NSIDC
Antarctic sea ice extent has seen a huge amount of variability in recent years. This has taken scientists by surprise, says Scambos, as it follows several decades of relative stability that “appeared to show a slight upward trend in sea ice”. He explains:
“The past five years have seen both all-time high levels – in September 2014 – and astonishing record lows – in October/November of 2016. Moreover, a new look at early satellite data from the 1960s confirmed that the Antarctic sea ice system is far more sensitive to seasonal and inter-annual weather and climate differences than had been appreciated before.”
This variability means that recent changes to Antarctic sea ice “can’t really be said to be responding to the general global trend in temperature”, says Scambos – unlike sea ice in the Arctic.
While other data shows that “Antarctica’s climate and ocean are indeed changing”, it may take longer to be able draw robust conclusions about how sea ice will be affected by human-caused warming, says Scambos:
“It may require another decade or two still before we can say with confidence how Antarctica’s sea ice will respond [to climate change] – at least, if the basis is observations”.