Arctic sea ice summer minimum in 2017 is eighth lowest on record
Multiple Authors
09.20.17Multiple Authors
20.09.2017 | 12:14pmArctic sea ice has dwindled to its summer minimum for 2017, with its smallest extent for the year clocking in at 4.64m square kilometres (sq km) on 13 September.
At 1.58m sq km below the 1981-2010 average, this puts 2017 as the eight lowest summer minimum in the satellite record, according to preliminary figures from the US National Snow and Ice Data Centre (NSIDC). The record low remains 3.39m sq km, which was set in 2012.
Even though it wasn’t a record low, an NSIDC scientist tells Carbon Brief that the long-term downwards trend has continued with sea ice extent falling below 5m sq km again this year. This had never happened in the satellite record before 2007.
Pinpointing the minimum
Scientists have been tracking the daily changes in Arctic sea ice cover using satellites in a continuous record that stretches back to 1978-79. Notable events, such as the annual minimum and maximum extents, serve as an indicator of how the Arctic is changing as global temperatures rise.
Back in March, Arctic sea ice hit its lowest winter maximum on record for the third year in a row. Since then, Arctic sea ice has been on its annual decline through the melt season of spring and summer.
At the time of the record low winter peak, Carbon Brief asked some polar scientists to put the much-reported findings in context. You can watch the video of their responses here.
Scientists keep a close eye around the time the low is normally reached – usually early-to-mid september – then look for signs of ice accumulating again in order to pinpoint exactly when the summer minimum extent is reached.
This year, that minimum point was on 13 September, when Arctic sea ice extent declined to 4.64m sq km.
That means nine of the 10 lowest summer minima in the satellite record have occurred in the last 10 years, says Prof Julienne Stroeve, a professor of polar observation and modelling at University College London and senior research scientist at the NSIDC. She tells Carbon Brief:
“Even though we didn’t reach a new record low, the extent fell below 5m sq km, something which never happened before 2007.”
The chart below shows how the Arctic sea ice extent (sq km) has changed from May to September over the past five years. Years shown include 2017 (blue line), 2016 (green), 2015 (orange), 2014 (brown), 2013 (purple), and 2012 (dashed brown).
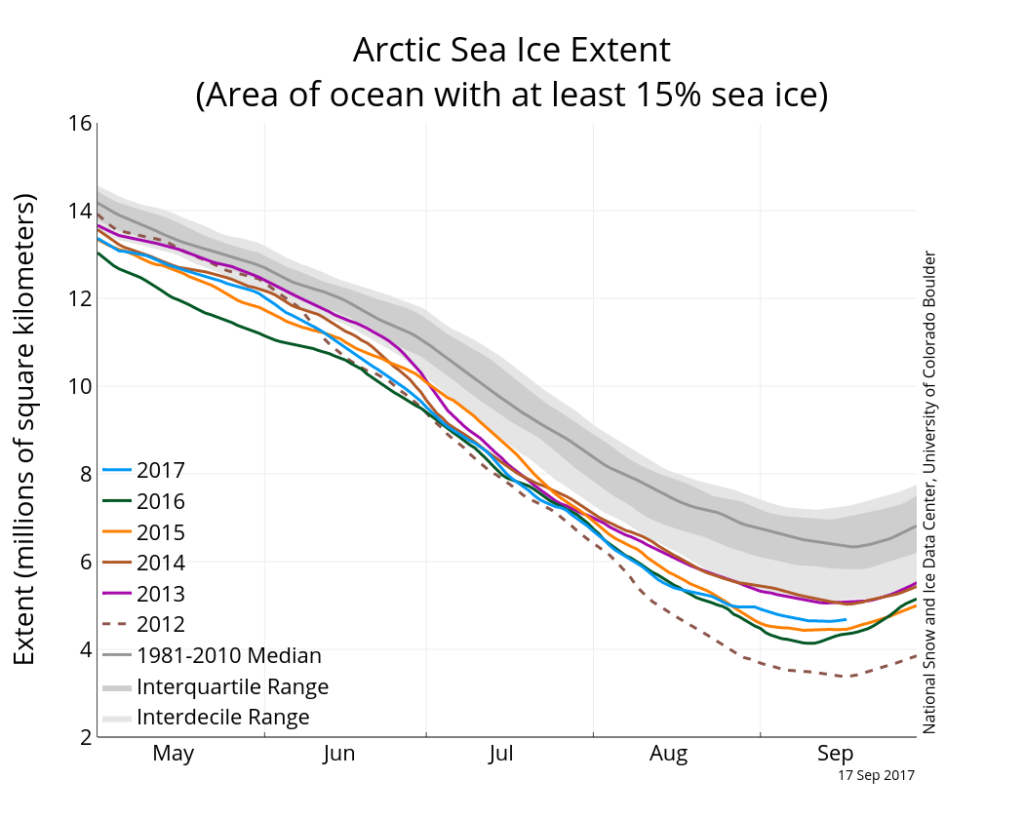
Arctic sea ice extent as of 17 September, 2017, along with daily ice extent data for five previous years. Years shown include 2017 (blue line), 2016 (green), 2015 (orange), 2014 (brown), 2013 (purple), and 2012 (dashed brown). The 1981-2010 median is in dark grey. The grey areas around the median line show the interquartile and interdecile ranges of the data. Credit: NSIDC
The map below shows the Arctic sea ice extent for 13 September alongside the 1981-2010 average extent for that day (orange line). The ice edge has continued to retreat in the Chukchi, East Siberian, and Kara Seas, but it has slightly expanded in the Beaufort and Laptev Seas.
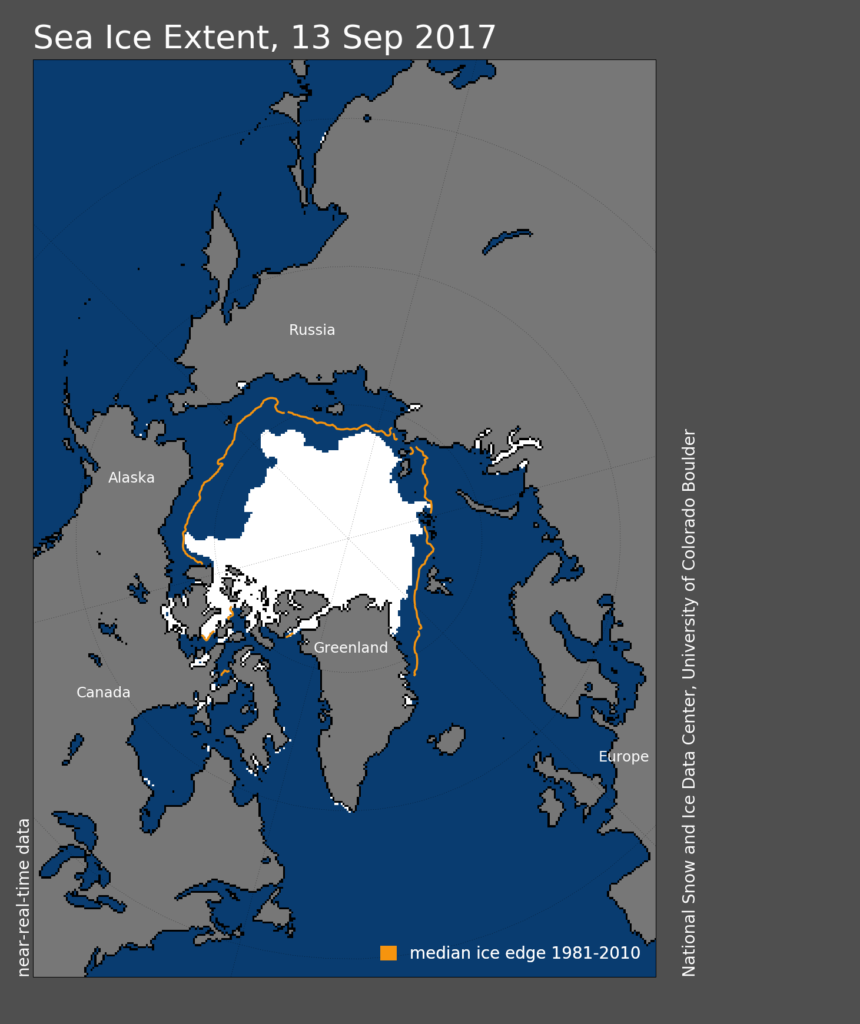
Arctic sea ice extent for 13 September, 2017. The orange line shows the 1981-2010 average extent for that day. Credit: NSIDC
Fluctuations and trends
After a series of record low months earlier in 2017, the summer melt season has been relative sluggish at times.
This year, summer temperatures in the Arctic have been relatively moderate for such high latitudes and have even been cooler than average in some parts.
This shows that even with a record low winter maximum in March, it doesn’t necessarily translate into very low summer extent as well. Short-term fluctuations in weather play a large role in changes from month to month, says Stroeve, on top of the long-term decline. She explains:
“I think this summer shows that despite preconditioning (thin ice, less extent), summer weather conditions largely govern how much ice will be left at the end of summer.”
It is for this reason that the size of the sea ice winter maximum is not necessarily a robust indicator of how the subsequent summer will play out, says Prof Ed Hawkins, professor of climate science at the University of Reading. He tells Carbon Brief:
“Changes in summer ice extent are dominated by the long-term downwards trend, but are also strongly influenced by the weather in each particular summer. There are large swings from year-to-year, rather like a ball bouncing down a bumpy hill.”
(You can read more about this “bouncing ball” analogy in Hawkins’ guest post for Carbon Brief from 2015.)
Although the annual minimum has become an iconic barometer of the decline in Arctic sea ice, it’s not the most reliable indicator of how Arctic sea ice is changing, says Hawkins:
“When looking across the seasons, the long-term trend becomes clearer. The lowest annual average ice extent was in 2016, even though the summer minimum was above the dramatic loss of 2012. For the January-August average, 2017 is the second lowest in the satellite era, after 2016.”
You can see this in the chart below, which shows average Arctic sea ice for various indicators over the satellite data record. The January-to-August average is the black line.
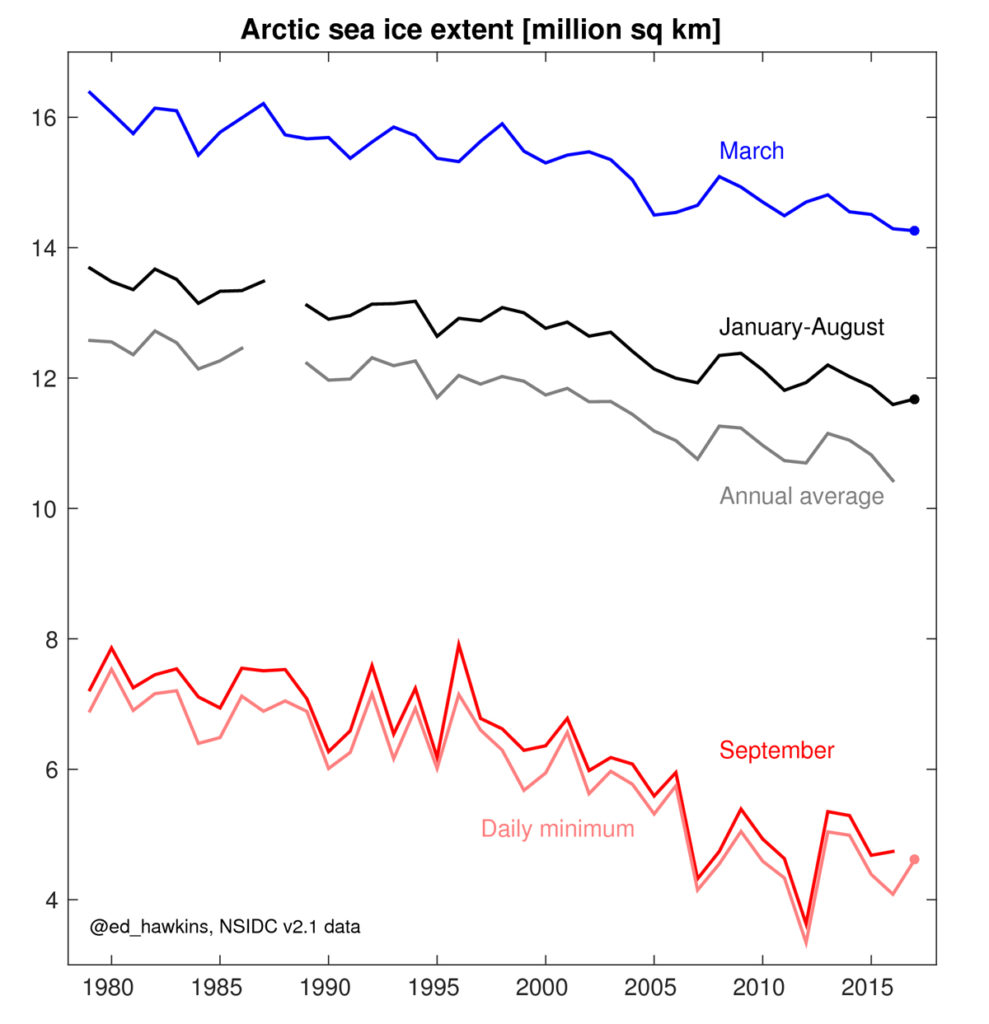
Average Arctic sea ice extent for March (blue line), January-August (black), the whole year (grey), September (bold red) and the annual minimum (pale red). Data for 1979 to 2017 in million square kilometres. Credit: Ed Hawkins
The downward trends for September (thick red line) and the summer minimum (thin red line) are quite erratic from one year to the next. In contrast, the trend for March (blue line) shows a smoother decline because the influence of the weather on Arctic sea ice during winter is smaller.
This highlights the need to not over-emphasise the ice extent on a particular day or in a particular month, notes Hawkins:
“Instead, the focus should be on the bigger picture: Arctic sea ice is melting and will continue to do so whilst global temperatures continue to rise.”
Ice elsewhere
At the opposite end of the planet, Antarctica is heading to its maximum yearly sea ice extent, which normally occurs in September or early October. This year’s maximum ice cover is also likely to be among the eight lowest on record.
The map below shows the Antarctic sea ice extent from June to 17 September 2017 (blue line), along with daily ice extent data for four previous years. Years shown include 2016 (green), 2015 (orange), 2014 (dashed brown), and 2013 (purple).
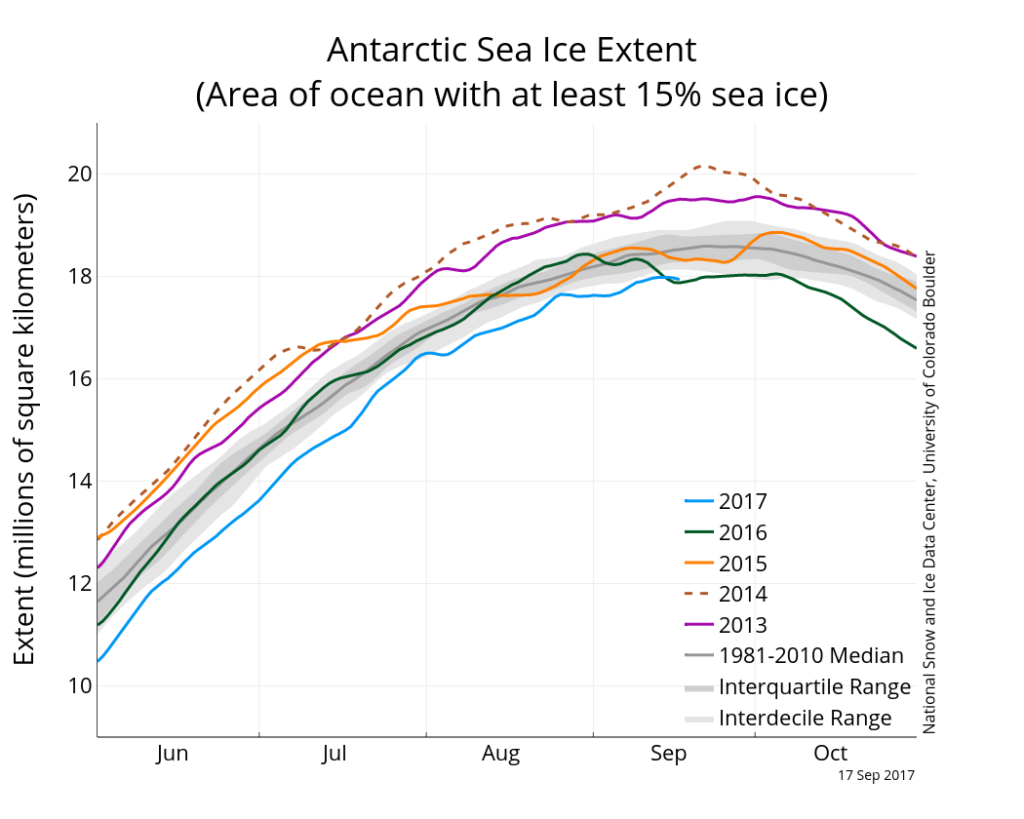
Antarctic sea ice extent as of 17 September, 2017, along with daily ice extent data for four previous years. Years shown include 2017 (blue line), 2016 (green), 2015 (orange), 2014 (dashed brown), and 2013 (purple). The 1981-2010 median is in dark grey. The grey areas around the median line show the interquartile and interdecile ranges of the data. Credit: NSIDC
Antarctic sea ice also hit a record low earlier this year.
And elsewhere in the Arctic, the annual melt season for the Greenland ice sheet also recently came to a close. Carbon Brief has a guest post from scientist the Danish Meteorological Institute on how the ice sheet has fared over the past 12 months.