Arctic sea ice winter peak in 2019 is seventh lowest on record
Arctic sea ice has reached its maximum extent for the year, peaking at 14.78m square kilometres (sq km) on 13 March. It is the joint seventh smallest winter maximum in the 40-year satellite record – tied with 2007.
The preliminary estimate from the National Snow and Ice Data Center (NSIDC) in Boulder, Colorado, suggests this year’s winter peak is the largest since 2014. But is still 860,000 sq km smaller than the 1981-2010 average.
The “most remarkable” feature of Arctic sea ice this winter has been the very low cover in the Bering Sea, the NSIDC says. Following similar lows there in 2018, this is “unprecedented in at least the satellite era”, one scientist tells Carbon Brief, and has “had significant impacts to coastal communities and marine ecosystems”.
Meanwhile, in Antarctica, sea ice has already reached its minimum extent following the summer melt season. Provisional data suggests that sea ice reached 2.47m sq km on both 28 February and 1 March, putting it seventh in the list of lowest summer minima on record.
Winter ends
As winter turns into spring in the northern hemisphere, Arctic sea ice stops growing and reaches its peak extent for the year. This marks the end of the half-year ice growth season that started with the sea ice minimum – the sixth lowest on record – in September last year.
Scientists use satellites to monitor sea ice extent, recording the size and date of the annual maximum when it peaks each year. Along with the summer minimum, it is one of the key metrics for tracking the “health” of the Arctic’s sea ice.
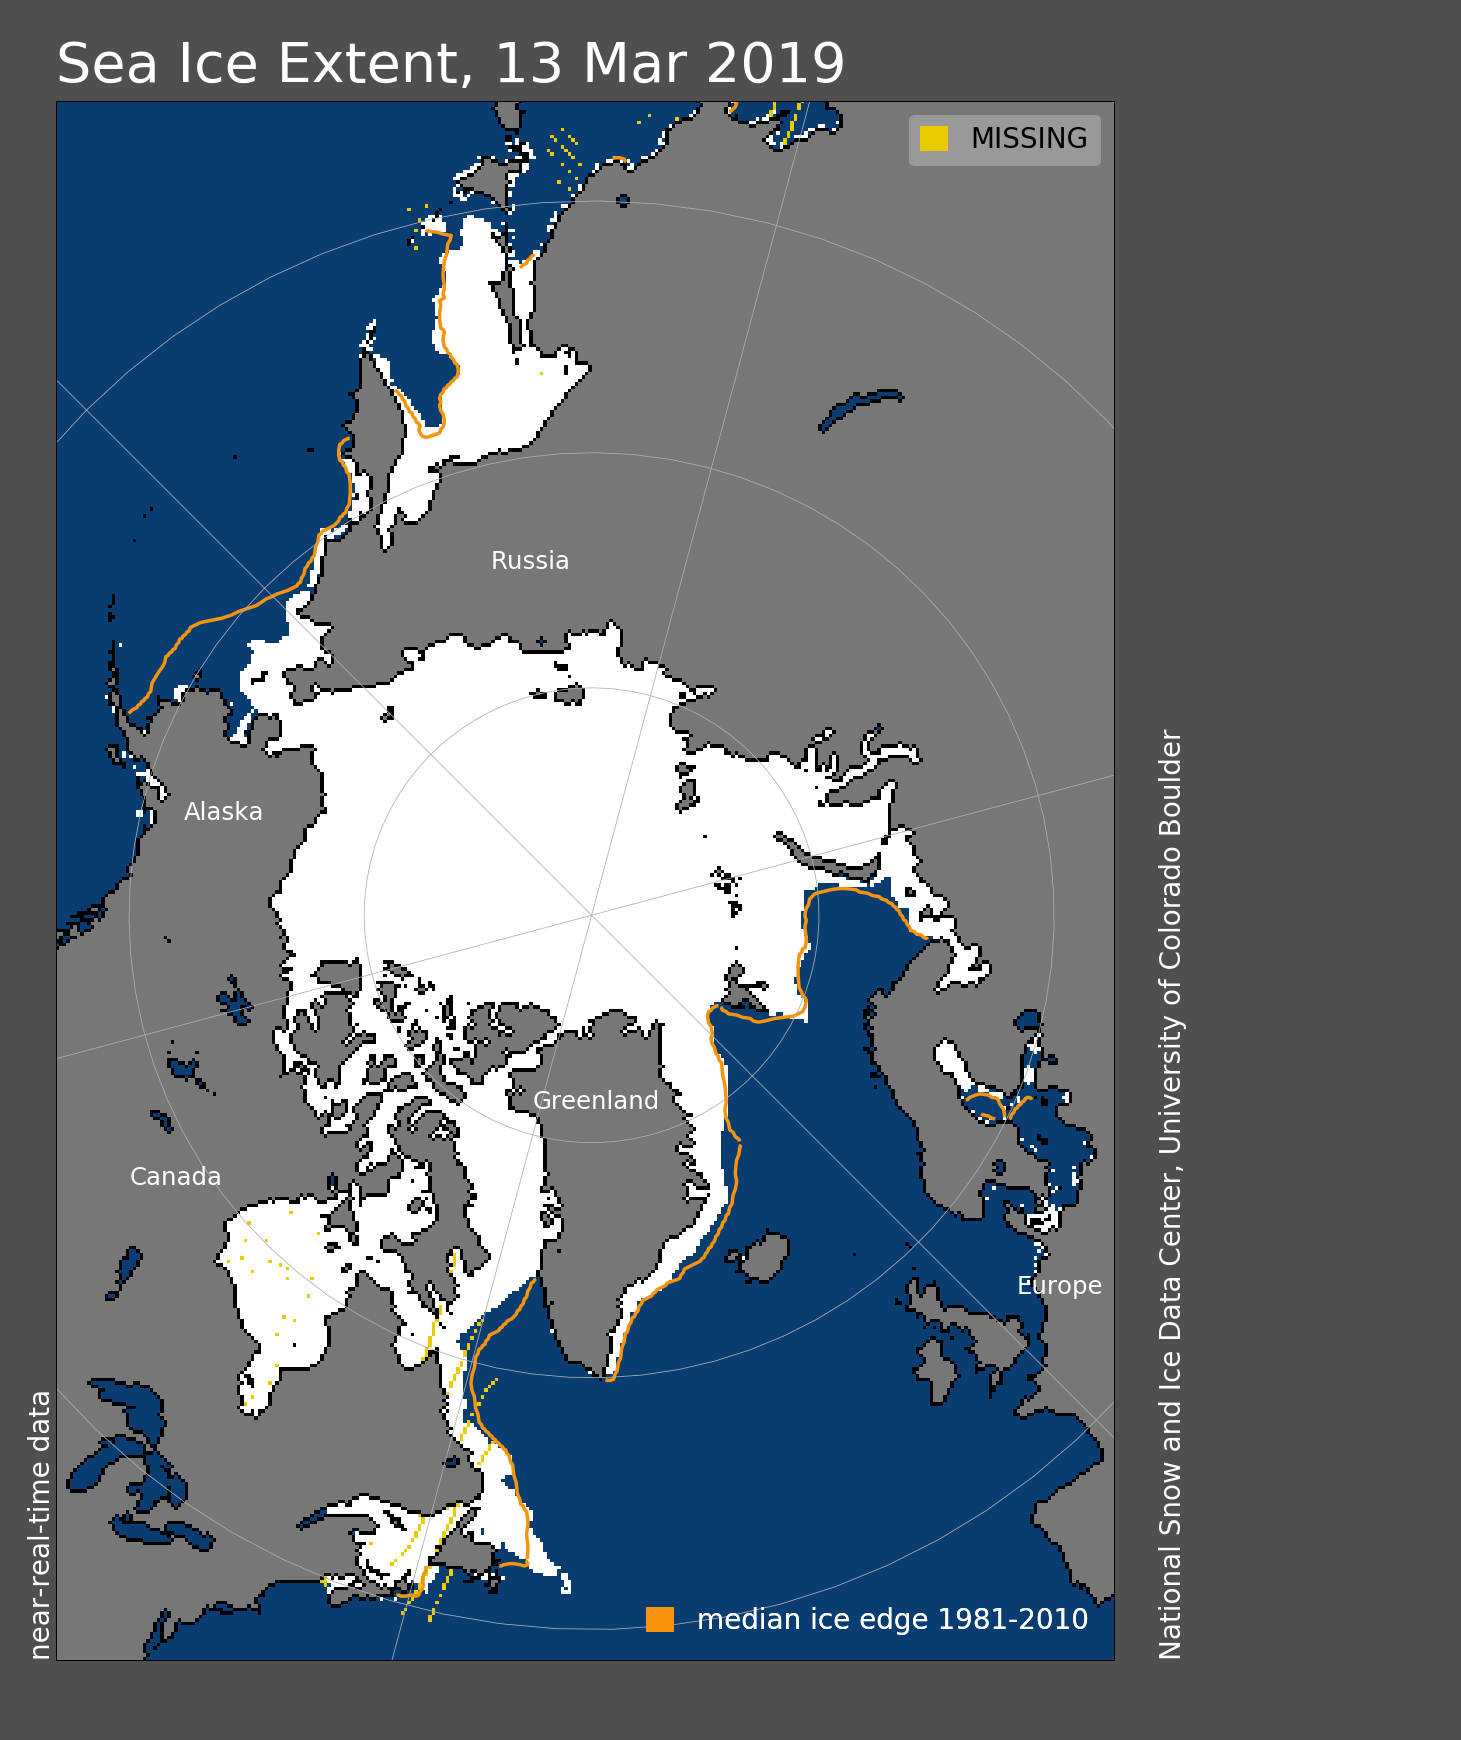
The winter peak extent for 2019 is estimated at 14.78m sq km, the NSIDC says. It was recorded on the 13 March – just one day out from the median winter maximum date of 12 March in the 1981-2010 average.
It sits alongside 2007 as the seventh smallest winter peak on record, says the NSIDC. The four smallest in the satellite era occurred between 2015 and 2018.
The map below shows Arctic sea ice on the day of this year’s peak. The orange line shows the average position on that day for the long-term average.
‘New normal’
This year’s winter peak is “quite a bit less anomalous than the last few years”, says Zack Labe, a University of California, Irvine PhD student studying sea ice. Last year’s, for example, was the second lowest on record, Labe explains:
“This is not entirely surprising, since natural variability plays a very important role in modulating year-to-year sea ice. We do not expect every year to be a new record low, although this year’s maximum is still in the top 10 lowest on record.”
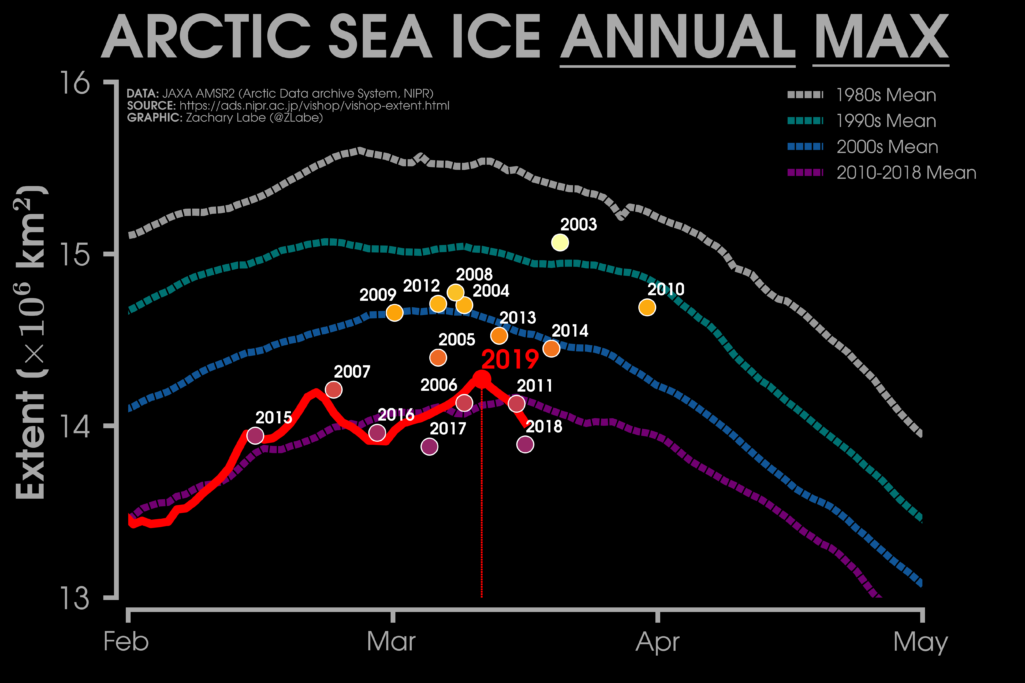
The chart below – produced by Labe – shows how the Arctic sea ice winter maximum has declined since the satellite era began in the late 1970s. The red line shows how 2019 compares to the average for each decade. The chart illustrates that the 2019 peak would have been more typical of the ice extent in May during the 1980s. (Note: this chart plots an estimated winter peak for 2019 using data from the Japan Aerospace Exploration Agency, which has not yet officially called this year’s maximum.)
Unlike the last few winters, “there were no extreme Arctic warming events” transferring heat from the North Atlantic towards the Arctic, notes Labe:
“In fact, below average temperatures and northerly winds helped to extend sea ice in the Barents Sea around Svalbard. On the other hand, sea ice reached a remarkably low extent in the Bering Sea with open water even through the Bering Strait.”
That sea ice in the Barents Sea is back to near-average conditions this year is “especially interesting”, says Prof Julienne Stroeve, a professor of polar observation and modelling at University College London and senior research scientist at the NSIDC. In recent years “the ice edge was much further north”, she tells Carbon Brief. Low sea ice cover has been linked to the “Atlanticification” of this sea as it shifts from being dominated by cold, fresh Arctic waters to a warm, salty Atlantic regime.
The declining condition of winter sea ice over the past four decades has a knock-on effect in the summer too, says Dr Ron Kwok, a senior research scientist at Nasa’s Jet Propulsion Laboratory at the California Institute of Technology. He tells Carbon Brief:
“The replacement of large fractions of the Arctic Ocean with seasonal ice is a large factor in this behaviour [the high year-to-year variability] – the ‘new normal’ – because the seasonal ice grows faster but not enough to survive the summer.”
Bering Sea
In what the NSIDC described as a rather “ho hum” February, the most “remarkable” aspect of sea ice changes in recent weeks has been the “very low” extent in the Bering Sea after “unusual ice loss throughout the month”.
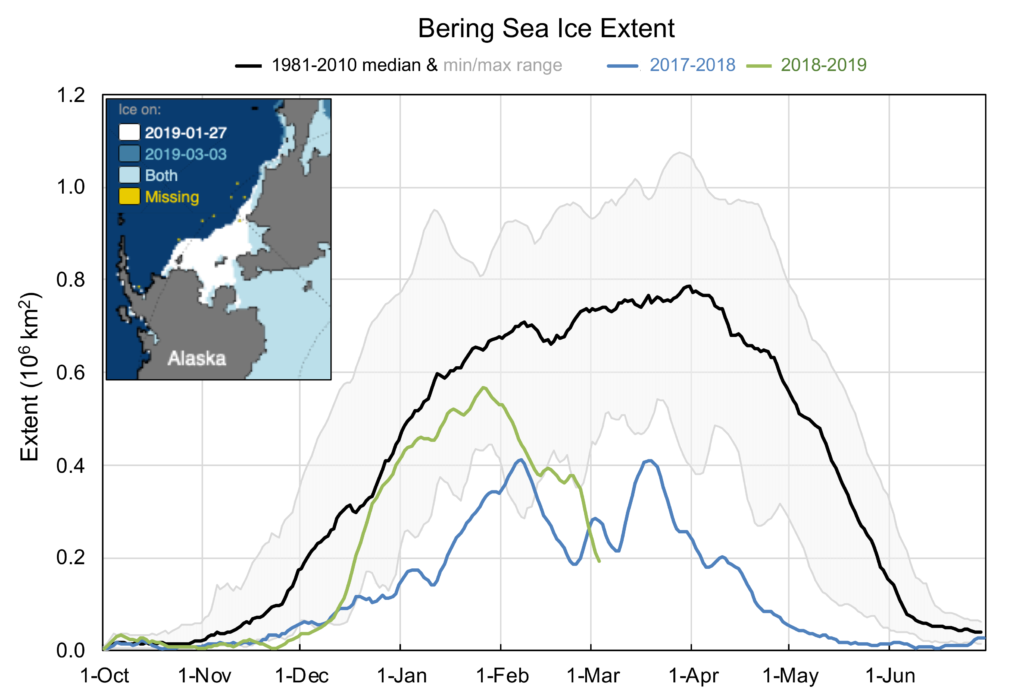
Sea ice extent in the Bering Sea typically increases until March or early April, the NSIDC says, but “this year is quite extreme” as sea ice extent decreased by around half a million square kilometres between 27 January and 3 March. This is an area of ice approximately the size of Montana, the NSIDC adds. [Montana is larger than Germany or Japan.]
The chart below shows the rapid decline in Bering Sea ice during early 2019 (green line) as well as the similar lows in ice cover during 2018-19 (blue), and the long-term average (black).
Other than last year, “these conditions are unprecedented in at least the satellite era”, says Labe. The low sea ice levels in the Bering Sea “occurred due to relentless southerly winds and storms that helped to push the sea ice poleward”, he explains:
“Above average ocean temperatures in the far North Pacific may have also played a role. Air temperatures this winter were well above average on the Pacific side of the Arctic in response to these strong southerly winds through the Bering Strait.”
It is particularly unusual to have open water through the Bering Strait – the stretch of water that separates Alaska and Russia – notes Labe. “This record low sea ice has had significant impacts to coastal communities and marine ecosystems,” he adds.
Historical reconstruction of western Alaska sea ice (Bering Sea) shows February 2019’s sea ice extent was the 2nd lowest on record (after 2018) since at least 1850
Data is assembled from recent satellite data, whaler’s logs, ship records, etc. More info: https://t.co/fDS93o8ZtH pic.twitter.com/k0X01sJ6La
— Zack Labe (@ZLabe) March 19, 2019
News outlets in recent weeks have reported on how the lack of ice has disrupted hunting and fishing. It has also affected the “Iditarod” – a famous dogsled race across 1,000 miles of Alaska – where competitors have been instructed to follow the trail overland rather than cross the unstable sea ice.
Open water also leaves coastal communities exposed to the threat of flooding from storm surges. Similarly low sea ice conditions last year contributed to flooding in villages on the west coast of Alaska.
The lack of ice also has knock-on impacts for marine life. Without sea ice cover, the Bering Sea will be much warmer than usual by the summer. A “cold pool” of water in the Bering Sea typically acts as a barrier between northern and southern Bering Sea marine species. This was “considered a biological fixture until last year, when it failed to develop”, reports Arctic Today.
Antarctica
Since Antarctica’s sea ice hit its winter maximum extent on 2 October last year – the fourth lowest on record – it has been dwindling through its annual melt season.
Despite a slower-than-average decline during November, Antarctic sea ice melt accelerated in December, spurred on by “unusual atmospheric conditions and high sea surface temperatures”, according to the NSIDC. By the start of 2019, Antarctic sea ice had experienced several days of record lows for that time of year.
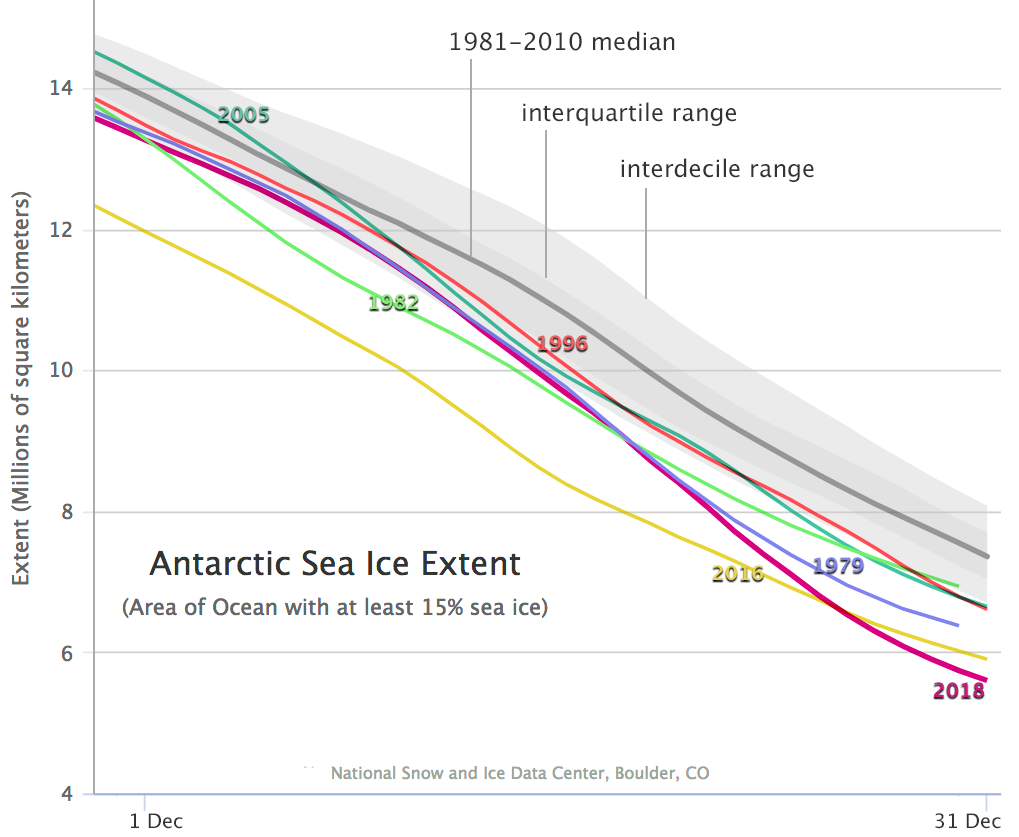
This dramatic decline is shown by the pink line in the chart below, which shows daily Antarctic sea ice extent for December for the six years of lowest December extents on record (different coloured lines), as well as the long-term average in grey.
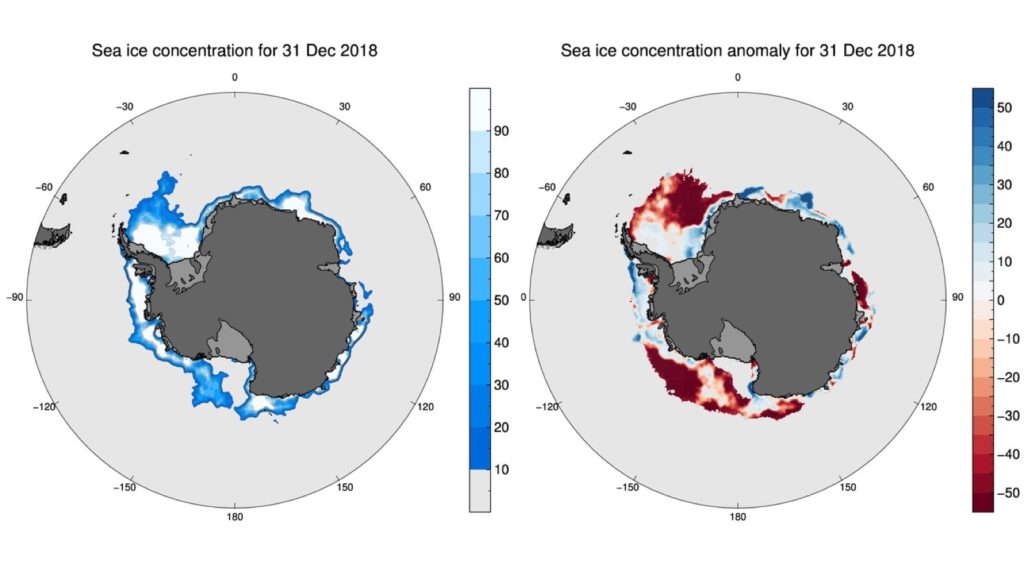
The rapid ice loss in December 2018 “exposed large areas of the Southern Ocean that are typically ice-covered at this time of year”, says the NSIDC.
The maps show absolute sea ice concentration (left) and relative to the long-term average (right) for 31 December 2018. The reds in the right-hand map shows below-average concentrations of ice in the Weddell Sea, Ross Sea, and either side of the Amery ice shelf in East Antarctica.
Ice melt then “slowed significantly”, explains the NSIDC, with January average sea ice dropping to the third smallest on record. By this point, ice melt was slower than average for the time of year.
The provisional estimate from NSIDC suggests that Antarctic sea ice hit its lowest extent for the year on both the 28 February and 1 March. Clocking in at 2.47m sq km, the minimum extent for 2019 is the seventh lowest on record.
Sea ice extent “has been particularly low in the central and eastern Weddell Sea and in the eastern Ross Sea”, notes the NSIDC, but “above average ice extent remains along the East Antarctic coastline and the Bellingshausen Sea”.