
Atlantic ‘conveyor belt’ has slowed by 15% since mid-20th century
Robert McSweeney
04.11.18Robert McSweeney
11.04.2018 | 6:00pmThe Atlantic Ocean current that brings warm water up to Europe from the tropics has weakened by 15% since the middle of the last century, new research suggests.
Two studies, published in the journal Nature, use different approaches to show that the “Atlantic Meridional Overturning Circulation” (AMOC) is in a weaker state now than it has been for decades – and possibly even centuries.
The two studies differ on when and how they think the weakening was triggered. While one suggests it began in the mid-20th century as a response to human-caused climate change, the second proposes that it began a hundred years earlier following a natural shift in regional climate.
Despite the debate on when the weakening started, the studies agree that there has been a “continued decline in AMOC over the 20th century that may be attributed to recent global warming and melting of the Greenland ice sheet”, one author tells Carbon Brief.
Overturning
The Atlantic Ocean plays host to a perpetual conveyor belt that transports heat from the equator up to the North Atlantic.
The graphic below shows the two main features of the AMOC: the first is the flow of warm, salty water in the upper layers of the ocean northwards from the Gulf of Mexico (red line). This is made up of the “Gulf Stream” to the south and the “North Atlantic Current” further north. The second is the cooling of water in the high latitudes of the Atlantic, which makes it more dense. This denser water then sinks and returns southwards towards the equator at much deeper depths (blue line).
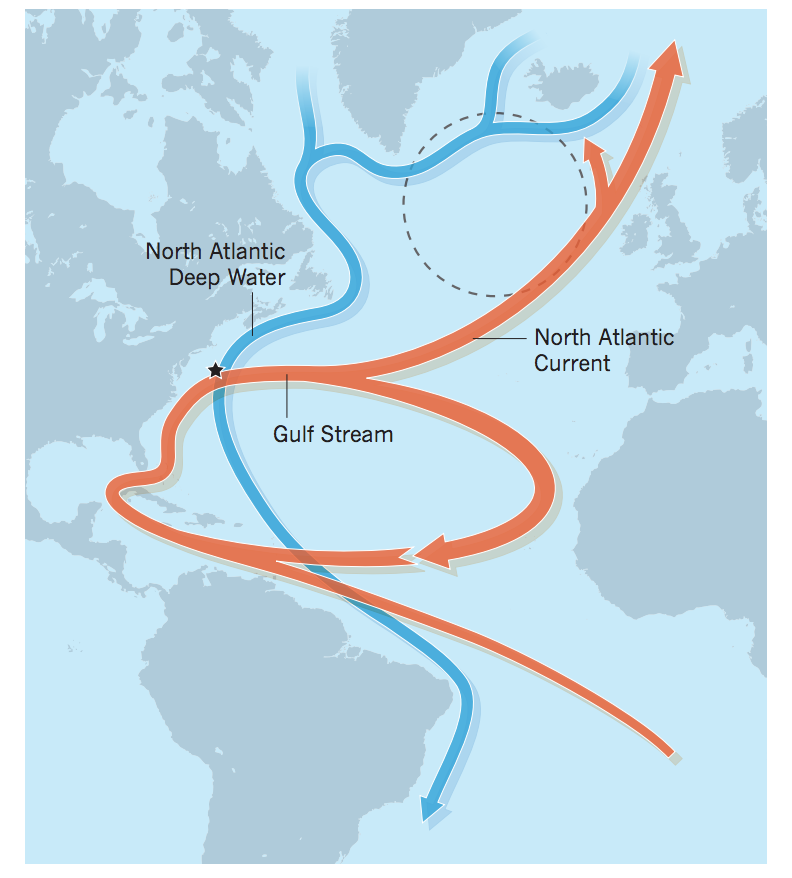
The Atlantic Meridional Overturning Circulation. Source: Praetorius (2018)
The AMOC forms part of a wider network of global ocean circulations patterns that transports heat all around the world.
The warm water that the AMOC carries northwards releases heat into the atmosphere, which means it plays a crucial role in keeping Western Europe warm. Without it, for example, winters in the UK would be around 5C colder. Any changes to the AMOC could have serious implications for Europe’s weather and a knock-on effect on global climate.
One of the difficulties in identifying changes in the AMOC is that it has only been monitored directly and continuously since 2004. The two studies, therefore, use alternative sources of data to assess the AMOC over longer periods.
The first Nature study identifies a “fingerprint” of a changing AMOC. This fingerprint has two components: relatively cool sea surface temperatures (SSTs) in the North Atlantic to the south and east of Greenland, and a region of particularly strong ocean warming along the US East Coast.
The patch of cool SSTs in the North Atlantic has generated a lot of scientific and media attention in recent years – even receiving its own nickname, the “cold blob”.
The pattern is, perhaps, illustrated most clearly by the map below of average land and ocean temperatures in 2015. The blue patch to the south of Greenland is the “cold blob”, while the red shading along the US East Coast shows record warm SSTs.
Blended land and sea surface temperature percentiles for January to December 2015. Shading indicates warmer (red) and cooler (blue) than average conditions. Source: NOAA
This pattern of changes is exactly what climate model simulations project will happen as the AMOC slows down, says lead author Levke Caesar from the Potsdam Institute for Climate Impact Research. She explains to Carbon Brief:
“Due to its role as a heat carrier, if the AMOC slows down then the northward heat transport is reduced and that leads to a cooling in the subpolar North Atlantic. Due to a more complex interaction between the southward deep water flow of the AMOC with the bottom topography of the ocean, a reduced AMOC is also associated with a northward shift of the Gulf Stream which then leads to the warming east of the US coast.”
Using seven different datasets of SSTs, the researchers find they all show “the cold patch in the subpolar Atlantic, and, to a greater or lesser extent, the enhanced warmings inshore of the Gulf Stream”. The team then used models to confirm that the AMOC was the principal cause behind this pattern of SSTs.
Slowdown
As SSTs in the Atlantic Ocean have been measured directly for many years, the researchers were able to construct a record of long-term changes in the AMOC from 1870 to 2016 based on the “fingerprint” they identified.
This is shown in the graph below, which charts SSTs in the North Atlantic (blue line) and along the US East Coast (red). The map on the right shows these specific locations.
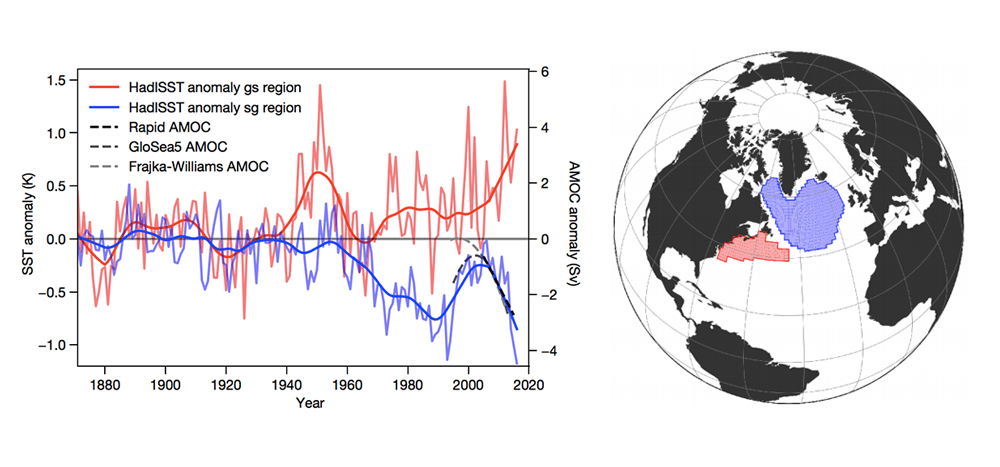
SSTs for the “Gulf Stream” region off the US East Coast (red line) and the “subpolar gyre” region in the North Atlantic (red). The two regions are shown by the shaded areas (in corresponding colours) in the globe to the left. The chart also shows three sources of data on the AMOC: in situ monitoring by the RAPID project, an ocean reanalysis product (GloSea522) and a reconstruction from satellite data and cable measurements. Source: Caesar et al. (2018)
The chart highlights the divergence in temperature between the North Atlantic and US East Coast in recent decades. The implication of this is that the AMOC has weakened by approximately 15% since 1950 – that’s around three million cubic metres less water being shifted per second.
A weaker AMOC means a slowdown in the conveyor belt effect in the North Atlantic that pulls warm water up towards Europe.
This finding is consistent with direct measurements of the AMOC by the RAPID project – a collection of instruments tethered to the seafloor across the Atlantic Ocean that monitors temperature, salinity and current speed at different depths.
The bold black dashed line in the chart above shows the recorded decline in strength of the AMOC since the RAPID project began in 2004.
Human influence
It is “very likely” that most of the slowdown in the AMOC is a result of human-caused warming, says Caesar. There are two reasons behind this, she explains:
“First, it is a feature that has long been predicted by climate models in response to global warming. Second, while short-term ups and downs in the AMOC over a decade or two can be caused by internal variability, the long-term downward trend we see since the mid-20th century is unprecedented for well over a thousand years.”
So, how does a warming climate weaken the AMOC? It comes down to the influx of freshwater into the North Atlantic, says Caesar:
“Global warming causes changes to the hydrological cycle leading to increased precipitation over the subpolar North Atlantic and surrounding land areas – from where the water drains through rivers into the Atlantic. It further contributes to the loss of Arctic sea ice, as well as melting of the Greenland Ice Sheet, both adding more freshwater to the ocean.”
This extra freshwater reduces the sinking of the cooling seawater. Less sinking in the North Atlantic means a reduction in how much warm water is dragged up from the tropics, weakening the circulation.
Trail of evidence
The second study, also published in Nature, comes to a similar conclusion on the current state of the AMOC, but offers a different theory on when the weakening began.
As with the first study, it uses an indirect method of analysing how the AMOC has changed, but it goes back over 1,500 years, rather than 150. The researchers reconstructed their AMOC record using sediment cores drilled from the seafloor off the US East Coast and in the Labrador Sea, between Canada and Greenland.
The size of the sediment grains indicates how fast deep-ocean currents were flowing through the Atlantic Ocean in the past. The larger the grains, the stronger the current, and vice versa.
The findings indicate the AMOC has been “weaker during the past 150 years than at any other time during the past 1,600 years”, the paper says. This is in agreement with the first study, says lead author Dr David Thornalley, a senior lecturer at University College London. He tells Carbon Brief:
“The big picture finding…is that several different lines of evidence are in agreement that AMOC has weakened substantially over the past 150 years.”
But where the second study differs is that it suggests the weakening began before the massive acceleration in global CO2 emissions in the 20th century. Instead, it implicates the influx of freshwater as the northern hemisphere exited the Little Ice Age in the mid-19th century. Thornalley explains:
“We propose that the weakening of AMOC was caused by the release of freshwater from the Arctic and Nordic Seas, caused by melting of thick sea ice, extended glaciers and ice shelves that had built up during the preceding Little Ice Age.”
During the Little Ice Age, parts of the northern hemisphere cooled by as much as 2C as a result of low solar activity, intense volcanic activity and interactions between sea ice and ocean currents.
Although the two studies may differ on when the AMOC weakening began, they agree that it has likely been sustained or enhanced through more recent human-caused changes, such as melting of the Greenland Ice Sheet, notes Thornalley:
“That an earlier, mainly natural-induced weakening of AMOC occurred should not detract from a similar and, potentially, much more severe AMOC weakening being caused by humans; it reinforces the concept that warming and melting can cause AMOC weakening.”
Impacts on weather
It is reassuring that the two studies “converge on the conclusion that the modern AMOC is in a relatively weak state”, writes Dr Summer Praetorius, a research geologist at the US Geological Survey, in an accompanying News & Views article in Nature.
However, “it is perhaps less reassuring, because a weakened AMOC might lead to considerable changes in climate and precipitation patterns throughout the northern hemisphere”.
In fact, the weakening of the AMOC may already be having an impact on weather in Europe, says Caesar.
“One example is that cold sea surface temperatures in the subpolar Atlantic correlate with high summer temperatures over Europe, and the 2015 European heatwave has been linked to the record-cold temperatures in the subpolar North Atlantic that year.”
A weaker AMOC has also been linked to higher regional sea levels along the US East Coast and projections of drought increases in the Sahel, Caesar adds.
Given the importance of the AMOC and that continued global warming is likely to weaken it further in the long term, the new research “makes the case for continued investment in monitoring and understanding the AMOC”, says Thornalley:
“Extended observational data, and reconstructions of climate in the past, will also allow us to better test ideas regarding the links between weather and climate phenomena, and the AMOC, and to assess and improve climate models.”
A longer record of direct measurements is also crucial to drawing conclusions about the behaviour of the AMOC, notes Prof Meric Srokosz, professor of physical oceanography at the National Oceanography Centre in Southampton and science coordinator of the RAPID project.
While both of the Nature studies are “interesting”, Srokosz tells Carbon Brief, scientists should be cautious in interpreting the results as they rely on indirect data and model simulations:
“Essentially, what view you take of the results depends on how good you believe the models used are and, likewise, how well the chosen proxies represent the AMOC over the timescales of interest.”
Caesar, L. et al. (2018) Observed fingerprint of a weakening Atlantic Ocean overturning circulation, Nature, doi:10.1038/s41586-018-0006-5
Thornalley, D. J. R. (2018) Anomalously weak Labrador Sea convection and Atlantic overturning during the past 150 years, Nature, doi:10.1038/s41586-018-0007-4
Praetorius, S. K. (2018) North Atlantic circulation slows down, Nature, doi:10.1038/s41586-018-0006-5
-
Atlantic ‘conveyor belt’ has slowed by 15% since mid-20th century
-
Atlantic ‘conveyor belt’ is in a weaker state than at any time during the past 1,600 years