Coral reef survival hinges on ‘urgent and rapid’ emissions cuts
Robert McSweeney
03.15.17Robert McSweeney
15.03.2017 | 6:00pmThe future of the Great Barrier Reef – and other reefs around the world – will ultimately depend on how successfully we can limit ocean warming.
This is the blunt conclusion of a new study, just published in Nature, which examines the impacts of recent coral bleaching events on Australia’s Great Barrier Reef. The event in 2016, for example, left just 9% of surveyed reefs untouched.
The study finds that sea surface temperature is the biggest driver of bleaching, while local efforts to improve water quality or restrict fishing have little impact on limiting its severity.
This means that “immediate action to curb future warming” is essential if coral reefs are to survive, the authors warn.
Mass coral bleaching
In the last two decades, the Great Barrier Reef has seen three mass coral bleaching events – in 1998, 2002 and 2016. Early reports suggest that a fourth event is already underway in 2017.
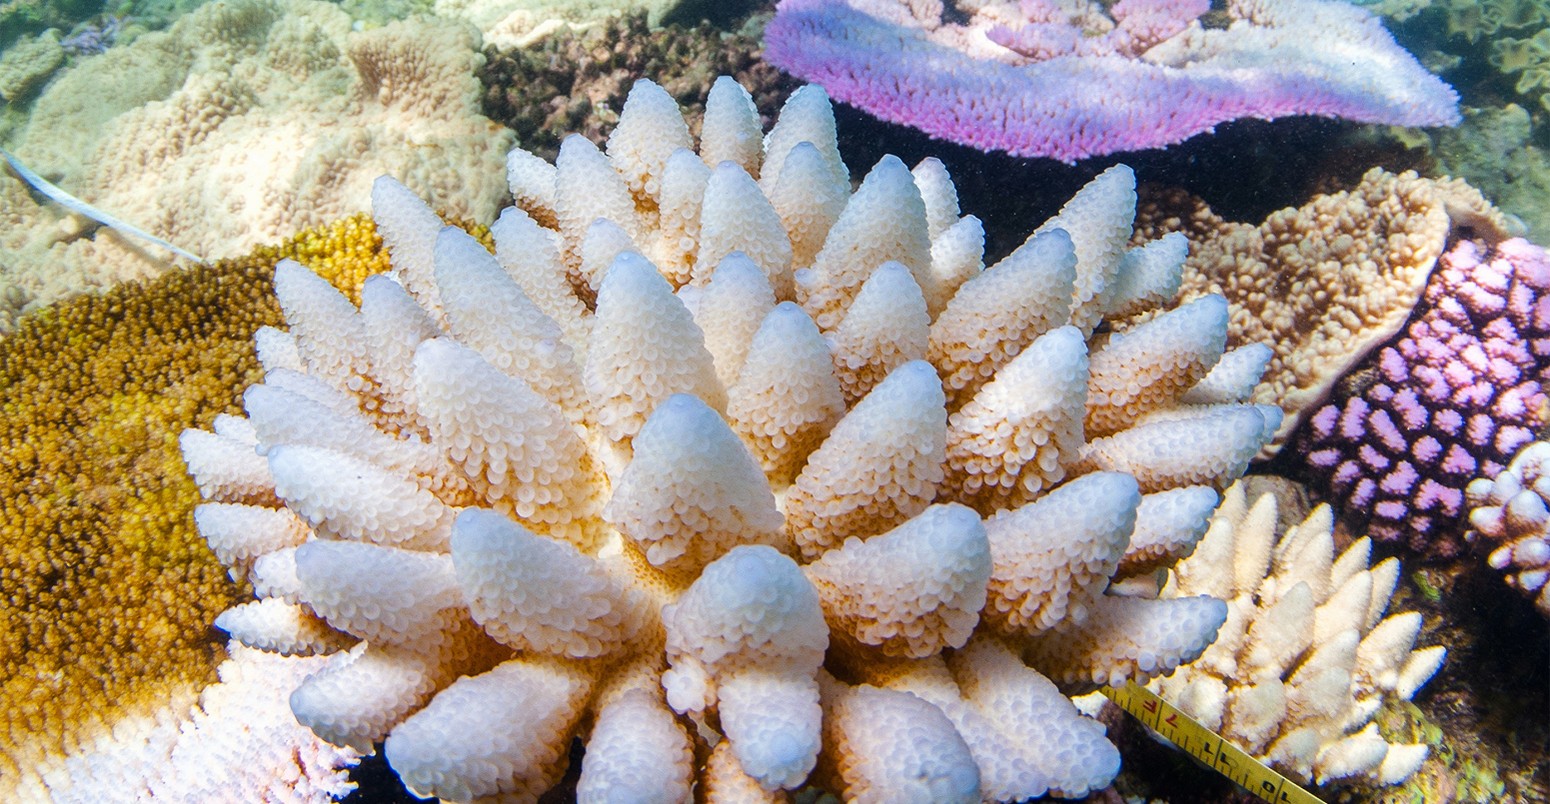
Bleaching is primarily caused by prolonged exposure to high sea surface temperatures (SSTs). Under continued heat stress, the corals expel the tiny colourful algae living in their tissues – known as zooxanthellae – leaving behind a stark white skeleton.
The algae provide the corals with energy through photosynthesis. Without them, the corals starve. Although corals can recover from a bleaching event, persistently bleaching can kill off entire reefs.
The pattern of bleaching across the Great Barrier Reef “varied markedly” during the three events, the new study says. Using aerial surveys of hundreds of coral colonies across the reef and SST data derived from satellites, the researchers set out to work out why.
‘Extensive and severe’
The maps below show how the patterns of bleaching over the Great Barrier Reef differed during the three events. The shading indicates the severity of bleaching, from less than 1% of corals affected (dark green) to more than 60% (red).
In 1998, bleaching was mainly along central and southern coastal areas, while in 2002 it was more widespread, even affecting offshore reefs.
Bleaching “was even more extensive and much more severe” in 2016, the paper says, in part due to the boost to SSTs from the strong El Niño event. The proportion of reefs that experienced “extreme bleaching” in 2016 – the highest category of severity – was four times that of 1998 or 2002.
In the 2016 event, only 9% of the 1,156 surveyed reefs escaped with no bleaching, the study says. This was substantially less than the 44% in 1996 and 42% in 2002.
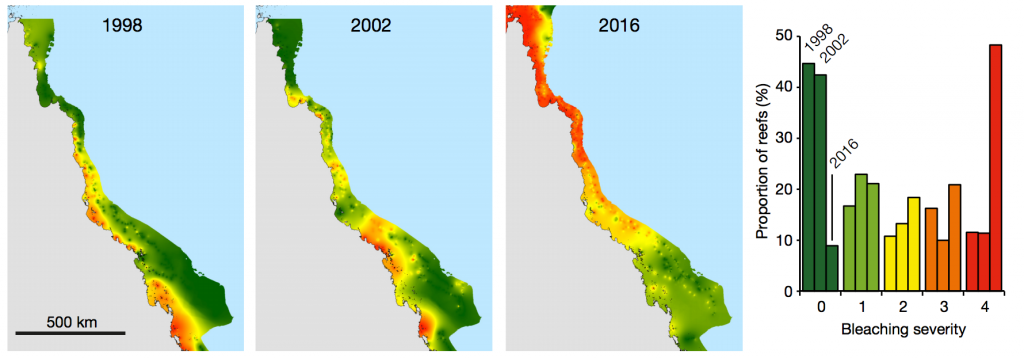
Extent and severity of coral bleaching across the Great Barrier Reef. Maps show bleaching for 1998 (left-hand map), 2002 (middle and 2016 (right), measured from aerial surveys. The shading indicates the severity of bleaching, from dark green (<1% of corals bleached), light green (1–10%), yellow (10–30%), orange (30–60%), red (>60%). The chart on the right summarises these proportions. Source: Hughes et al. (2017)
The patterns of bleaching in each of the three events can be explained by which parts of the reefs were exposed to the highest SSTs, the study finds.
The researchers show this by calculating the “degree heating weeks” (DHW) that the reef was exposed to. This is a measure of how often SSTs have exceeded the “bleaching threshold” – 1C above the highest summertime average SST – for the previous three months.
In the 1998 bleaching event, heat stress reached as high as eight DHWs. But the more recent events were even more severe. In 2002, parts of the reef were hit by up to 10 DHWs, and this was eclipsed by 16 DHWs in 2016.
You can see that the patterns of heat stress in the maps below match closely with the distribution of bleaching in the earlier maps. The shading indicates the areas of lowest (blue) and highest (red) heat stress, relative to each bleaching event.
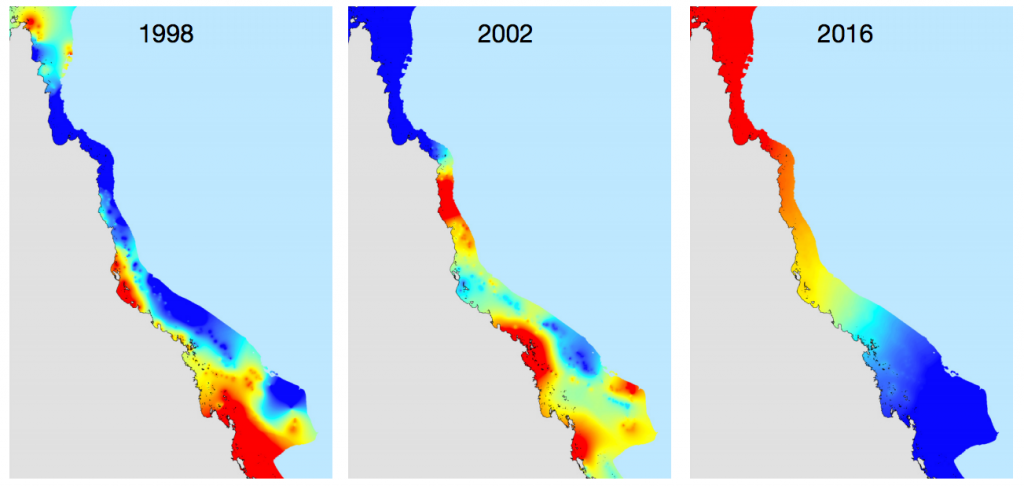
Pattern of heat stress for bleaching events in 1998 (left-hand map), 2002 (middle) and 2016 (right). Dark blue shading indicates 0 DHW, and red is the maximum DHW for each year (7, 10 and 16, respectively). Orange and yellow indicate intermediate levels of heat stress on a continuous scale. Source: Hughes et al. (2017)
Only the offshore reefs in the very south avoided any bleaching during all three events, the paper says, because SSTs didn’t get as high in this region. However, in 2016, these areas would likely have bleached were it not for the remnants of tropical cyclone Winston in late February, the authors note, which brought the cooling effect of winds, cloud cover and rain.
‘Last chance to see’
The findings show the close link between high SSTs and which areas of coral reef bleach. Local management to improve water quality or restrict fishing offers “little, if any” resistance to recurring bleaching events, the paper says:
“Even the most highly protected reefs and near-pristine areas are highly susceptible to severe heat stress.”
Similarly, corals that have bleached before and recovered are just as likely to bleach again in future, the researchers say. In other words, the corals didn’t adapt to the hotter conditions.
This shows that water temperature is clearly the overriding driver of coral bleaching, says Dr David Kline, a coral reef biologist at the Scripps Institution of Oceanography, who wasn’t involved in the study. He tells Carbon Brief:
“The 2016 mass bleaching event was so severe that the protection status, water quality, and even previous bleaching events did not prevent corals from bleaching.”
This means that the securing the future of the Great Barrier Reef – and corals around the world – “ultimately requires urgent and rapid action to reduce global warming,” the paper concludes.

Graveyard of Staghorn coral, Yonge reef, Northern Great Barrier Reef, October 2016. Credit: Greg Torda, ARC Centre of Excellence for Coral Reef Studies
If even an intensively-managed reef system like the Great Barrier can bleach so badly, using marine reserves won’t be enough to protect other reefs either, says Kline:
“Marine reserves are likely critical to increasing the recovery potential of bleached reefs but are not sufficient alone to prevent reefs from bleaching in a high CO2 world, only reducing global CO2 emissions will give us a chance of having healthy reefs in the future.”
At current rates of warming, the loss of the Great Barrier Reef is “as close as 20-30 years away,” says Prof Ove Hoegh-Guldberg, director of the Global Change Institute at the University of Queensland. This means it could happen in our lifetimes, he tells Carbon Brief:
“Coral reefs are so exquisitely beautiful yet fragile in a changing climate that I often feel like telling people to come and see reefs like the Great Barrier Reef while they can. This is, unfortunately, one of the most prominent examples of ‘last chance to see’.”
Hughes, T. P. et al. (2017) Global warming and recurrent mass bleaching of corals, Nature,doi:10.1038/nature21707