Explainer: How ‘Shared Socioeconomic Pathways’ explore future climate change
Zeke Hausfather
04.19.18Zeke Hausfather
19.04.2018 | 12:58pmOver the past few years, an international team of climate scientists, economists and energy systems modellers have built a range of new “pathways” that examine how global society, demographics and economics might change over the next century. They are collectively known as the “Shared Socioeconomic Pathways” (SSPs).
These SSPs are now being used as important inputs for the latest climate models, feeding into the Intergovernmental Panel on Climate Change (IPCC) sixth assessment report due to be published in 2020-21. They are also being used to explore how societal choices will affect greenhouse gas emissions and, therefore, how the climate goals of the Paris Agreement could be met.
The new SSPs offer five pathways that the world could take. Compared to previous scenarios, these offer a broader view of a “business as usual” world without future climate policy, with global warming in 2100 ranging from a low of 3.1C to a high of 5.1C above pre-industrial levels.
They show that it would be much easier to mitigate and adapt to climate change in some versions of the future than in others. They suggest, for example, that a future with “resurgent nationalism” and a fragmentation of the international order could make the “well below 2C” Paris target impossible.
What are the SSPs?
In the late 2000s, researchers from different modelling groups around the world began the process of developing new scenarios to explore how the world might change over the rest of the 21st century.
Earlier efforts during the 1990s had developed the “SRES” scenarios, which looked at four different possible future trajectories of population, economic growth and greenhouse gas emissions. However, these were fast becoming dated and lacked some large changes to society and the global economy that have occurred over the past 20 years.
One group of researchers then developed the “Representative Concentration Pathways” (RCPs), describing different levels of greenhouse gases and other radiative forcings that might occur in the future. They developed four pathways, spanning a broad range of forcing in 2100 (2.6, 4.5, 6.0, and 8.5 watts per meter squared), but purposefully did not include any socioeconomic “narratives” to go alongside them.
A second group worked on modelling how socioeconomic factors may change over the next century. These include things such as population, economic growth, education, urbanisation and the rate of technological development. These “Shared Socioeconomic Pathways” (SSPs) look at five different ways in which the world might evolve in the absence of climate policy and how different levels of climate change mitigation could be achieved when the mitigation targets of RCPs are combined with the SSPs.
The two efforts were designed to be complementary. The RCPs set pathways for greenhouse gas concentrations and, effectively, the amount of warming that could occur by the end of the century. Whereas the SSPs set the stage on which reductions in emissions will – or will not – be achieved.
The SSPs also define different baseline worlds that might occur in the absence of any concerted international effort to address climate change, beyond those already adopted by countries. These exclude any commitments to enact new policies, such as those within the Paris Agreement up to 2025 and 2030.
The SSPs feature multiple baseline worlds because underlying factors, such as population, technological, and economic growth, could lead to very different future emissions and warming outcomes, even without climate policy.
While the RCPs were finished in time to be used in the IPCC Fifth Assessment Report, developing the more complex SSPs has been a much longer and more involved process. The SSPs were initially published in 2016, but are only now just starting to be used in the next round of climate modelling – known as the Coupled Model Intercomparison Project version 6, or CMIP6 – in preparation for the IPCC’s sixth assessment report.
Narratives of the future
The SSPs are based on five narratives describing broad socioeconomic trends that could shape future society. These are intended to span the range of plausible futures.
They include: a world of sustainability-focused growth and equality (SSP1); a “middle of the road” world where trends broadly follow their historical patterns (SSP2); a fragmented world of “resurgent nationalism” (SSP3); a world of ever-increasing inequality (SSP4); and a world of rapid and unconstrained growth in economic output and energy use (SSP5).
The narrative for each is described in detail below:
SSP narratives
| SSP1 | Sustainability – Taking the Green Road (Low challenges to mitigation and adaptation) The world shifts gradually, but pervasively, toward a more sustainable path, emphasizing more inclusive development that respects perceived environmental boundaries. Management of the global commons slowly improves, educational and health investments accelerate the demographic transition, and the emphasis on economic growth shifts toward a broader emphasis on human well-being. Driven by an increasing commitment to achieving development goals, inequality is reduced both across and within countries. Consumption is oriented toward low material growth and lower resource and energy intensity. |
| SSP2 | Middle of the Road (Medium challenges to mitigation and adaptation) The world follows a path in which social, economic, and technological trends do not shift markedly from historical patterns. Development and income growth proceeds unevenly, with some countries making relatively good progress while others fall short of expectations. Global and national institutions work toward but make slow progress in achieving sustainable development goals. Environmental systems experience degradation, although there are some improvements and overall the intensity of resource and energy use declines. Global population growth is moderate and levels off in the second half of the century. Income inequality persists or improves only slowly and challenges to reducing vulnerability to societal and environmental changes remain. |
| SSP3 | Regional Rivalry – A Rocky Road (High challenges to mitigation and adaptation) A resurgent nationalism, concerns about competitiveness and security, and regional conflicts push countries to increasingly focus on domestic or, at most, regional issues. Policies shift over time to become increasingly oriented toward national and regional security issues. Countries focus on achieving energy and food security goals within their own regions at the expense of broader-based development. Investments in education and technological development decline. Economic development is slow, consumption is material-intensive, and inequalities persist or worsen over time. Population growth is low in industrialized and high in developing countries. A low international priority for addressing environmental concerns leads to strong environmental degradation in some regions. |
| SSP4 | Inequality – A Road Divided (Low challenges to mitigation, high challenges to adaptation) Highly unequal investments in human capital, combined with increasing disparities in economic opportunity and political power, lead to increasing inequalities and stratification both across and within countries. Over time, a gap widens between an internationally-connected society that contributes to knowledge- and capital-intensive sectors of the global economy, and a fragmented collection of lower-income, poorly educated societies that work in a labor intensive, low-tech economy. Social cohesion degrades and conflict and unrest become increasingly common. Technology development is high in the high-tech economy and sectors. The globally connected energy sector diversifies, with investments in both carbon-intensive fuels like coal and unconventional oil, but also low-carbon energy sources. Environmental policies focus on local issues around middle and high income areas. |
| SSP5 | Fossil-fueled Development – Taking the Highway (High challenges to mitigation, low challenges to adaptation) This world places increasing faith in competitive markets, innovation and participatory societies to produce rapid technological progress and development of human capital as the path to sustainable development. Global markets are increasingly integrated. There are also strong investments in health, education, and institutions to enhance human and social capital. At the same time, the push for economic and social development is coupled with the exploitation of abundant fossil fuel resources and the adoption of resource and energy intensive lifestyles around the world. All these factors lead to rapid growth of the global economy, while global population peaks and declines in the 21st century. Local environmental problems like air pollution are successfully managed. There is faith in the ability to effectively manage social and ecological systems, including by geo-engineering if necessary. |
These narratives describe alternative pathways for future society. They present baselines of how things would look in the absence of climate policy, and allow researchers to examine barriers and opportunities for climate mitigation and adaptation in each possible future world when combined with mitigation targets.
SSP1 and SSP5 envision relatively optimistic trends for human development, with “substantial investments in education and health, rapid economic growth, and well-functioning institutions”. They differ in that SSP5 assumes this will be driven by an energy-intensive, fossil fuel-based economy, while in SSP1 there is an increasing shift toward sustainable practices.
SSP3 and SSP4 are more pessimistic in their future economic and social development, with little investment in education or health in poorer countries coupled with a fast-growing population and increasing inequalities.
SSP2 represents a “middle of the road” scenario historical patterns of development are continued throughout the 21st century.
The SSPs were designed to reflect worlds in which mitigation and adaptation challenges vary from low to very high. While the baseline SSP scenarios assume an absence of climate policy, researchers also wanted to look at how the underlying socioeconomic conditions would affect the implementation of climate policy.
For example, SSP1 features low challenges to mitigation and adaptation due to its rapid technological development, relative global equality of income and focus on environmental sustainability. SSP4, on the other hand, features similarly low challenges to mitigation due to its rapid technological development, but high challenges to climate adaptation due to persistent inequality and poverty in many parts of the world.
Many of the SSPs end up being broadly similar in the narratives to the old SRES scenarios, used in the IPCC’s third and fourth assessment reports. For example, the sustainability-focused SSP1 is rather similar to SRES B1, while the more middle-of-the-road SSP2 is similar to SRES B2. The globally fragmented SSP3 is quite similar to SRES A2 and the high fossil-fuel reliant, high-growth SSP5 shares many elements with SRES A1F1.
Unlike the SRES scenarios, however, mitigation is considered separately from the underlying pathways. Each SSP has a baseline scenario that describes future developments in the absence of new climate policies, beyond those already in place today. SSPs can then be combined with various emission mitigation targets.
Specifically, each SSP looks at how each different RCPs could be achieved within the context of the underlying socioeconomic characteristics and shared policy assumptions of that world, though, as discussed below, not all SSPs are compatible with the RCPs limiting warming to 1.5C or 2C above pre-industrial levels.
Future scenarios for population and GDP
The main differences between SSPs come from their assumptions on global population growth, access to education, urbanisation, economic growth, resources availability, technology developments and drivers of demand, such as lifestyle changes.
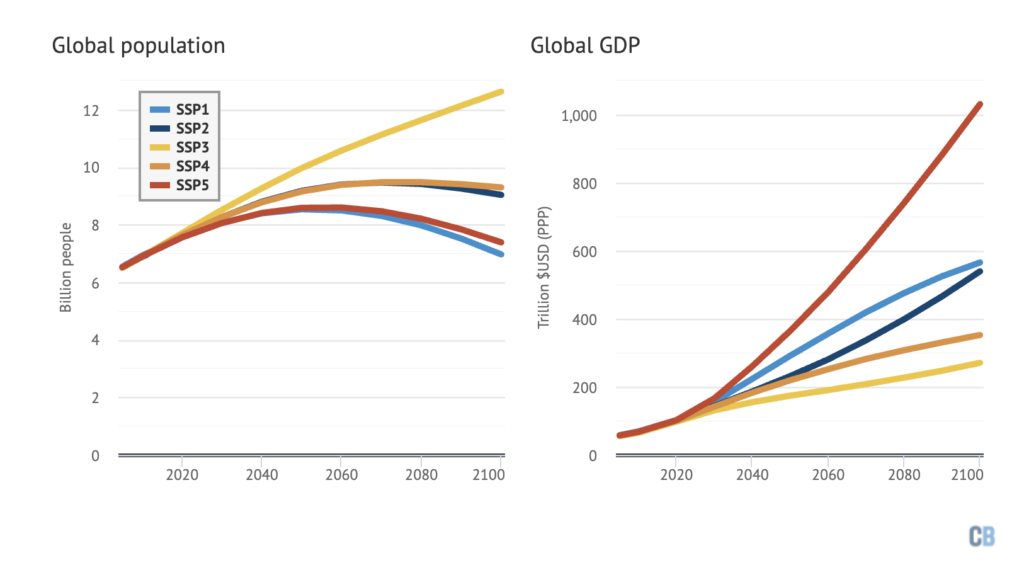
The figure below shows different global population (left) and GDP projections (right) for each of the five SSPs over the 21st century. While multiple groups of researchers created population and GDP estimates, a single projection was chosen as representative for each SSP to ensure consistency across modelling efforts.
To create different global population scenarios, researchers used a demographic model based on assumptions of future fertility, mortality, migration and education. Assumptions for future female access to education strongly influence fertility and population growth. These assumptions were varied to be consistent with each SSP narrative.
Population levels are lowest in SSP1 and SSP5, peaking at 8.5 billion between 2050 and 2060, and declining to today’s level of around 7 billion by 2100. This is broadly consistent with the United Nation’s low fertility scenario.
SSP2 and SSP4 are more middle of the road, with population peaking between 2070 and 2080 around 9.5 billion, though this is still lower than the UN medium fertility scenario of around 11.5 billion. Finally, SSP3 shows continued global population growth through to the end of the century, reaching 12.6 billion by 2100. SSP3 is higher than the UN medium fertility scenario, but still below the UN’s high fertility scenario.
The population projections in the SSPs are generally a bit lower than in prior modelling efforts (for example, SRES), due to the decline of fertility rates in developing countries over the past two decades and the faster-than-expected expansion of education among young women in the least developed countries.
All SSPs project dramatic growth in the global economy, with global GDP in 2100 between four and 10 times larger than it was in 2010. This translates into an average annual global GDP growth rate of between 1.8% at the low end and 3.4% at the high end, though in all models the growth rate slows over the century. This growth is one of the primary drivers of future CO2 emissions, though different scenarios foresee different levels of future “decoupling” of growth and emissions associated with a decarbonising of the economy.
The GDP numbers incorporate population projections from each SSP, as well as assumptions of international trade flows, technological development and other factors consistent with the SSP narratives.
The highest GDP growth is found in SSP5, with rapid development and convergence among countries and global average per-capita GDP of around $140,000 per year in 2100. The lowest GDP growth occurs in SSP3, where development is slow and fragmented. In SSP3 global average income is around $20,000 in 2100, only modestly above today’s levels.
SSPs also differ markedly in the level of future inequality within and between countries. SSP4 has the highest inequality, followed by SSP3. Both SSP1 and SSP5 feature relatively equitable development and a rapid catch-up of the world’s poorest countries over the coming century.
Finally, SSPs provide estimates of how the world will become more urban in the future. This ranges from a low of 60% of the population living in cities in 2100 in SSP3 – similar to today’s rate of 54% – to up to 92% in SSP1, SSP4, and SSP5. SSP2 is in the middle, reaching 80% urbanisation by 2100.
Baseline CO2 emissions and warming
Researchers employed six different integrated assessment models (IAMs) to translate the socioeconomic conditions of the SSPs into estimates of future energy use characteristics and greenhouse gas emissions.
IAMs add aspects of society to an energy systems model, simulating how population, economic growth and energy use affect – and interact with – the physical climate. They produce scenarios of how greenhouse gas emissions may vary in future based on underlying socioeconomic factors – and how energy use, production and economic activity may change to meet climate mitigation targets.
Six IAMs were used to create energy use and emissions characteristics for the SSPs – AIM-CGE, GCAM, IMAGE, MESSAGE-GLOBIOM, REMIND-Magpie, and WITCH-GLOBIOM. A total of 24 baseline scenarios were created by the different models simulating different SSPs, though not all models ran all SSPs.
To make these results easier for the climate modelling community to work with, a single model was chosen as the “marker” scenario for each SSP, so that, for example, climate researchers looking at SSP1 would look at the IMAGE model outputs, while SSP2 would use the MESSAGE model.
The simple climate model MAGICC was used to convert greenhouse gas emissions from the IAMs into atmospheric concentrations and future warming.
(More detailed earth system and general circulation climate models are currently being run as part of the ongoing Coupled Model Intercomparison Project 6 (CMIP6), in preparation for the IPCC’s sixth assessment report, though the resulting global temperature increases should be broadly similar.)
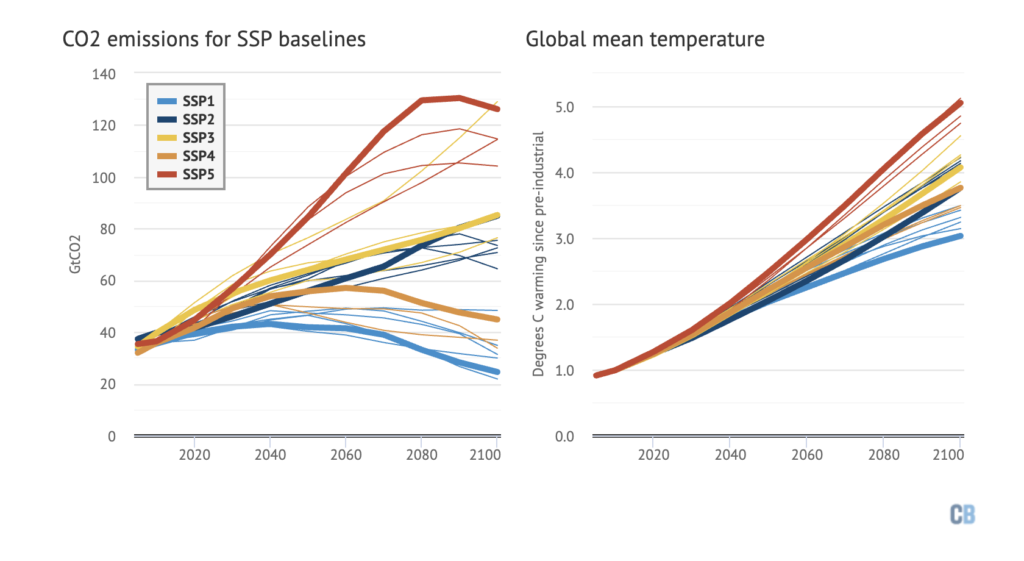
The figure below shows the CO2 emissions (left) and global average temperature increases relative to pre-industrial levels (right) for each SSP’s baseline scenario. Each line represents an individual model run, with the colours indicating the SSP and the “marker” scenarios for each SSP shown by thick lines.
Global CO2 emissions vary considerably across the different SSP baselines. In general, one of the strengths of the SSP framework is to highlight the importance of baseline assumptions on resulting emissions and temperatures.
In the relatively sustainability-focused SSP1, emissions peak between 2040 and 2060 – even in the absence of specific climate policies, declining to around 22 to 48 gigatonnes of CO2 (GtCO2) per year by 2100. This results in 3-3.5C of warming by 2100.
In the “middle of the road” SSP2, emissions continue to increase through the end of the century, reaching between 65GtCO2 and 85GtCO2, with resulting warming of 3.8-4.2C.
Models show a wide range of possible baseline emissions for the “regional rivalry” SSP3, with most runs showing increases up to around 76-86GtCO2 by 2100, but one model (MESSAGE) having emissions of 129GtCO2, the highest of any SSP. These differences relate to access to economically recoverable oil, as discussed in the next section. Warming in 2100 in SSP3 is estimated at 3.9-4.6C.
Despite its high inequality, emissions are relatively low in SSP4 due to rapid technological progress on low-carbon energy sources. SSP4 emissions range from 34GtCO2 to 45GtCO2 by 2100, with warming of 3.5-3.8C.
Finally, the high-growth energy-intensive SSP5 shows the most overall emissions of any SSP, ranging from 104GtCO2 to 126GtCO2 in 2100, resulting in warming of 4.7-5.1C.
Energy use in the SSP baselines
While the SSP baseline scenarios all represent worlds without new policies to address climate change, they differ significantly in how they see global energy use changing.
Some scenarios, such as SSP3, foresee little development of cost-effective low-carbon alternatives, or technologies that can cheaply address non-climate negative impacts of fossil fuels, such as air pollution in SSP5. In these worlds, coal continues to be one of the primary global energy sources through to the end of the century, leading to high CO2 emissions and warming.
Others, such as SSP1 and SSP4, have a much larger share of energy coming from renewable sources, with some electrification of current fossil fuel end-uses, such as transportation or heating, but driven by falling costs rather than climate concerns.
The figure below shows how energy is used in 2100 in each SSP and IAM. While they differ a bit in their mix of fuel sources, with a few exceptions – such as the MESSAGE model in SSP3 – the total primary energy use is similar for all models in a given SSP.
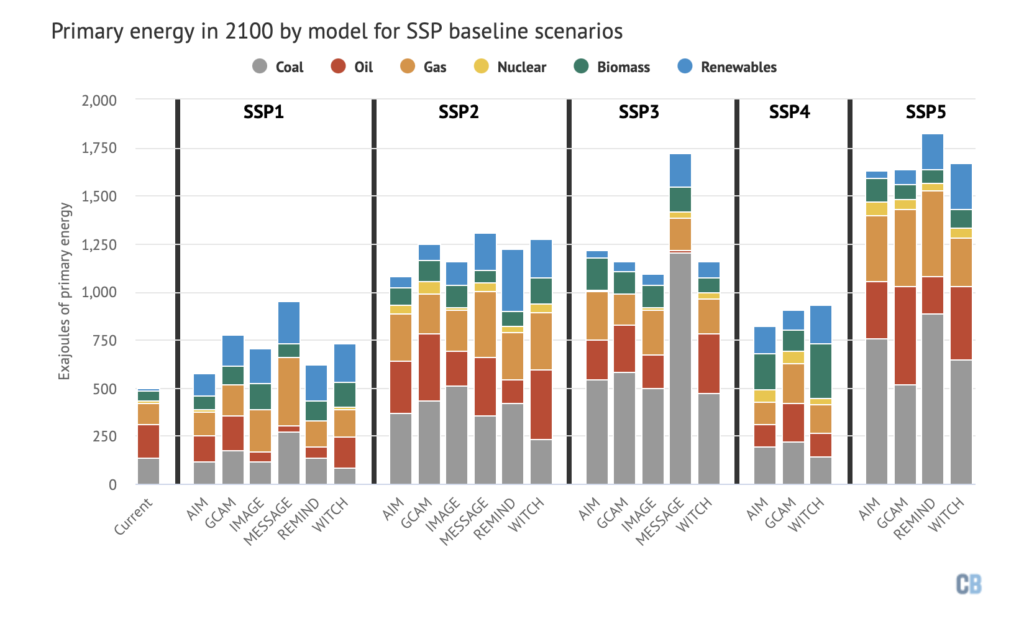
The SSP baselines span a wide range of future energy demand. At the upper end of the range, the SSP5 scenario has energy demand of over 1,500 exajoules (EJ) per year, more than three times higher than today’s 500EJ. SSP2 and SSP3 have more than twice current energy demand, while in SSP1 energy demand stays only around 50% above today’s levels, despite rapid economic growth.
Energy access is also quite different across SSPs. In the SSP3 and SSP4 baseline scenarios there is continued use of traditional biomass, such as wood or animal dung, in the households of developing countries, while the use of coal and biomass in households decreases dramatically in the other three scenarios.
In SSP3, the MESSAGE model has unusually high coal use due, in part, to the exhaustion of economically viable oil reserves and the conversion of coal into hydrocarbons to meet transportation fuel needs. Other SSP3 models assume larger economically viable oil reserves and, thus, less dramatic coal use.
Overall, coal use is quite high in SSP3 and SSP5. In the SSP5 baseline marker scenario (REMIND), coal use between 2005 and 2100 is around 44,500 exajoules (EJ), considerably larger than current technologically and economically recoverable reserves of around 21,000EJ.
However, it is still well within the range of all known coal resources, which are estimated at around 490,000EJ, a portion of which could become economically recoverable with additional technological developments. That said, high coal-use scenarios, such as those found in the SSP5 baseline (which corresponds to RCP8.5), have been criticised in the past as potentially unrealistic.
Even in the relatively sustainability-focused SSP1 coal use is close to today’s levels in 2100, reflecting the challenge of switching away from fossil fuels in the absence of climate policy.
The figure below shows how global energy use changes over time in each of the SSP no-policy baseline marker scenarios.
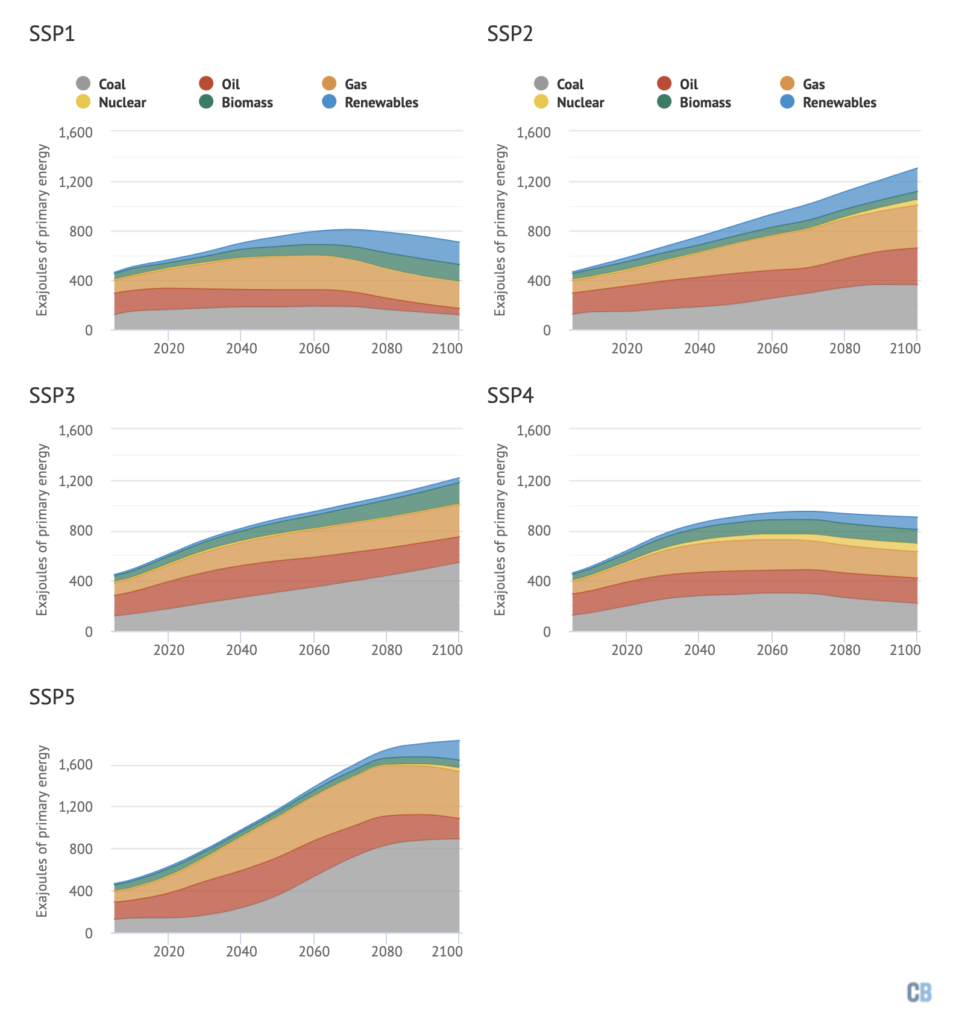
While renewable energy and biomass make up a larger portion of the energy mix in the more sustainability-focused SSP1, around 60% of energy demand in 2100 still comes from fossil fuel sources. In the absence of additional climate policy, these scenarios do not foresee technological progress by itself leading to an energy system dominated by low-carbon sources during this century.
(It is worth noting that energy scenarios have been repeatedly criticised for overestimating the costs and underestimating the potential of low-carbon technologies.)
Combining SSPs and mitigation targets
While the baseline SSP scenarios portray a range of outcomes in the absence of additional climate policy, researchers also wanted to examine how different levels of climate mitigation and adaptation would fit into the future described by each SSP.
To model this, they used shared policy assumptions around how quickly international collaboration on climate policy could occur within each SSP, as well as respecting limitations imposed by the underlying assumptions around population growth, economic activity and technological development in each pathway.
The mitigation targets examined are defined by radiative forcing levels (in watts per meter squared) analogous to the RCPs, which set a target level of atmospheric greenhouse gas concentrations (and associated radiative forcing) in 2100.
The figure below shows the emissions over time under all the SSP baselines (grey lines) and under different mitigation targets, where radiative forcings in 2100 are limited to 6.0, 4.5, 3.4, 2.6 and 1.9 watts per meter squared (coloured lines). The average amount of warming associated with the range of baselines and each of the targets is also shown, on the right.
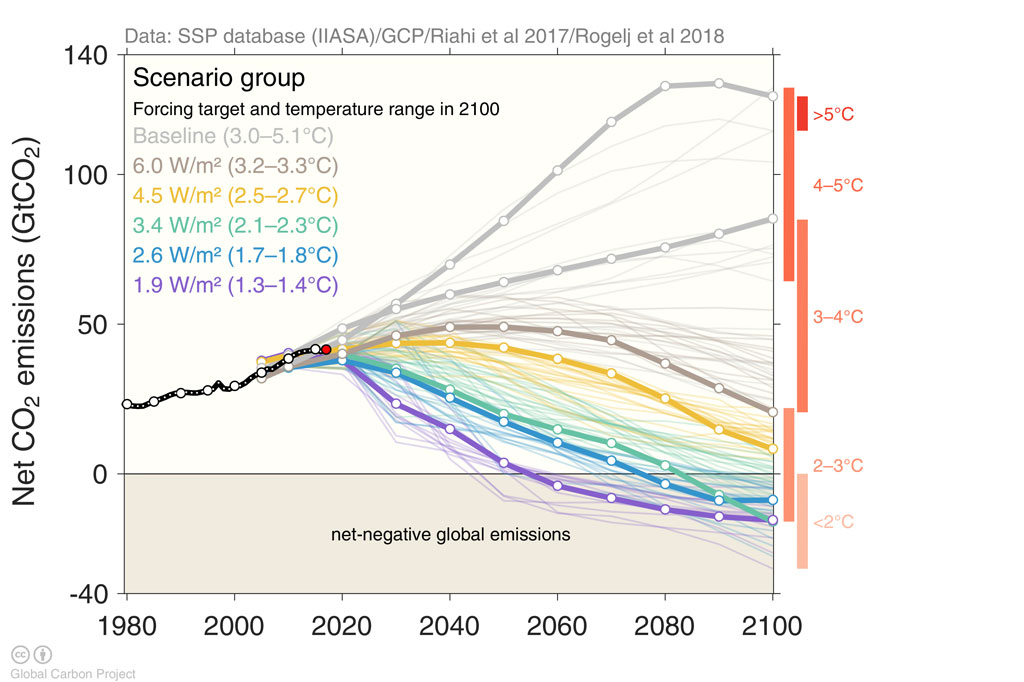
With the release of the SSPs, modellers have expanded the range of mitigation targets that they are considering. The IPCC fifth assessment report focused on RCP2.6, RCP4.5, RCP6.0 and a high-end no-mitigation RCP8.5 pathway. The SSPs have added RCP1.9, RCP3.4 and are planning to add RCP7.0.
RCP1.9 is a new pathway that focuses on limiting warming to below 1.5C, the aspirational goal of the Paris Agreement. Pre-Paris, the research community was focussed on limiting warming to 2C as the most ambitious climate outcome. However, after the adoption of the Paris Agreement and the inclusion of 1.5C in its long-term temperature goal, there was a need to clearly understand the implications of this more ambitious target.
RCP3.4, on the other hand, represents an intermediate pathway between the “very stringent” RCP2.6 and less stringent mitigation efforts associated with RCP4.5. It provides an alternative to explore given “recent discussions about…the attainability of the 2C objective”. A variant of RCP3.4 is also being explored where where forcings “substantially overshoot” the target mid-century and are brought back down by 2100 through the use of large amounts of negative emissions later in the century.
Finally, RCP7.0 will represent the medium-to-high end of the range of future emissions and warming, and is a baseline outcome rather than a mitigation target. It will fill an important gap by providing a pathway similar to the SSP2 “middle of the road” baseline, and may provide a compelling alternative or complement to the commonly used RCP8.5 for studies comparing mitigation and “business-as-usual” scenarios.
The combination of five SSPs and six RCPs is shown in the figure below. (RCP7.0 is not shown as the runs are not yet complete.)
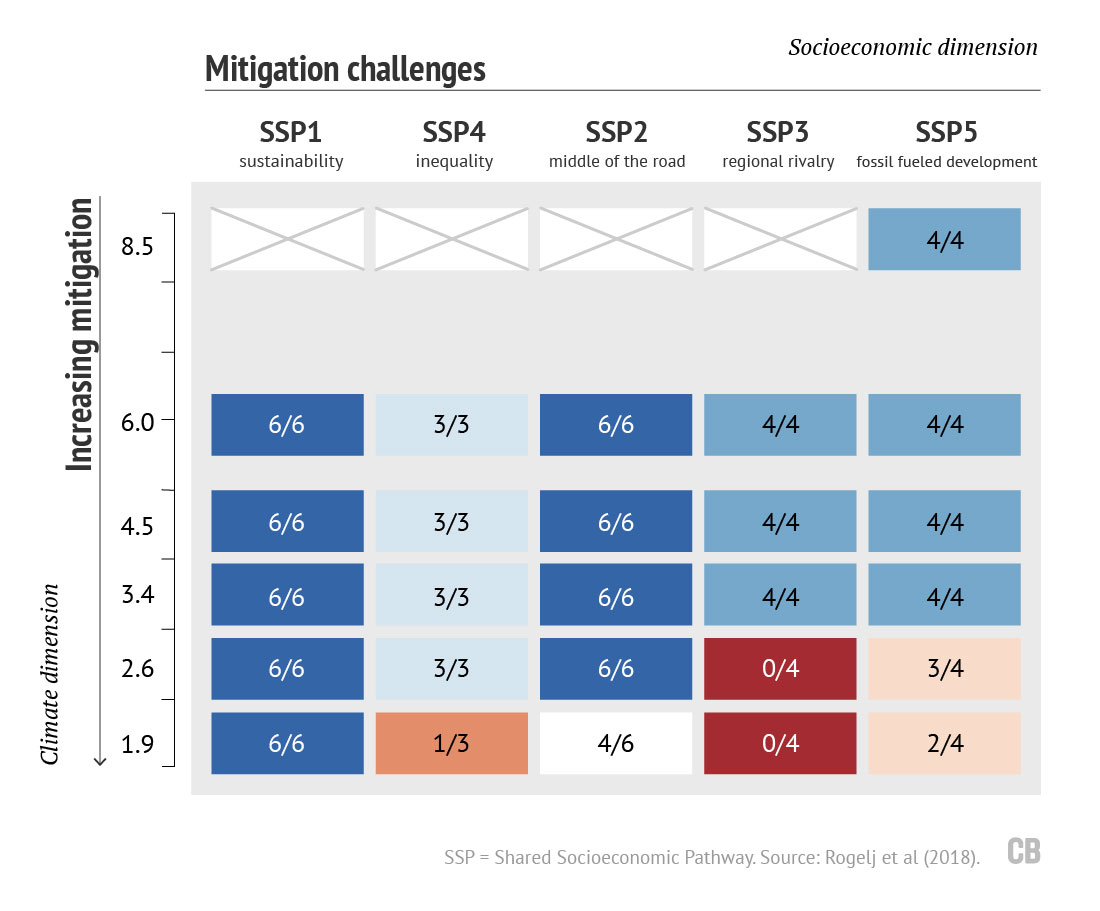
Each box in the figure shows the number of models that were able to successfully reach the RCP target, out of the total number of models available for a given SSP. For example, the “3/4” in the SSP5 / RCP2.6 cell means that four IAMs tried to achieve RCP2.6 in an SSP5 world, but only three of the models could find a solution. The other model could not either reduce emissions fast enough or generate sufficient negative emissions. Similarly, only SSP5 could generate scenarios that reached RCP8.5-levels of radiative forcings, while emissions were too low in other SSP baselines.
To ascertain whether the underlying socioeconomic factors in an SSP allow for the level of mitigation necessary to meet RCP targets, models used shared policy assumptions about limits to international cooperation in the short-to-medium term and the possible speed of emissions reductions.
For example, SSP1 and SSP4 see it as possible for there to be “global collaboration” on climate policies by the year 2020. The more fossil fuel-driven SSP2 and SSP5 worlds have delays in establishing global action, with regions moving to global cooperation between 2020–2040. The regionally fragmented SSP3 has some higher-income regions joining a global effort to mitigate emissions between 2020–2040, while lower income regions follow between 2030 and 2050.
For land use, which is an important and difficult-to-regulate source of emissions, SSP1 and SSP5 allow effective international cooperation to reduce emissions. SSP2 and SSP4 allow some more limited efforts to reduce emissions from deforestation and agriculture, while SSP3 generally assumes it will not be possible to encourage individual countries to avoid deforestation.
The differences between SSPs affect the ability of scenarios to have large near-term mitigation of greenhouse gas emissions. While SSP1 and SSP4 allow for quick global action in reducing emissions beyond those already agreed to in the nationally determined contributions (NDCs) under the Paris Agreement, other scenarios, such as SSP3 and SSP5, find that even these existing commitments are challenging to achieve in full.
In SSP5, emissions rise too far and fall too slowly to meet the Paris targets without large amounts of negative emissions in the latter part of the century, to offset slower near-term emissions reductions. Three out of four SSP5 models were able to develop possible scenarios to achieve RCP2.6 targets of limiting warming below 2C, while only two out of four were able to find a way to reach RCP1.9 and limit warming to below 1.5C.
In SSP3, models were simply not able to achieve either RCP2.6 or RCP1.9 targets due to regional rivalry and resurgent nationalism limiting the ability of the world to cooperate on reducing emissions over the next few decades.
While the rapid technological development in SSP4 makes it easier to attain more modest mitigation targets, the high inequality makes it more difficult to attain very strong emission reductions, particularly for land-use emissions in poorer countries. This means that, while all three SSP4 models can reach a RCP2.6 target, only one of three can reach of RCP1.9 and limit warming to below 1.5C.
The figure below shows the different emissions trajectories broken out by SSP, as well as indicating the level of adaptation and mitigation challenges associated with each. In general, SSP1 (bottom left box) has faster emission reductions and less negative emissions required later in the century under deeper mitigation scenarios, compared to other SSPs.
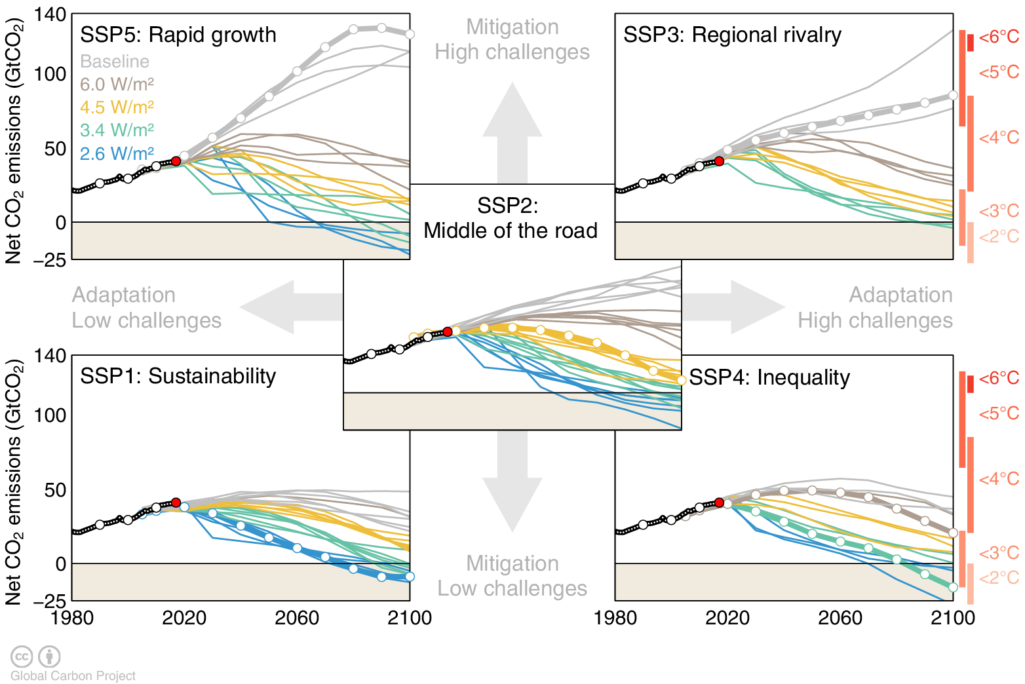
The fact that IAMs could not find a viable solution for some below-2C and below-1.5C scenarios does not necessarily mean that these scenarios are impossible. Models are necessarily imperfect and cannot foresee all of the technological or societal changes that will happen over the coming century. For example, models used to struggle to reach 2C targets before they started including large-scale negative emissions technologies – though these still largely exist only in the models, rather than in real-world deployments at scale.
Similarly, what modellers consider as plausible rates of emission reduction or negative emissions may turn out to be overly conservative (or optimistic). Pathways such as SSP3, where strong mitigation scenarios cannot be modelled, should be seen as an indication that such a world of resurgent nationalism and regional divisions greatly increases the risk that the transformations required might not be achievable.
Negative emissions in the SSPs
All scenarios in the SSP database that keep warming below 2C incorporate some bioenergy with carbon capture and storage (BECCS). However, the degree to which they rely on BECCS – or on negative emissions more broadly – to meet the goal varies both by model and SSP.
In general, SSPs that allow more rapid near-term emissions reductions, such as SSP1, rely less on BECCS later in the century. The figure below shows the total amount of energy generated from BECCS over the century for each SSP/RCP scenario, as well as IAM. It shows the difference in the amount of BECCS used by each model and each SSP, with some models showing considerably larger amounts than others for the same RCP mitigation target.
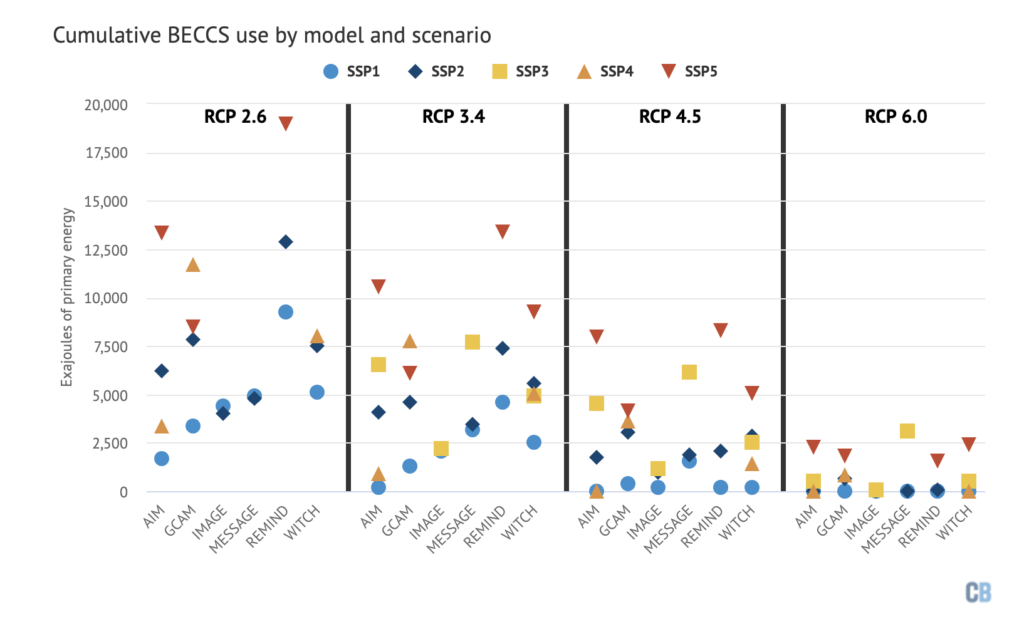
In the below-2C RCP2.6, cumulative BECCS use ranges from a low of 1,660EJ to a high of 19,000EJ, or between 4% and 26% of all energy generated between present and 2100. SSP1 generally has the lowest BECCS use, followed by SSP2 and SSP4. SSP5, which limits near-term emission reductions, requires between two and eight times more BECCS than in SSP1.
A similar pattern holds in RCP3.4, but here one model (AIM) meets the target in SSP1 with next-to-no negative emissions. Across all the models, RCP3.4 requires 30-60% less BECCS than RCP2.6.
In RCP4.5, most models require little-to-no negative emissions in an SSP1 world, though many still employ significant amounts of BECCS in SSP3 and SSP5.
While BECCS is the primary negative emissions technology included in IAMs, it is largely a stand-in for any sort of future negative emissions. Its role could be replaced, at least in part, by other approaches and technologies, such as direct air capture or large-scale reforestation, as they become cost-effective over the coming century.
No single ‘business as usual’
A key questions for scientists and policymakers is what will happen if the world takes no action to address climate change.
One of the big changes brought by the release of the SSPs is a broadening of the baseline no-new-policy scenarios available to researchers. Over much of the past decade researchers have tended to use the high-emission high-warming RCP8.5 as their “business as usual” baseline – a worst-case scenario of unchecked warming to compare against futures where emissions are mitigated.
One important takeaway is a shift in the definition of “business as usual”. Instead of a single worst-case scenario, the SSPs present a wide range of future emissions possible in the absence of climate policy, though all the new baseline scenarios result in at least 3.1C warming (and up to 5.1C) by 2100.
While RCP8.5 lives on in the form of the SSP5 baseline, it is now just one of many possible no-new-policy futures. The fact that only one of the SSPs, SSP5, can reach the level of emissions found in RCP8.5 suggests that it may not now be best suited for use as the sole baseline scenario in future research.
If any SSP can be said to be characteristic of current conditions it is SSP2, where social, economic and technological trends do not shift markedly from historical patterns. Greenhouse gas concentrations in the SSP2 baseline roughly correspond to the new RCP7.0, which shows lower emissions and nearly 1C less warming than RCP8.5 – though still 3.8-4.2C of warming above pre-industrial levels.
It is also possible that the world will follow more of a SSP1 or SSP4 pathway of rapid technological development and falling costs of things such as solar energy, battery storage, transmission technologies and other changes. These would reduce barriers to mitigation and result in more modest emissions and warming, even in the absence of climate policies.
However, the developers of the SSPs make no claim as to the relative likelihood of any scenario coming to pass. It is certainly possible to imagine a SSP3 or SSP5 world of high emissions. With the multiple scenarios, researchers will now be able to compare mitigation outcomes to a more realistic range of baseline worlds.
-
Explainer: How ‘Shared Socioeconomic Pathways’ explore future climate change
-
Explainer: What ‘Shared Socioeconomic Pathways’ tell us about climate change