Explainer: The high-emissions ‘RCP8.5’ global warming scenario
Zeke Hausfather
08.21.19Zeke Hausfather
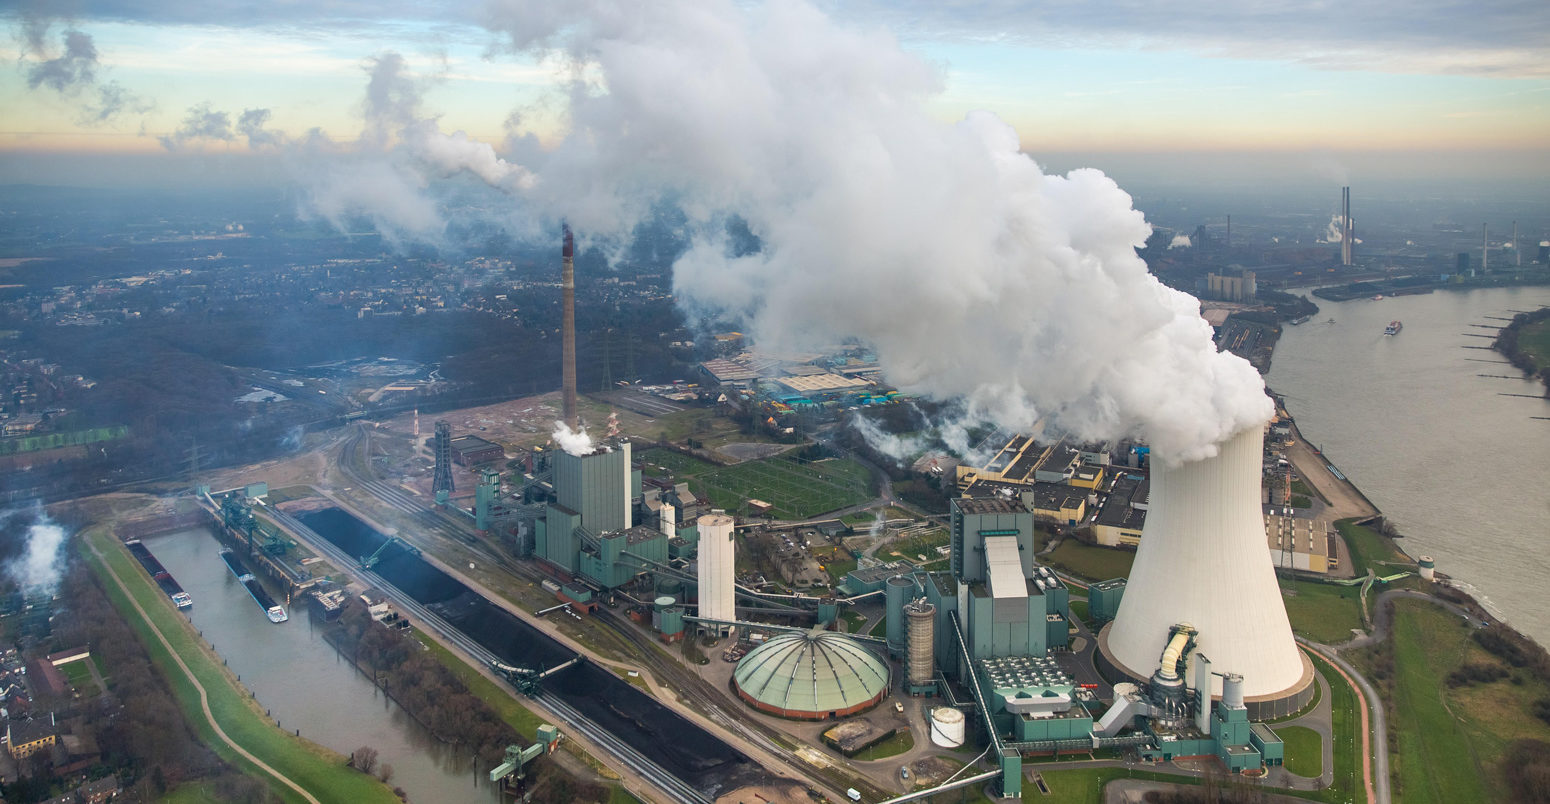
21.08.2019 | 3:57pmA sizeable portion of recent studies on future climate impacts have focused on a warming scenario called “RCP8.5”. This high-emissions scenario is frequently referred to as “business as usual”, suggesting that is a likely outcome if society does not make concerted efforts to cut greenhouse gas emissions.
In recent years the emissions scenario used to generate RCP8.5 has come under criticism by a number of researchers for its assumptions around high future emissions and a dramatic expansion of coal use. At the same time, a new set of future scenarios – the Shared Socioeconomic Pathways (SSPs) – has since been released, offering a broader view of what a world without future climate policy might look like.
In this article, Carbon Brief examines how the emissions scenario underlying RCP8.5 was developed and how it has subsequently been used in the academic literature and media. According to the researchers who developed it, RCP8.5 was intended to be a “very high baseline emission scenario” representing the 90th percentile of no-policy baseline scenarios available at the time.
The creators of RCP8.5 had not intended it to represent the most likely “business as usual” outcome, emphasising that “no likelihood or preference is attached” to any of the specific scenarios. Its subsequent use as such represents something of a breakdown in communication between energy systems modellers and the climate modelling community.
While modelling potential worst-case outcomes is important, there is also a need to examine the wider range of no-policy baseline outcomes – the majority of which result in lower future emissions.
The Representative Concentration Pathways (RCPs)
Projecting future climate change involves assessing a number of different uncertainties. Some of these relate to the climate system, such as how sensitive the climate might be to increased concentrations of greenhouse gas in the atmosphere. Others involve the quantity of gases emitted, using energy system models to simulate different scenarios of future emissions.
To try and capture a range of possible future emissions, energy system modellers have used integrated assessment models (IAMs) that simulate both future energy technologies and emissions. These produce emissions scenarios that are then used by scientists to run complex climate models that simulate how the climate might change in the future. As modern climate models take an enormous amount of computing power to run, the number of future emission scenarios that can be used tends to be fairly limited.
Many different scenarios have been developed over recent decades of climate research. However, the ones that have principally been used to drive climate model runs – and that have largely driven discussions by policymakers and the public – include:
- Six IPCC 1992 (IS92) scenarios used in the Intergovernmental Panel on Climate Change (IPCC) second assessment report (SAR)
- Six Special Report on Emission Scenarios (SRES) used in the IPCC third (TAR) and fourth (AR4) assessment reports
- Four RCP scenarios used in the IPCC fifth assessment report (AR5)
- Nine forcing scenarios being developed for the upcoming IPCC sixth assessment report (AR6) based on the Shared Socioeconomic Pathways (SSPs).
Climate modellers have somewhat different needs in future emission scenarios than energy system modellers. While energy system modellers want to explore a range of different outcomes under different socioeconomic assumptions – such as future population and economic growth – climate modellers want outcomes that lead to distinctly different warming levels in order to effectively evaluate and compare the results.
After the publication of the IPCC AR4 in 2007, there was a widespread desire to update the old SRES scenarios – developed in the late 1990s – to better reflect current technological and socioeconomic conditions. According to a “perspective” journal paper in Nature in 2010 by Dr Richard Moss and colleagues, modellers wanted to ensure that, “nearly a decade of new economic data, information about emerging technologies, and observations of environmental factors such as land use and land cover change… be reflected in new scenarios.”
However, the IPCC AR5 was scheduled to come out in 2013, and climate modellers would need scenarios to use in their models by 2010. Given the relatively short period to generate new scenarios, researchers developed a “parallel approach”. A set of “representative concentration pathways”, or “RCPs”, was therefore created for climate modellers to use in the interim while the development of more thorough socioeconomic pathways was undertaken.
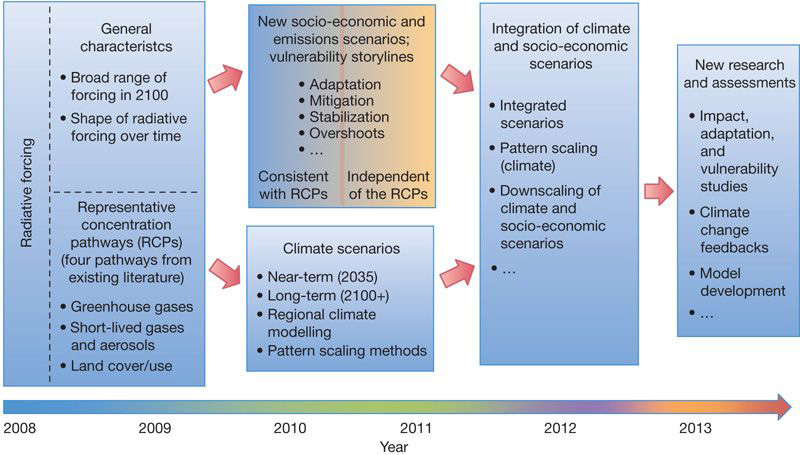
The diagram below, taken from that Nature paper, shows the proposed development timeline. Once both efforts were completed, they would be integrated together in time for the 2013 IPCC AR5.
Rather than starting with detailed socioeconomic storylines to generate emissions and climate scenarios, as had been the case with the SRES scenarios, the energy systems modeling community decided to start by creating scenarios of future “radiative forcing” for climate modelling not associated with any particular unique socioeconomic or emissions scenario. Radiative forcing is a measure of the combined effect of greenhouse gases, aerosols, and other factors that can influence climate to trap additional heat.
Each RCP provides only one of many possible pathways to that level of radiative forcing. The researchers developing the RCPs also stressed that they were not intended to be “the final new, fully integrated scenarios” but rather would simply focus on future concentrations of greenhouse gases and other radiative forcings used as inputs into climate models.
Four pathways were developed based on their end-of-century radiative forcing: RCP2.6 (indicating a 2.6 watts per metre squared – W/m2 – forcing increase relative to pre-industrial conditions), RCP4.5, RCP6.0, and RCP8.5.
The selection of these four pathways was a result of a number of different priorities. These included having scenarios that spanned the range of future emissions and concentrations projected in scientific literature, but also being sufficiently distinct from one another.
Unfortunately, the development of the socioeconomic pathways took much longer than originally foreseen, and the RCPs were never turned into fully integrated scenarios in time for the publication of the AR5.
This left them as useful tools for modelling different potential climate outcomes, but lacking any consistent socioeconomic assumptions that would allow researchers to examine the likelihood of different no-policy baseline and mitigation scenarios. For example, Moss and colleagues specifically state that “RCP8.5 cannot be used as a no-climate-policy reference scenario for the other RCPs because RCP8.5’s socioeconomic, technology and biophysical assumptions differ from those of the other RCPs.”
Dr Glen Peters, research director at CICERO in Norway, tells Carbon Brief:
“With the benefit of hindsight, the ‘new scenario framework’ (SSP/RCPs) did not function as planned. The integration between climate models and IAMs (RCPs and SSPs) never really happened; the RCPs were only intended to be a short-cut, and merged with SSPs back in 2012, but it is 2019 and we are only now seeing integration, albeit somewhat limited. At this point I think only a vanishingly small number of modellers on both climate and energy understand the background on why SSPs and RCPs were even developed, and that has led to deep misunderstandings.
“The RCPs have served the climate modelling community well, they have had consistent pathways to run and compare their models. With the RCPs, the need for the IAM community is essentially gone, and therefore much of the diversity and nuance from IAMs happens in a parallel literature.”
This parallel process contributed to quite a bit of confusion regarding the relative likelihood of and assumptions underlying the different emissions scenarios used to generate the RCPs. It is likely one of the factors that gave rise to the use of RCP8.5 as the default “business-as-usual” scenario in the academic literature and in the media.
A worst case scenario
One change introduced during the development of RCP scenarios was to combine no-mitigation “baseline” scenarios with mitigation scenarios where climate policy drives varying degrees of emission reductions.
In prior modelling efforts, such as IS92 and SRES, all the scenarios were specifically designed to look at a range of possible baseline “no-policy” outcomes – also known as “reference” scenarios. This means that while they factor in different ways society could develop in the future, they do not account for any future concerted climate mitigation efforts or existing commitments, such as the Kyoto Protocol. By contrast, out of the four integrated assessment models (IAMs) used to create the RCP scenarios, only RCP8.5 was a “baseline” scenario that included no policy-driven mitigation (though RCP6.0 was consistent with some baseline scenarios even if the particular IAM run used to generate it included policy-driven mitigation).
In their paper outlining the development of the RCP scenarios, Prof Detlef van Vuuren and colleagues explained that they include “one mitigation scenario leading to a very low forcing level (RCP2.6), two medium stabilisation scenarios (RCP4.5/RCP6.0) and one very high baseline emission scenarios (RCP8.5).”
They suggest that “RCP8.5 should be seen as a high emission scenario” while “RCP6.0 can be interpreted as either a medium baseline or a high mitigation case”. This suggests that the authors say no reason to consider RCP8.5 a more likely “business as usual” outcome than, say, RCP6.0.
RCP8.5 was specifically selected as a high-end baseline scenario, and was not intended to be portrayed as the most likely “business as usual” no-policy outcome. The researchers emphasise this point in their paper, showing how the emissions in each scenario compared to the range found in the energy modelling literature at the time.
The figure below, taken from their paper, shows each RCP compared to the 90th percentile (dark grey) and 98th percentile (light grey) of energy modeling scenarios in the literature that had been previously developed by researchers.
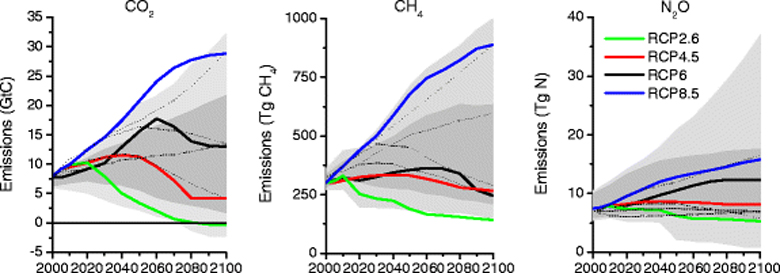
CO2 emissions between 2000 and 2100 in RCP8.5 are between the 90th and 98th percentile of all published scenarios, at times even going beyond the 98th percentile. The researchers found that overall radiative forcing in RCP8.5 is also around the 98th percentile of published scenarios, and around the 90th percentile for no-policy baseline scenarios. However, they also emphasise that this is not the only scenario ever produced that results in emissions and radiative forcing this high; around 40 scenarios with a similar forcing level exist in the energy modelling literature.
So, the emissions scenario used to generate RCP8.5 was around the highest of the available no-policy baseline scenarios. While it was by no means considered an impossible outcome, it was also not considered to be more or less likely than any other no-policy baseline scenario – the vast majority of which resulted in lower emissions.
As van Vuuren tells Carbon Brief:
“RCP8.5 was never meant to be a business-as-usual scenario, but as a high-end scenario, consistent with the highest emissions scenarios in the literature.
“Clearly, RCP8.5 is a possible no-climate policy world. But it is surely not the only one, and in terms of the level of GHG emissions, it is not the most likely. One can only get that high by a combination of factors, e.g. high population growth and a lot of coal use (as in the original RCP8.5 scenario) or high economic growth and strong reliance on fossil fuels (in the current SSP5 version). But an emission level leading to a forcing level of around 6-7 W/m2 can be achieved by many more scenarios, not only by medium assumptions for many factors (RCP6.0) but also by high population growth and low economic growth or the exact opposite.
“In other words, even if the specific RCP6.0 scenario is not necessarily more likely than any other scenario, a forcing level in that order-of-magnitude might be more likely based on the central limit theorem.”
In the paper detailing the RCP8.5 scenario, Dr Keywan Riahi and colleagues described RCP8.5 as depicting “a high-emission business as usual scenario”. They meant that it was on the higher end of “business as usual” baseline scenarios in the literature, but their description of RCP8.5 as “business as usual” ended up sticking without any of the accompanying nuance.
As Riahi tells Carbon Brief:
“RCP8.5 is, because of its assumptions of high population and slow technological progress, on the higher end of the range of possible baseline scenarios…I wished I would have been clearer with what I meant by business as usual in that paragraph.”
The high-end nature of the RCP8.5 relative to other no-policy baselines was poorly communicated to the wider scientific community, and RCP8.5 – being the only available RCP scenario with no climate policy included – came to be widely referred to as the “business as usual” outcome in hundreds of different papers published in the aftermath of the IPCC AR5.
In reality, it is more properly considered to be one of the worst case emissions outcomes, as according to van Vuuren and colleagues, more than 90% of the other no-policy baseline scenarios in the literature result in lower emissions.
The new SSP scenarios
In 2017 the Shared Socioeconomic Pathways (SSPs) were finally published – about five years later than originally envisioned by Richard Moss and colleagues. The SSPs integrate different sets of population, economic growth, and other socioeconomic assumptions into future emissions scenarios. They consider both a wide range of potential no-policy baseline scenarios, as well as how different mitigation scenarios could be attained under different socioeconomic pathways.
The SSPs contain a range of baseline scenarios spanning between 5.0 and 8.5 W/m2 of radiative forcing by 2100. They also specifically consider mitigation scenarios where forcing is limited to 6.0, 4.5, 3.4, 2.6 and 1.9 W/m2. As computational limitations prevent scientists from running all the SSPs through every climate model, a number of “marker” scenarios were chosen at different forcing levels to be used in CMIP6 – the global climate modelling exercise currently being undertaken in the runup to the IPCC AR6.
CMIP6 will include the same four forcing levels found in the RCPs – 8.5, 6.0, 4.5, and 2.6 – in addition to new 1.9, 3.4 and 7.0 forcing scenarios. Both the 8.5 and 7.0 scenarios are taken from no-policy baseline emission scenarios in the SSP database, while all the other forcings use emissions scenarios where some level of mitigation is employed.
The figure below shows CO2 emissions in four of the CMIP6 scenarios – 8.5 (red line), 7.0 (orange), 6.0 (yellow) and 4.5 (blue) – compared to the range of no-policy baseline scenarios in the SSP database in grey.
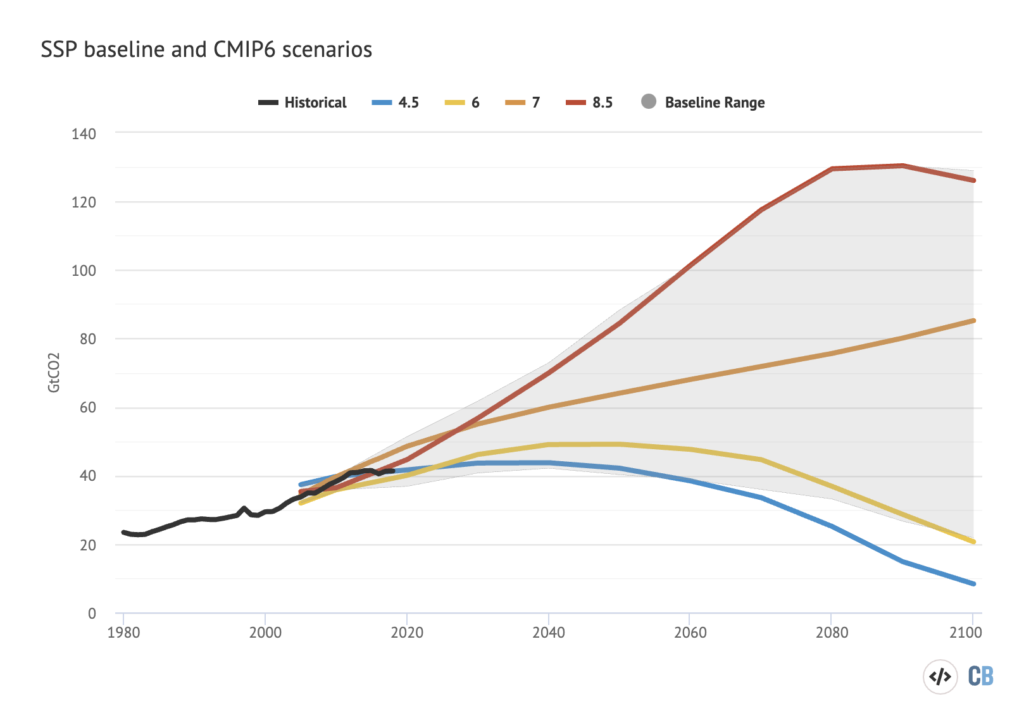
The new 8.5 scenario represents the highest emissions no-policy baseline scenario of any developed in the SSP process. The 7.0 scenario is near the middle of the pack, while the 6.0 scenario is near the lower-end of what models suggest is possible in the absence of concerted mitigation efforts driven by climate policy.
The 8.5 scenario is similar to the original RCP8.5, though it features around 20% higher CO2 emissions by the end of the century and lower emissions of other greenhouse gases. It was a scenario that the IAMs had some trouble generating; of the five socioeconomic pathways examined, only one – SSP5 – could produce a scenario with emissions that high. In their paper outlining the SSPs, Riahi and colleagues suggest that “8.5 W/m2 can only emerge under a relatively narrow range of circumstances. In contrast, an intermediate baseline (SSP2) only produces a forcing signal of about 6.5 W/m2 (range 6.5–7.3 W/m2).”
(There are several reasons for the difference between the new and old RCP8.5 scenarios. The former is based on a different IAM from the latter – REMIND instead of MESSAGE. The new scenario is also based on very different socioeconomic assumptions; while RCP8.5 featured very high population growth and relatively low economic growth, the new 8.5 scenario has low population growth – with global population peaking in 2050 and declining back down to current levels by 2100 – coupled with very high economic growth.)
One particular aspect of both the RCP8.5 and the new SSP 8.5 scenarios that has drawn quite a bit of criticism from energy researchers are their assumptions around future coal use. Reaching the CO2 emissions in these scenarios requires a large-scale increase in coal use – with 6.5 times more coal use in 2100 than today.
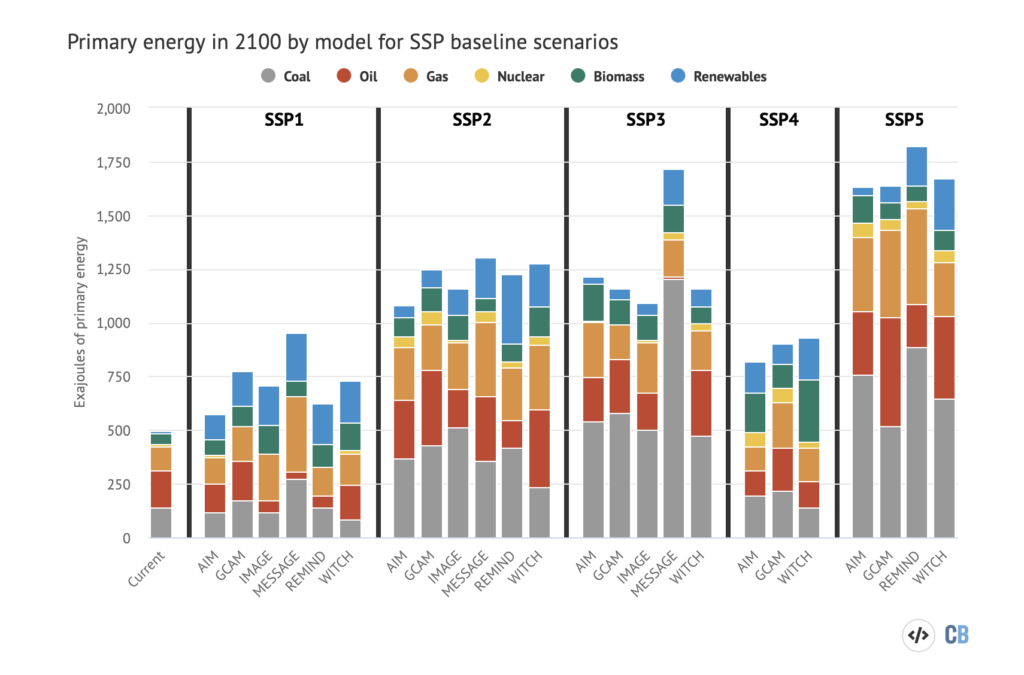
The figure below shows the global primary energy mix in 2100 in each of the different baseline scenarios examined in the SSP database. Coal use ranges widely across the baseline scenarios, from as low as today’s levels in SSP1 and SSP4 to many times today’s levels in the SSP5 baseline scenario generated by the REMIND IAM – which is the basis of the CMIP6 8.5 scenario.
The timeseries of coal use in these models is shown in the figure below, which includes all baseline and mitigation SSP scenarios – shown as thin lines – with the marker scenarios being used in CMIP6 highlighted with solid lines.
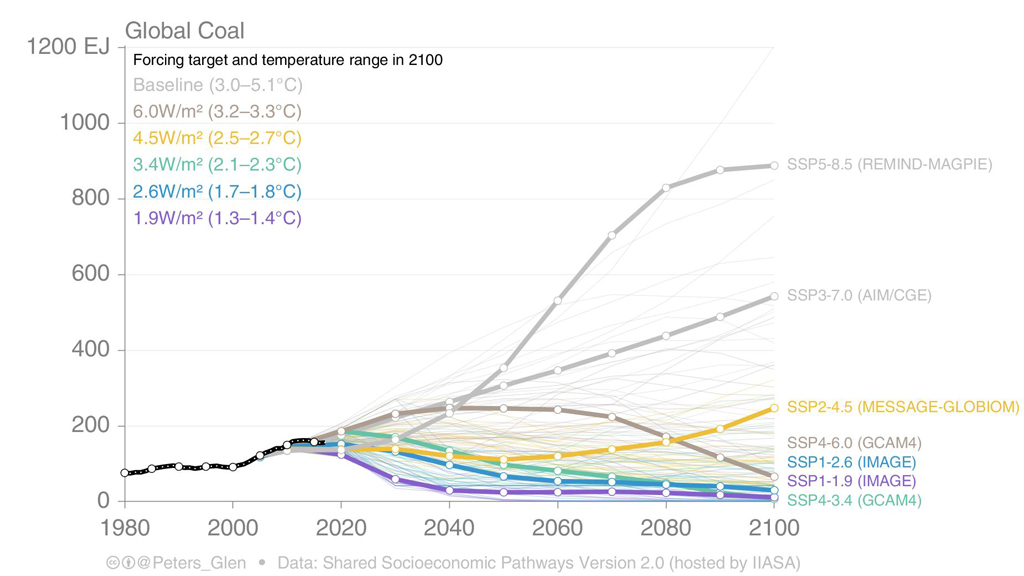
With global coal use having declined slightly since its peak in 2014, it is hard to envision a world where coal expands this dramatically in the future even in the absence of new climate policies. This is particularly true given the falling prices of alternative energy technologies in recent years. A forthcoming “expert elicitation” – where energy experts were asked to assess the likelihood of various outcomes – gives RCP8.5 only a 5% chance of occurring among all the possible no-policy baseline scenarios.
At the same time, however, it is important to recognise that predicting future emissions is inherently extremely uncertain. For example, a recent study co-authored by Nobel prize winning economist Bill Nordhaus argued that the world has a 35% chance of exceeding RCP8.5 by the end of the century. While most energy researchers think emissions of the magnitude in RCP8.5 are quite unlikely, they are by no means impossible.
Modelling high-forcing scenarios like RCP8.5 can be a useful scientific endeavour even if they do not represent particularly likely outcomes. For example, high-forcing scenarios have a much higher signal-to-noise ratio for the detection of significant changes in the climate system. In other words, because global temperature rise is more prominent in these scenarios, it is easier for researchers to isolate the climate change signal in model simulations. This is particularly useful for “attribution” studies that aim to identify the contribution of human-caused warming to climate impacts, as compared to natural variability. RCP8.5 is also used for consistency, as it was included in the past IPCC modeling effort – CMIP5 – and is similar to scenarios included in IPCC reports prior to that (such as A2 and A1F1 in the SRES scenarios).
There are also large uncertainties in carbon cycle feedbacks, where even relatively low emissions can potentially lead to higher forcing than assumed in IAMs. The way the CMIP climate model experiments are designed limits the ability of models to take carbon cycle feedbacks into account, as all models are required to use the same set of forcings to allow for easier comparisons between different models.
When researchers looked at what would happen if climate models were run using the emissions scenario underlying RCP8.5 – rather than the fixed set of forcings in CMIP – they found that CO2 concentrations were, on average, 44 parts per million (ppm) higher and radiative forcing was around 0.25 W/m2 higher. Put simply, given RCP8.5 emissions, models ended up with 8.75 W/m2 forcing on average, rather than 8.5 W/m2.
This means that the warming impact of human-caused emissions might be higher than the IAMs assume. And as CMIP6 models incorporate better physical representations of carbon cycle feedbacks such as thawing Arctic permafrost, the magnitude of these carbon cycle feedbacks may increase.
As van Vuuren tells Carbon Brief:
“It is important to have a high-end baseline scenario to explore what ‘could’ happen. And really, forcing levels of around 8.5 W/m2 are not implausible. In additional to the socioeconomic factors accounted for in RCP8.5, strong GHG feedbacks (methane emissions from tundra, for instance) could also lead to high forcing levels. And climate outcomes consistent with RCP8.5 could emerge from a relatively sensitive climate system. So exploring the high-end if useful – but clearly, for transparency, it should be indicated that RCP8.5 is a high-end scenario.”
Beyond business as usual
Baseline “no-policy” scenarios can be useful counterfactuals in climate change research, casting light on what might happen to the world in the absence of climate policies. At the same time, however, they are tricky to interpret given the rapid rate of technological progress. A world where global coal expansion continued unabated may have been a quite reasonable assumption in 2010, but seems quite unlikely in 2019 even without any new climate policies.
In many ways the world has moved beyond old “business as usual” scenarios through a combination of technological innovation and climate policies already enacted by countries over the past decade. These have caused technology to change in a way that is highly unlikely to be reversed. It is for this reason that Peters recently described “no-policy” scenarios as “problematic”:
It is like saying “let’s undo the limited progress we have made in the last 10-20 years, & rerun history where we try and burn as much CO2 as we can”.
— Glen Peters (@Peters_Glen) August 11, 2019
Van Vuuren tells Carbon Brief that while RCP8.5 looked more plausible back when it was originally created, progress over the past decade has made it considerably less likely:
“RCP8.5 has probably become less likely compared to 2008-2011, when the scenario was developed and published. The reason is that since that time several countries and companies have adopted climate policy inspired by the Paris Agreement, but also the costs of solar photovoltaics and wind have come down much more rapidly than originally expected. Again, it does not mean that the scenario is implausible – and thus not relevant as a scenario to explore high-end forcing – but it is probably not the most likely business-as-usual case. It wasn’t originally, and it isn’t now.”
While useful for examining what might have been, these no policy baselines are not necessarily the most useful scenarios to use for projecting future climate impacts. The odds of every nation on Earth abandoning Paris Agreement commitments and returning to burning massive amounts of coal seem quite low, though perhaps not impossible given the environmental policies of some ascendent populist movements.
At the same time, there have been some claims – prominently in the US Fourth National Climate Assessment – that current emissions are tracking the RCP8.5 scenario. While emissions have been in the upper half of projections made over the past few decades, it is difficult to see how these necessarily put the world more on-track toward future forcing levels of 8.5, 7.0, or 6.0.
While it is clear that the world is not currently moving in the direction of mitigation scenarios consistent with Paris Agreement targets, it is much harder to use current emissions to determine which no-policy baseline is most likely much later in the century.
The figures below show how historical emissions (black line) compare to the four RCP scenarios as well as the older SRES and IS92 scenarios. Fossil fuel CO2 emissions are shown in the left figure, while the right one shows total CO2 emissions including land use change.
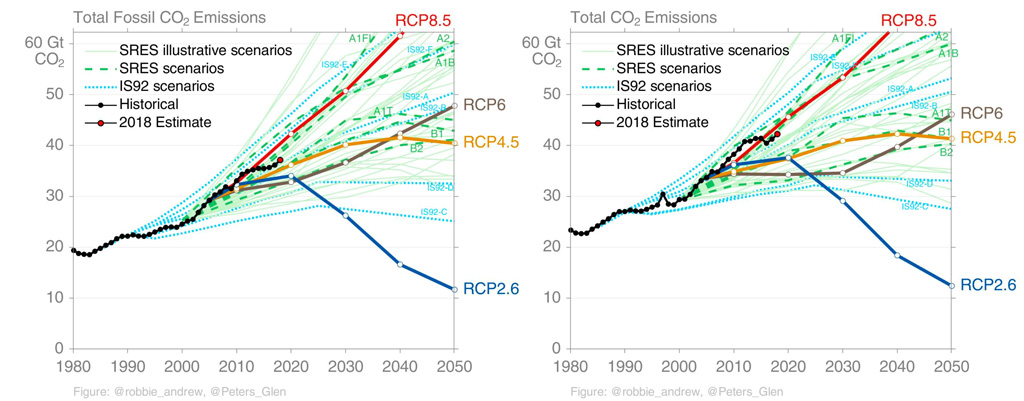
As Peters tells Carbon Brief:
“All scenarios will look like they are on track in the early years, as they are always set to the same base year. I don’t think it is possible to say, with aggregated CO2, if we are on track with any scenario in particular.”
The literature around the development of RCP8.5 makes it clear that the scenario represents the high-end of possible baseline emissions scenarios rather than the most likely “business as usual” outcome. The original paper outlining the RCPs suggest that there is no reason to think that a high-emission RCP8.5 baseline would be any more likely than a lower emission RCP6.0 baseline in a no-policy world.
However, its position as the only non-mitigation scenario considered in the IPCC AR5 along with relatively poor communication between energy modelling and climate modelling communities led to a widespread misperception both in the media and in the academic literature that RCP8.5 was the expected “business as usual” outcome in a world without any future climate policy.
While worst-case outcomes are important to take into account, particularly given the uncertainties in the magnitude of carbon cycle feedbacks, it is important that they not be considered in isolation. Taking the range of possible baseline outcomes from 6.0 to 8.5 W/m2 forcing would provide a more realistic set of scenarios for studying climate impacts in a no-policy future.
Update: This article was updated on 22/08/2019 to add in quotes from Prof Detlef van Vuuren
-
Explainer: The high-emissions ‘RCP8.5’ global warming scenario
-
The origins and controversies of the RCP8.5 global warming scenario