
Explainer: What climate models tell us about future rainfall
Zeke Hausfather
01.19.18Zeke Hausfather
19.01.2018 | 8:00amMuch of the public discussion around climate change has focused on how much the Earth will warm over the coming century. But climate change is not limited just to temperature; how precipitation – both rain and snow – changes will also have an impact on the global population.
While the models used by climate scientists generally agree on how different parts of the Earth will warm, there is much less agreement about where and how precipitation will change.
In the fifth and final article in our week-long climate modelling series, Carbon Brief explores where the models agree and disagree about future changes in precipitation.
Move evaporation and more water vapour
There are some basic physical processes that inform scientists’ expectations of how precipitation will respond in a warming world. With higher temperatures comes greater evaporation and surface drying, potentially contributing to the intensity and duration of drought.
However, as the air warms its water-holding capacity increases, particularly over the oceans. According to the Clausius-Clapeyron equation, the air can generally hold around 7% more moisture for every 1C of temperature rise. As such, a world that is around 4C warmer than the pre-industrial era would have around 28% more water vapour in the atmosphere.
![]()
But this increased moisture will not fall evenly across the planet. Some areas will see increased precipitation, while other areas are expected to see less due to shifting weather patterns and other factors.
The figure below shows projected percentage change in precipitation between the current climate (represented by the 1981-2000 average) and the end of the century (2081-2100) in the average of all of the climate models featured in in the latest Intergovernmental Panel on Climate Change (IPCC) report (CMIP5), using the high-end warming scenario (RCP8.5).
Purple colors show areas where precipitation will increase, while orange areas indicate less future rain and snow.
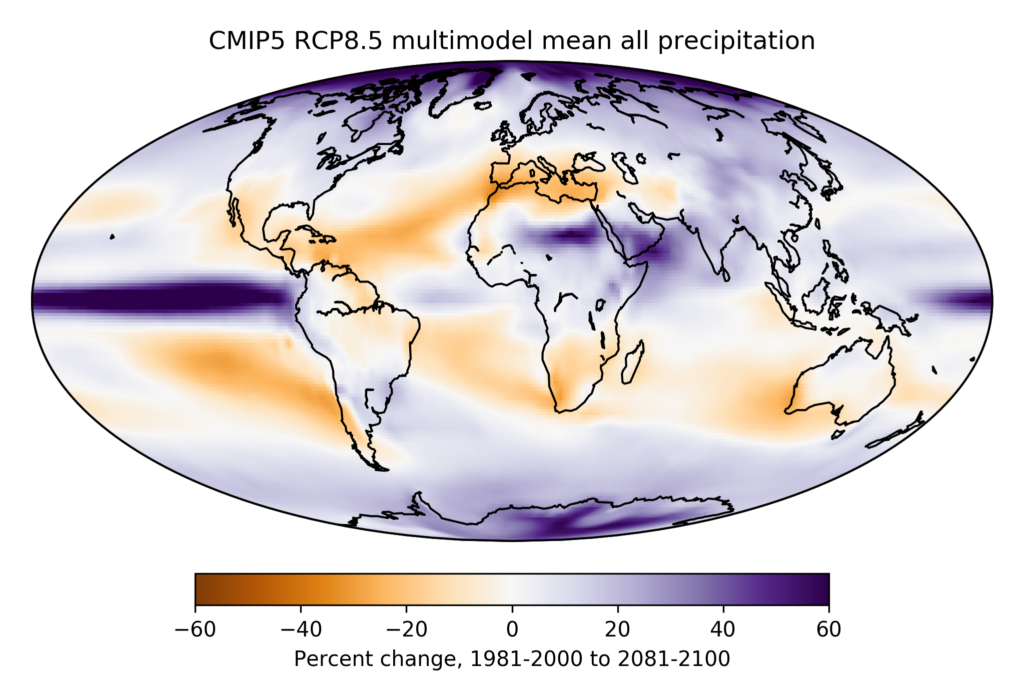
CMIP5 RCP8.5 multimodel average percent change in total precipitation (rain and snow) between 1981-2000 and 2081-2100. Uses one run for each model, 38 models total. Data from KNMI Climate Explorer; map by Carbon Brief.
On average, warming is expected to result in dry areas becoming drier and wet areas becoming wetter, especially in mid- and high-latitude areas. (This is not always true over land, however, where the effects of warming are a bit more complex.)
The average of the models shows large increases in precipitation near the equator, particularly in the Pacific Ocean. They also show more precipitation in the Arctic and Antarctic, where cold temperatures currently limit how much water vapour the air can hold.
The Mediterranean region is expected to have around 20% less precipitation by 2100 in an RCP8.5 world, with similar reductions also found in southern Africa. Western Australia, Chile, and Central America/Mexico may all become around 10% drier.
![]()
These changes tend to increase proportionately with warming; if the Earth warmed only 2C in an aggressive mitigation scenario such as RCP2.6 rather than 4C, the percent change in precipitation would be roughly half as large.
However, the simple picture painted by the average of all the models shown above hides profound differences. There are actually relatively few areas that all the models agree will become wetter or drier. Climate models are not perfect and projections of future average precipitation changes may become more consistent as models continue to improve.
Regional differences
There are 39 different climate models within CMIP5 that provide estimates of precipitation changes in the future. Unlike for temperature, where models show a general degree of agreement about future regional changes, different models may have the same region becoming much wetter or much drier in a warming world.
The figure below shows expected percent change in precipitation between the current climate and the end of the century in Australia, with purple areas indicating increased precipitation and orange indicating reductions. While the average of all the models – shown on the left – has a modest 5 to 10% reduction in precipitation over most of the country, some individual models show much greater changes.
For example, the Australian CSIRO model – middle panel – projects precipitation decreases of around 50% on average by the end of the century. In stark contrast, the Chinese FGOALS model projects a 30% average increase in precipitation by 2100, with almost no areas experiencing less rainfall.
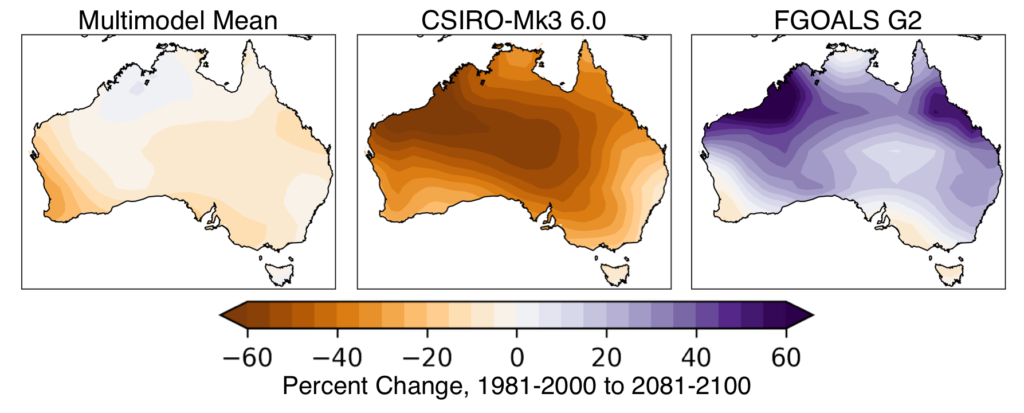
CMIP5 RCP8.5 multimodel mean percent change in total precipitation (rain and snow) between 1981-2000 and 2081-2100 for Australia, as well as individual CSIRO-Mk3 and FGOALS runs. Data from KNMI Climate Explorer; maps by Carbon Brief.
Similar results can be found for many other regions of the world. The figure below shows the driest projection and wettest projections for each different part of the world across all the CMIP5 models, represented by the 10th and 90th percentile of all the models (e.g. the 10% of models that show the most reduction in precipitation and the 10% that show the most increase in precipitation for any region of the world).
In at least one model much of the world outside high-latitude areas and the tropical oceans shows sizable drying. Similarly, you can find at least one model where nearly any given location in the world gets wetter.
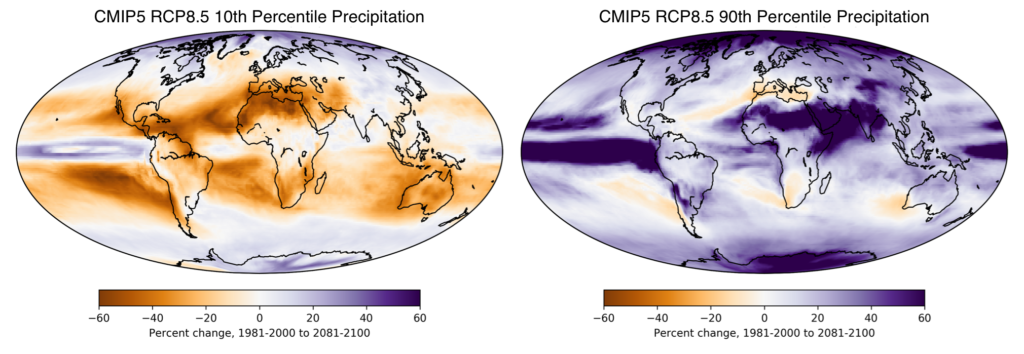
RCP8.5 10th percentile of mean precipitation change (left map) and 90th percentile (right map) for total precipitation (rain and snow) for each 1×1 latitude/longitude gridcell between 1981-2000 and 2081-2100. Uses one run for each model, 38 models total. Data from KNMI Climate Explorer; maps by Carbon Brief.
This means that average annual precipitation projections by climate models should be approached cautiously. This creates a challenge decision-makers who need to plan for changes that will occur in their country, as relying on the output of any one model may mask dramatic disagreements.
However, disagreements between the models in future precipitation changes in some regions does not mean that the models are useless for this purpose.
Where do models agree?
While models disagree on how average precipitation will change in many parts of the world, there are some areas where nearly all the models tell the same story about future changes.
The figure below shows the same annual average change in precipitation between today and the end of the century, but adds dots to indicate areas where at least nine out of 10 models agree on the direction of change.
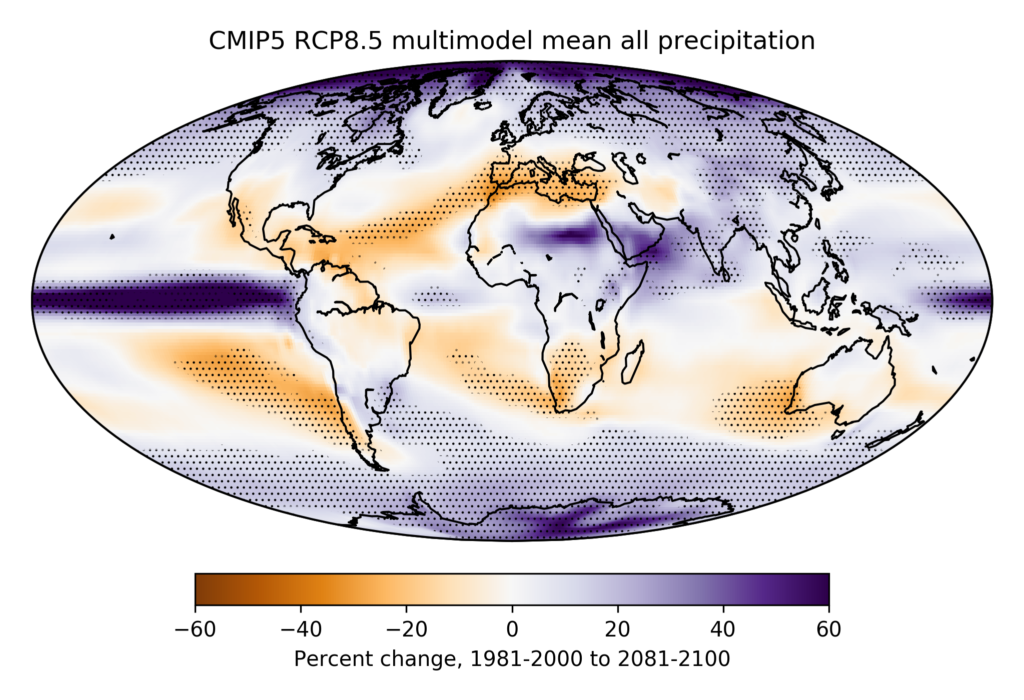
As first figure, but with areas where 90% of the models agree on the sign of the change highlighted with dots. Data from KNMI Climate Explorer; map by Carbon Brief.
Here there is widespread agreement among the models that both the tropical Pacific and high-latitude areas will have more precipitation in the future. India, Bangladesh and Myanmar will all become wetter, as will much of northern China.
The models largely agree that the Mediterranean region and southern Africa will have less precipitation in the future. They also agree on reduced precipitation in southwest Australia around Perth, in southern Chile, the west coast of Mexico and over much of the tropical and subtropical Atlantic ocean.
Interestingly, despite all the focus on drought in the state of California, there is no consensus among climate models that the region will experience less precipitation on average in a warmer world.
Different changes in different seasons
A limitation of looking at annual precipitation changes is that they can mask some seasonal effects.
The figure below shows projected changes in future precipitation broken down by season, along with dots in regions where at least nine out of 10 of models agree on the direction of the change for each season.
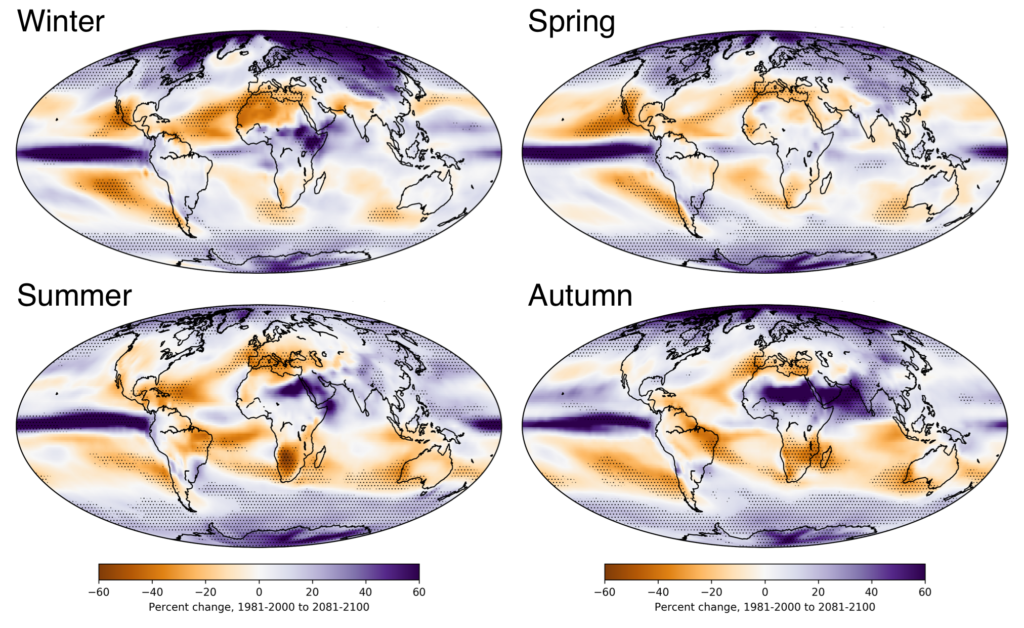
Same as prior figure, but broken down by season. Data from KNMI Climate Explorer; maps by Carbon Brief.
A few things stand out when looking at projected seasonal changes. In winter there are greater reductions in precipitation projected over northern Africa, but no agreement on increases in precipitation over India or much of South Asia.
In spring, models agree that southern California will experience less rainfall. In summer, reductions in precipitation in southern Africa are particularly strong, while in autumn increases in rainfall over India, Bangladesh and the Sahara region all stand out.
Increases in extreme precipitation
Models also generally agree that precipitation, when it does occur, will become more intense nearly everywhere. Unlike average annual precipitation, almost the entire world is expected to see an increase in extreme precipitation as it warms.
Models suggest most of the world will have a 16-24% increase in heavy precipitation intensity by 2100. In other, words, heavy rain is likely to get heavier.
You can see this in the figure below. Here percent changes in heavy precipitation events by the end of the century are shown per degree warming that we experience, and dots represent areas of the map where 90% of the models agree. Red areas show decreases in heavy precipitation, while blue areas indicate increases.
The largest increases in heavy precipitation events on land are expected to occur over central Africa and South Asia. On the other hand, North Africa, Australia, Southern Africa, and Central America may not see a noticeable increase in heavy precipitation.
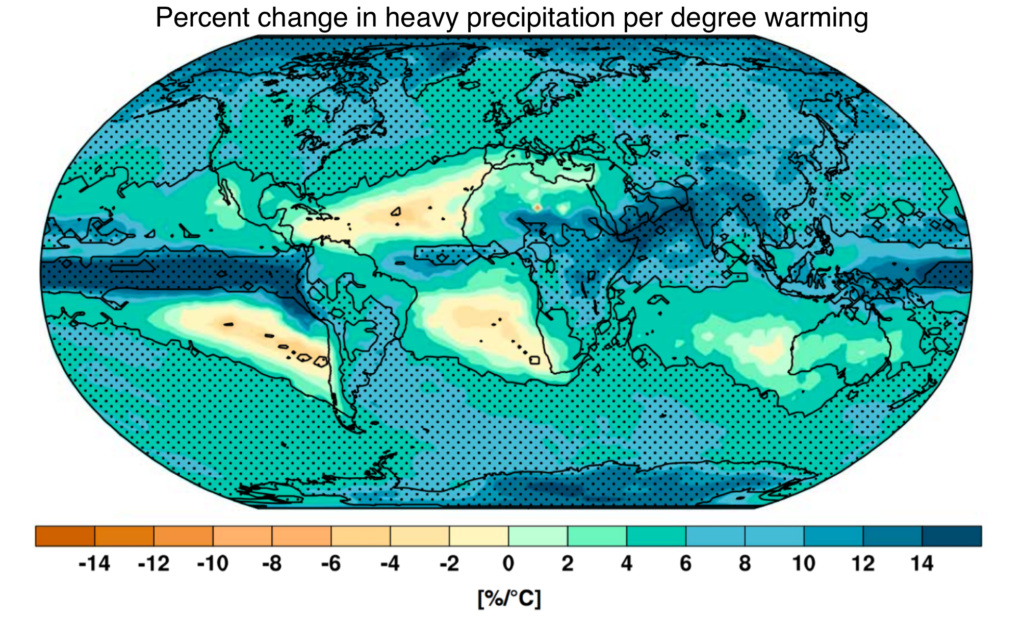
Percent change in heavy precipitation per degree warming, defined as the heaviest daily precipitation event of the year for each location. Figure adapted from Fischer et al 2014.
Temperature and precipitation influence drought
While changes in rainfall and snow in a warming world are highly uncertain for many parts of the world, changes in future precipitation are only part of the story.
Just as important is temperature, which influences whether precipitation takes the form of snow or rain and controls how much “snowpack” accumulates.
The snowpack is the snow that accumulates in mountains during winter and provides fresh water to the valleys below as it melts in spring and summer. It is an important contributor to many rivers, and impacts river flow and water availability for agriculture, particularly in regions, such as California, where precipitation is concentrated in winter.
Temperatures also impact the rate of evaporation, with higher temperatures leading to faster soil moisture loss and an increased need for irrigation in agriculture.
This means that, even for regions that are likely to get wetter, this will be largely offset by temperature-driven drying.
As Dr Benjamin Cook at the NASA Goddard Institute for Space Studies tells Carbon Brief, while changes in future precipitation is uncertain, the drying associated with warmer temperatures is much more widespread:
“The drought-climate change story is actually pretty complicated. While the impact of climate change on precipitation is fairly uncertain, we do expect with warming that many areas will experience more soil moisture droughts and declining runoff and streamflow resulting in an overall increase in drought risk and severity.
“The general consensus is that precipitation will decline in subtropical regions, places like the [US] Southwest and the Mediterranean. But the warming effect and impact of warming on evapotranspiration and associated drying happens over a much, much larger region.”
Conclusion
Changes in average precipitation is much more difficult for climate models to predict than temperature. There are many parts of the world where models disagree whether there will be more or less rain and snow in the future. However, there are some regions, particularly the Mediterranean and southern Africa, where nearly all models suggest rainfall will decrease. Similarly, increases in rainfall are expected in high latitude areas, as well as much of South Asia.
There is much more agreement by the models that a warming climate will increase the severity of extreme rainfall and snowfall almost everywhere. A warmer world will, they project, also increase soil evaporation and reduce snowpack, exacerbating droughts even in the absence of reduced precipitation.