
Gas from Norway, coal from Russia: eight graphs on the UK energy system
Robin Webster
04.12.13Robin Webster
12.04.2013 | 2:00pmImage: Oil platform in Tromsø. Credit: V. Belov/Shutterstock.com.
The UK’s dependence on energy imports has increased to its highest level since 1976, according to statistics released by the Department for Energy and Climate Change (DECC). Here’s the story of the UK’s dependence on imported fuels in eight graphs.
DECC released the data at the end of March, about a month after the chief executive of energy regulator Ofgem warned that the country’s dependence on imported fuels could drive up consumer energy bills.
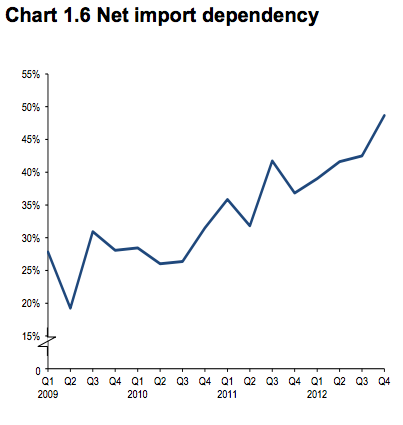
1. Energy import dependency
The UK is producing decreasing amounts of energy at home. Between 2009 and the end of 2012, the total amount of fuel the country imported in order to generate heat and electricity and put cars on the road rose by 7.1 per cent a year:
2. Declining gas production
The UK’s production of natural gas is in long-term decline as supplies in the North Sea run out. But production fell even more sharply last year following a gas leak, and it hasn’t bounced back yet.
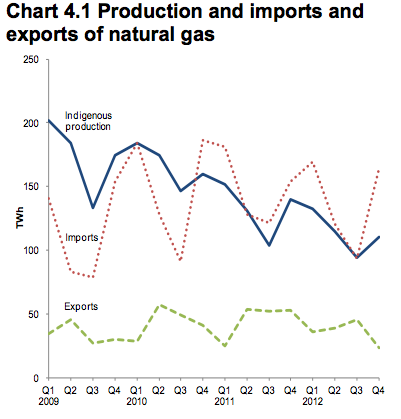
The UK is heavily dependent on gas – in 2011 gas accounted for just under 30 per cent of final energy consumption, although the figure fell slightly in 2012. Since 2004, the majority of this supply has come from imports. This means that the country’s gas prices, and consumer energy bills, are vulnerable to fluctuations in the international price.
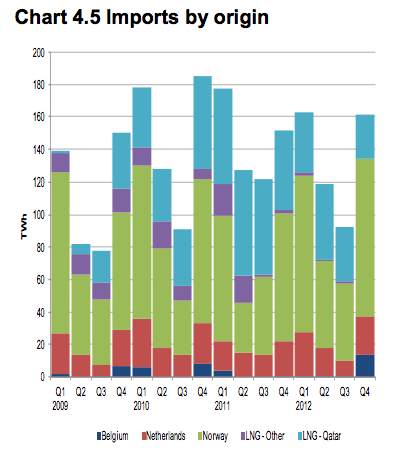
3. Where does the UK’s gas come from?
International politics has been influenced by European fears about dependence on Russian gas for some time.
But in 2012, the majority of the country’s gas came from Norway. It also got some gas from the general European network via pipelines – or interconnectors – that run under the sea from Belgium and the Netherlands. These interconnectors can be used to import or export gas as needed, and in 2012 they were switched from export to import mode.
The rest came in liquid form, in supertankers, from Qatar:
4. Production of coal also going down
The country isn’t just dependent on imported gas – it also gets the majority of its coal from overseas. In the late 1960s there were 1,334 deep coal mines in the UK. But since the 1970s the amount of coal the country produces has been in long-term decline:
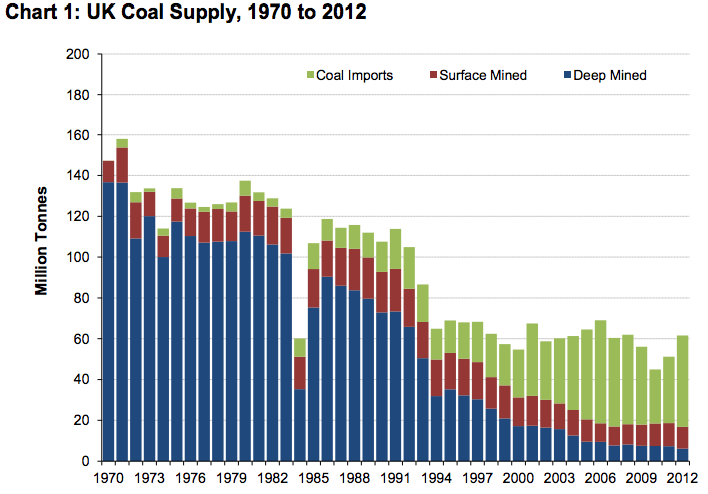
In 2012 UK coal production fell to an all-time low. Conversely a rise in the price of gas also pushed up demand for coal. The amount of coal used to generate electricity last year was the highest since 2006.
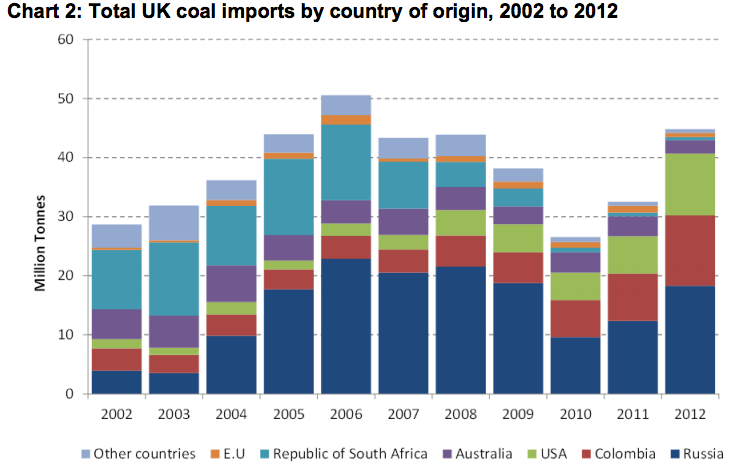
5. Where does the UK’s coal come from? (Russia)
Quite a lot of this coal came from Russia. Steam coal – suitable for use in producing steam, which is used to generate electricity – represented about 89 per cent of total coal imports in 2012. 96.1 per cent of UK steam coal imports came from just three countries in 2012 – Russia, Colombia and the USA.
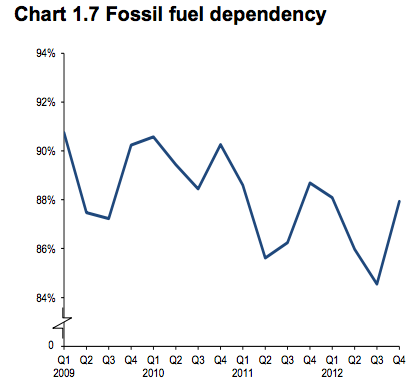
6. Dependency on fossil fuels vs renewables
Finally, on a slightly more optimistic note, the country’s dependency on fossil fuels also reached a record low of 86.8 per cent in 2012:
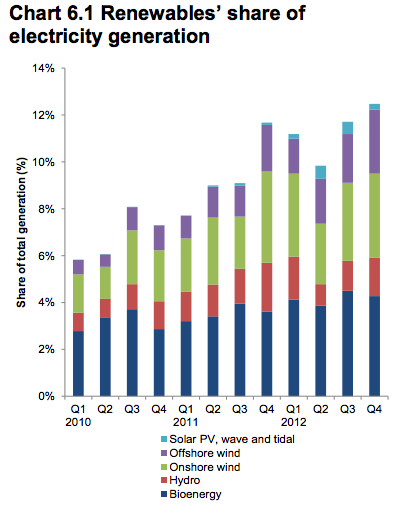
7. Renewables going up
As generation from fossil fuels is declining, generation from low-carbon sources is increasing. But low-carbon means both nuclear and renewables, which have different implications for energy security. Generating electricity from nuclear requires the country to import uranium. In contrast the country produces most of its renewable power at home – although not all, as it imports some bioenergy.
The amount of electricity the UK generated from renewables increased from 9.4 per cent in 2011 to a record 11.3 per cent in 2012. The amount of electricity produced from offshore wind saw the biggest jump, increasing by 46 per cent between 2011 and 2012:
8. Feed in Tariffs going up – a lot
The government hopes to get about 35 per cent of the UK’s electricity from renewables by 2020, so there is still a way to go. But the growth in the Feed-in Tariff scheme – which largely subsidises solar panels for homes and businesses – shows how a popular policy measure can boost uptake:
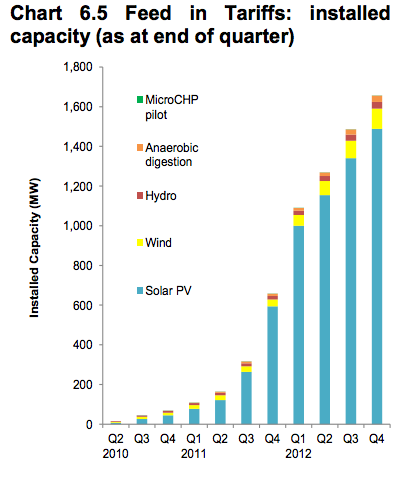
By the end of 2012, there were 358,000 participants in the FiT scheme, an 8.3 per cent increase from the year before. Its popularity – and cost – did however take the government a bit by surprise, with the result that it cut the subsidy levels. The story of FiTs shows what can be done to boost uptake of renewables. How much it will cost is a bit more of an unpredictable question.