Global CO2 emissions have been flat for a decade, new data reveals
Zeke Hausfather
11.04.21Zeke Hausfather
04.11.2021 | 12:01amGlobal carbon dioxide (CO2) emissions from fossil fuels and cement have rebounded by 4.9% this year, new estimates suggest, following a Covid-related dip of 5.4% in 2020.
The Global Carbon Project (GCP) projects that fossil emissions in 2021 will reach 36.4bn tonnes of CO2 (GtCO2), only 0.8% below their pre-pandemic high of 36.7GtCO2 in 2019.
The researchers say they “were expecting some sort of rebound in 2021” as the global economy bounced back from Covid-19, but that it was “bigger than expected”.
While fossil emissions are expected to return to near-record levels, the study also reassesses historical emissions from land-use change, revealing that global CO2 output overall may have been effectively flat over the past decade.
The 2021 GCP almost halves the estimate of net emissions from land-use change over the past two years – and by an average of 25% over the past decade.
These changes come from an update to underlying land-use datasets that lower estimates of cropland expansion, particularly in tropical regions. Emissions from land-use change in the new GCP dataset have been decreasing by around 4% per year over the past decade, compared to an increase of 1.8% per year in the prior version.
However, the GCP authors caution that uncertainties in land-use change emissions remain large and “this trend remains to be confirmed”.
The GCP study, which is not yet peer-reviewed, is the 16th annual “global carbon budget”. The budget also reveals:
- China and India both surpassed their 2019 emission peaks in 2021. Chinese emissions grew by 5.5% between 2019 and 2021, while Indian emissions grew by 4.4%.
- Chinese coal use was a particularly large driver of the global rebound in emissions, with the power and industry sectors in China the main contributors.
- Coal, oil and gas all fell during the pandemic, but both coal and gas emissions have already surpassed their pre-pandemic levels, with a 2% increase in gas emissions and a 1% increase in coal emissions between 2019 and 2021.
- Oil emissions remain around 6% below 2019 levels and this persistent reduction is one of the main reasons 2021 emissions did not set a new record.
The new updates to global CO2 emissions in the GCP substantially revise scientists’ understanding of global emissions trajectories over the past decade. The new data shows that global CO2 emissions have been flat – if not slightly declining – over the past 10 years.
However, falling land-use emissions have counterbalanced rising fossil CO2 emissions, and there is no guarantee these trends will continue in the future.
Major changes due to revised land-use emissions
The GCP has always reported on emissions from both fossil CO2 and from land-use change (LUC). Fossil CO2 emissions represent upwards of 90% of current global emissions and understandably tend to get most of the attention. However, the GCP researchers have long pointed out that the largest uncertainties in understanding of CO2 emissions comes from LUC, despite its relatively small contribution to the total.
The figure below shows global CO2 emissions from both fossil and LUC. The dashed light blue line shows the prior GCP estimate of global CO2 emissions, while the solid dark blue shows the new estimate. The shaded area represents the combined uncertainty from land use and fossil CO2 emissions in the new GCP estimate.
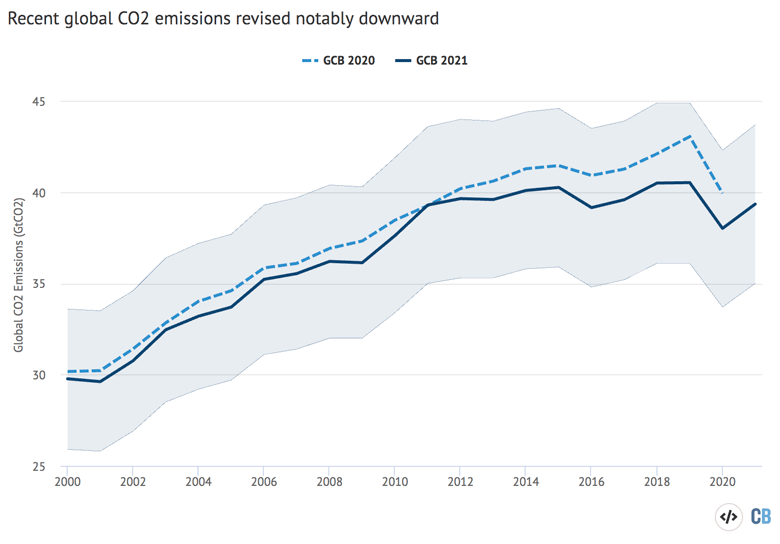
Annual total global CO2 emissions – from fossil and land-use change – between 2000 and 2021 for both the 2020 and 2021 versions of the Global Carbon Project’s Global Carbon Budget. Shaded area shows the estimated one-sigma uncertainty for the 2021 budget. Data from the Global Carbon Project; chart by Carbon Brief using Highcharts.
Previously, the GCP data showed global CO2 emissions increasing by an average of 1.4 GtCO2 per year between 2011 and 2019 – prior to Covid-related emissions declines. The new revised dataset shows that global CO2 emissions were essentially flat – increasing by only 0.1GtCO2 per year from 2011 and 2019. When 2020 and 2021 are included, the new GCP data actually shows slightly declining global emissions over the past decade, though this should be treated with caution due to the temporary nature of Covid-related declines.
The new GCP dataset also puts historical (1750-2020) cumulative emissions around 19 GtCO2 lower than in the prior 2020 version, roughly equal to half a year of current global emissions.
This would represent a slight (~4%, or half a year of current emissions) increase in the remaining “carbon budget” of around 460GtCO2 from the start of 2021 (which is 11.5 years of current emissions) to limit warming to 1.5C with a 50% likelihood.
Historical global fossil emissions are largely unchanged from their prior values in the new GCP data. There are some minor upwards revisions of fossil CO2 emissions of around 0.3 GtCO2 for most years over the past decade – and a somewhat larger upward revision of 0.7 GtCO2 for the year 2020.
The revision in global CO2 emissions is almost entirely due to revised land-use emissions. The figure below shows land-use emissions in the prior 2020 GCP data (light blue dashed line) and in the new 2021 data (dark blue solid line), as well as reported uncertainties.
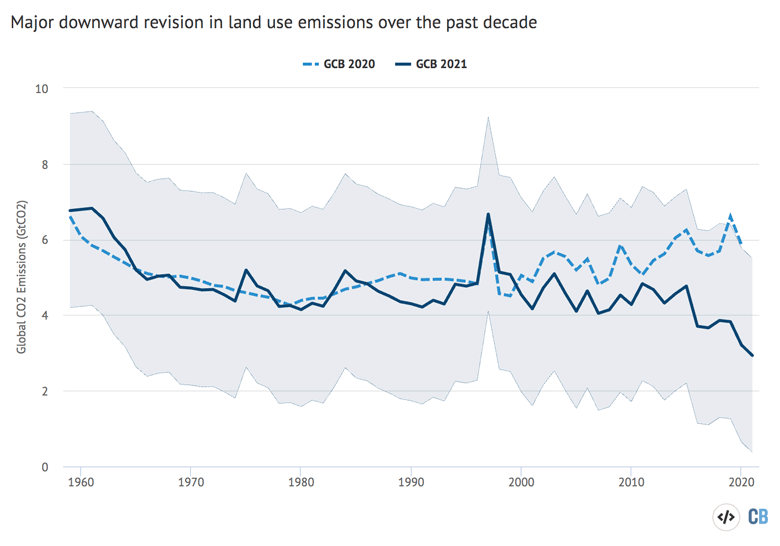
Annual global CO2 emissions from land-use change between 1959 and 2021 for both the 2020 and 2021 versions of the Global Carbon Project’s Global Carbon Budget. Shaded area shows the estimated one-sigma uncertainty for the 2021 budget. Data from the Global Carbon Project; chart by Carbon Brief using Highcharts.
While some modest changes have been made to LUC emissions estimates between 1959 and 2000, much larger changes are evident over the past two decades. In the prior report, LUC emissions were increasing notably between 2000 and 2020, growing by around a third.
The new dataset almost perfectly reverses this trend, suggesting that LUC emissions have actually declined by around a third since 2000. Over the past decade, LUC emissions went from increasing by 1.8% per year to decreasing by 4% per year in the latest version of the GCP data.
GCP uses the average of three different observational-based land-use change datasets, known as “H&N”, “BLUE” and ”OSCAR”. In the prior year’s GCP report these three approaches showed notable disagreements over the past decade, with H&N showing emissions declines, while BLUE and OSCAR showed emissions increases. However, revisions to both BLUE and OSCAR datasets in the past year have brought them more in-line with recent H&N trends.
All three datasets now show notable declines in emissions over the past decade – though differences remain in the magnitude of estimates between H&N and the other two datasets, as shown in the figure below.
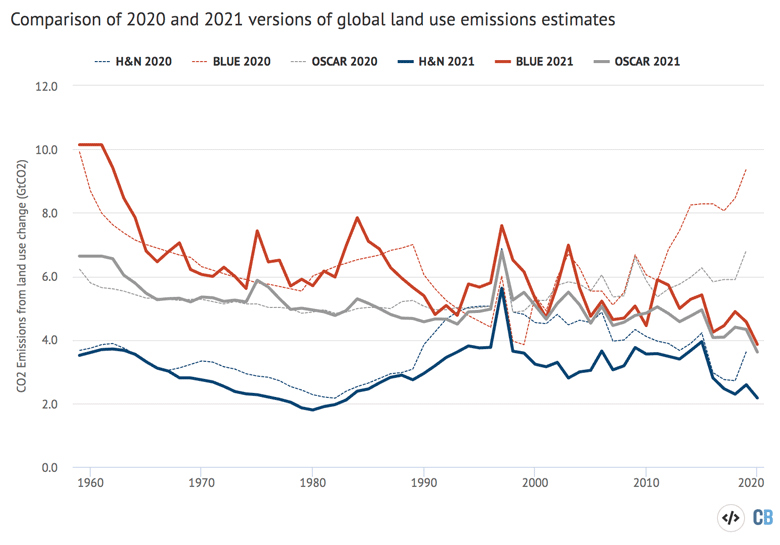
Annual global CO2 emissions from land-use change between 1959 and 2021 for the three bookkeeping methods used by the Global Carbon Project – H&N, BLUE, and OSCAR – for both 2020 and 2021 versions. Data from the Global Carbon Project; chart by Carbon Brief using Highcharts.
The fact that all three different datasets now agree on the declines in emissions is noteworthy. The GCP paper suggests that “there is a decrease in net CO2 emissions from land-use change over the last decade, in contrast to earlier estimates of no clear trend across LUC estimates”.
These revisions are primarily due to changes in underlying land-use data in the History database of the Global Environment (HYDE). HYDE now uses updated estimates of agricultural areas and land cover maps from satellites. This results in lower estimates of cropland expansion, particularly in tropical regions. The updated data also removes spurious interannual variability in forest cover that resulted in increased emissions due to assumed fast decay (e.g. clearing by fire) and slower regrowth.
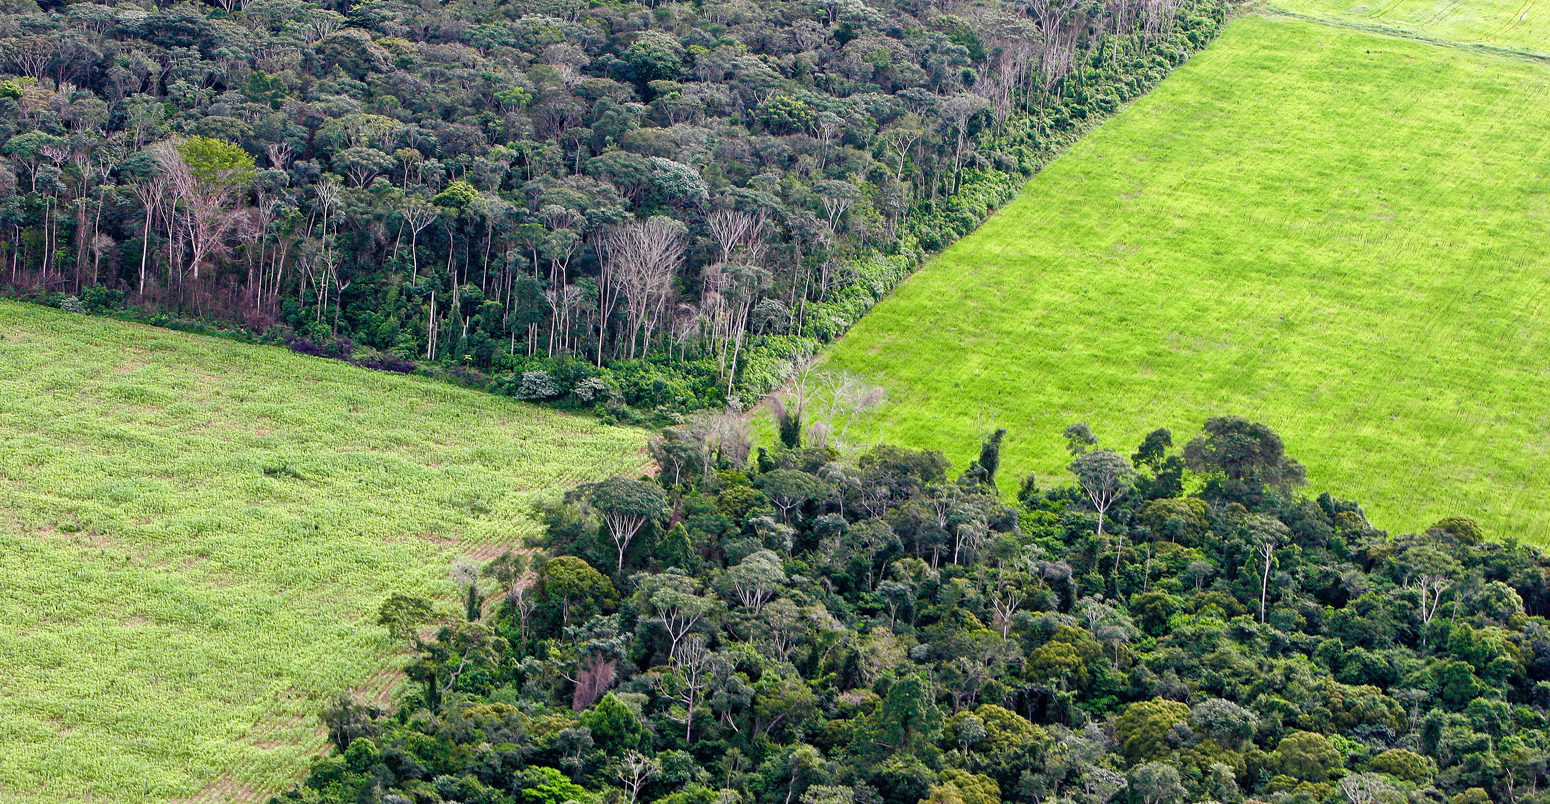
The authors caution, however, that their new estimates may not fully capture the rise in Brazilian deforestation in the past few years. It also does not include forest degradation – deterioration of forest ecosystems that does not involve a reduction in forested area – that may be contributing to some additional LUC emissions.
As Prof Julia Pongratz – the director of the Department of Geography at the Ludwig Maximilian University of Munich and a member of the GCP team – explains to Carbon Brief:
“It is too early to infer robust trends. More regional analysis is needed and accurate, high-resolution monitoring of land-use dynamics. Only then can we reduce the uncertainty around land-use emissions and their trends and their contributions to emissions reduction targets.”
China and India lead rapid rise in fossil CO2 emissions
Global fossil CO2 emissions declined rapidly during the height of the Covid-19 pandemic in 2020. While there were hopes that a “green recovery” could help keep emissions down, the world has seen a rapid rebound in fossil CO2 emissions in 2021 as the global economy has recovered. The rebound in global emissions has been led by China and India, who have both already surpassed their previous 2019 record highs.
Speaking at a media press briefing, Dr Glen Peters – research director at the Center for International Climate Research (CICERO) – said the researchers “were expecting some sort of rebound in 2021”, but that it was “bigger than expected”. He added:
“You could say the recovery packages have delivered more in emissions than we were hoping – a little bit too dirty in the recovery packages and not enough low-carbon expenditure.”
Prof Corinne Le Quéré – Royal Society research professor of climate change science at the University of East Anglia – noted that the decrease in emissions in 2020 was not a “structural decrease”. She explained:
“It is the difference between parking your car for a year and changing to an electric car. [The decline in emissions] was not [because of] measures that were put in place to tackle climate change and [so] they were never going to last.”
The figure below shows global CO2 emissions from fossil fuels, divided into emissions from China (red shading), India (yellow), the US (bright blue), EU (dark blue) and the remainder of the world (grey).
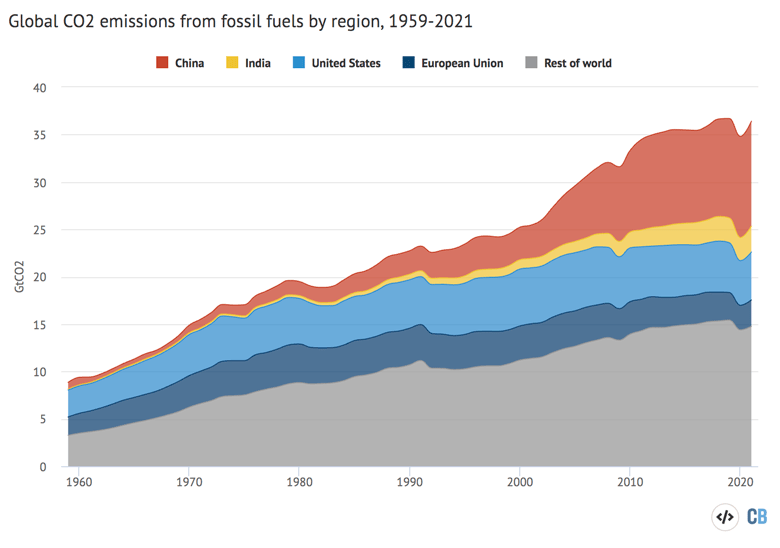
Annual fossil CO2 emissions by major country and rest of world from 1959-2021, in billions of tonnes of CO2 per year (GtCO2). Note that 2021 numbers are preliminary estimates. Data from the Global Carbon Project; chart by Carbon Brief using Highcharts.
After a rapid increase in global fossil CO2 emissions of around 3% per year between 2001 and 2010, emissions only grew by around 1% per year between 2011 and 2019. The onset of Covid-19 – and early predictions of a potential long global economic slowdown – led to some discussion about global emissions potentially having peaked in 2019.
However, the recovery in global emissions in 2021 has been notably faster and more emissions-intensive than forecasted last year. For example, the IEA’s 2020 World Energy Outlook (WEO) projected that global emissions would not surpass 2019 levels until nearly 2030; by contrast, the recent 2021 WEO projects that global emissions will rebound past 2019 levels by 2022 or 2023.
While global emissions – and those of most countries – will remain below 2019 levels in 2021, both China and India stand out among major emitters as having notably larger emissions despite the pandemic. The figure below shows the change in both global emissions and in major emitting countries and regions between 2019 and 2020 (blue bars), 2020 and 2021 (yellow bars), and between 2019 and 2021 (red bars).
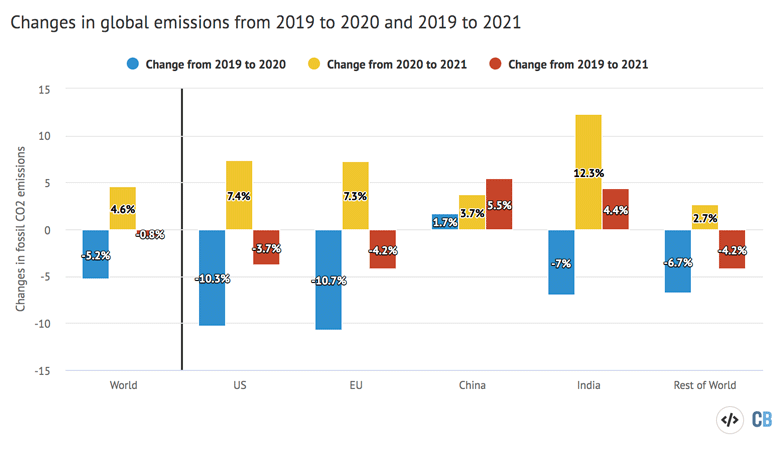
Percent change in CO2 between 2019 and 2020, 2021 and 2021, and between 2019 and 2021 for the world as a whole and for major emitting countries/regions. Data from the Global Carbon Project; chart by Carbon Brief using Highcharts.
China stands out as the only major emitting country to increase its emissions in 2020, reflecting the relatively modest impact of Covid-19 on its economy. Chinese emissions increased by 1.4% between 2019 and 2020, and by 5.5% between 2019 and 2021, representing by far the largest contributor to the rebound in global emissions.
As the GCP points out: “The global growth in fossil CO2 emissions mainly arises from the growth in coal use in the power and industry sectors in China.”
India’s emissions fell by 7% in 2020, but grew by 13% in 2021 for an overall increase in emissions of 4.4% between 2019 and 2021. While the increase in Indian emissions between 2019 and 2021 is similar to that of China on a percentage basis, this masks the fact that the actual emissions increase in China was approximately five times larger.
By contrast, emissions fall by around 11% in the US, 11% in the EU and 7% in the rest of the world between 2019 and 2020. They remain 3.7% below 2019 levels in the US in 2021, 4.2% below 2019 levels in the EU and 4.2% below in the rest of the world.
The total emissions for each year between 2018 and 2021, as well as the countries that were responsible for the changes in emissions, are shown in the figure below. Annual emissions for 2018, 2019, 2020 and estimates for 2021 are shown by the black bars. The coloured bars show the change in emissions between each set of years, broken down by country. Negative values show reductions in emissions, while positive values reflect emission increases.
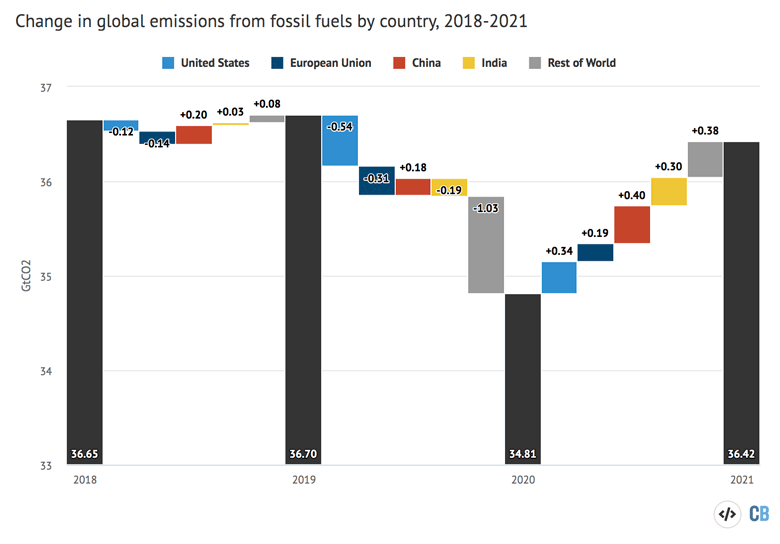
Annual global CO2 emissions from fossil fuels (black bars) and drivers of changes between years by country (coloured bars). Negative values indicate reductions in emissions. Note that the y-axis does not start at zero. Data from the Global Carbon Project; chart by Carbon Brief using Highcharts.
Overall, fossil CO2 emissions are expected to rise by around 4.9% in 2021 with many countries/regions contributing to the recovery in emissions from 2020 lows. Global emissions will almost fully rebound, remaining only around 0.8% below 2019’s record levels, and putting the world on track to likely set a new record for fossil CO2 emissions in 2022.
Although fossil CO2 emissions have continued to increase, global average per-capita fossil emissions have been flat for the past decade. Per-capita total global emissions have been flat for much longer – since at least 1959 – though these numbers obscure large variations between countries. The figure below shows global average emissions per-capita for each year from 1959 through 2021 for both fossil CO2 (orange) and total CO2 emissions (blue).
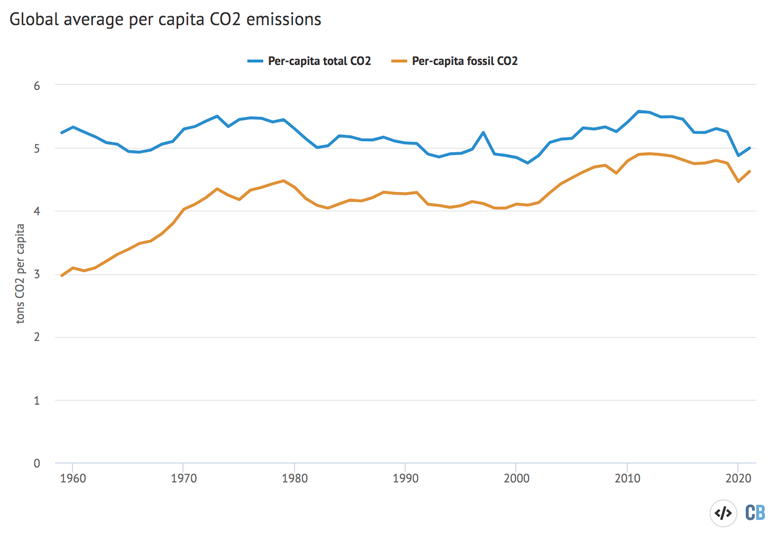
Global per-capita CO2 emissions from fossil CO2 (orange) and total CO2 emissions (blue) from 1959-2021, in tonnes of CO2 per person. Note that 2021 numbers are preliminary estimates. Data from the Global Carbon Project; chart by Carbon Brief using Highcharts.
Strong rebound in coal use and continued gas growth
Global fossil fuel emissions primarily result from the combustion of coal, oil and natural gas. Coal is responsible for more emissions than any other fossil fuel, representing approximately 41% of global fossil CO2 emissions. Oil is the second largest contributor at 32% of fossil CO2, while gas rounds out the pack at 21%.
These percentages reflect both the amount of each fossil fuel consumed globally, but also differences in CO2 intensities. Coal results in the most CO2 emitted per unit of heat or energy produced, followed by oil and natural gas.
Last year saw declines in emissions from all three fuels, with the largest drops in oil emissions (down nearly 10%) as transportation use was significantly curtailed during the height of the pandemic. Coal use also fell heavily in 2020, down 4%, while gas use fell a more modest 2%. All three fuels have rebounded in 2021, with coal emissions up more than 5% and both gas and oil emissions up 4% compared to 2020 levels.
Compared to pre-pandemic emissions in 2019, GCP projects that 2021 will see 2% higher gas emissions and 1% higher coal emissions. Oil emissions will likely remain nearly 6% below 2019 levels, reflecting lingering changes to transportation use.
The total emissions for each year between 2018 and 2021, as well as the fuels that were responsible for the change in emissions, are shown in the figure below.
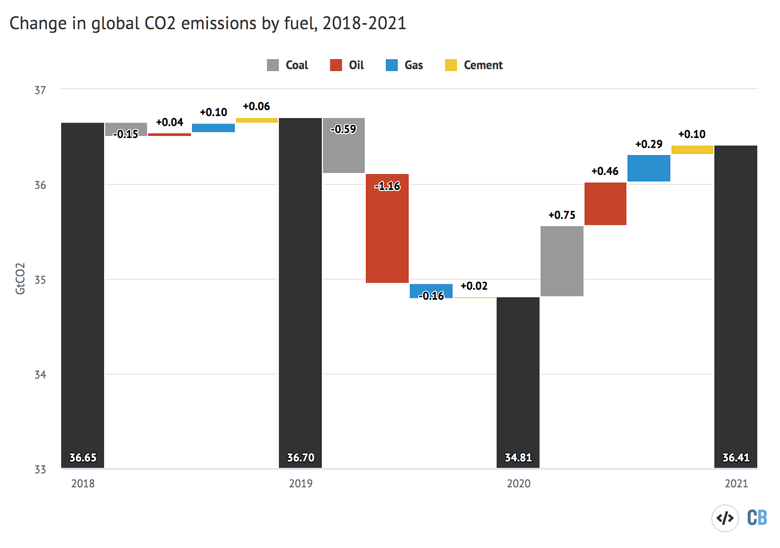
Annual global CO2 emissions from fossil fuels (black bars) and drivers of changes between years by fuel (coloured bars). Negative values indicate reductions in emissions. Note that the y-axis does not start at zero. Data from the Global Carbon Project; chart by Carbon Brief using Highcharts.
The GCP authors caution that there is a real risk of global coal use continuing to grow and exceeding its 2014 peak in the next few years given its current rapid growth. This is despite recent progress in restricting the financing of new coal plants, as most growth in coal capacity in the next few years is expected to be driven by domestic Indian and Chinese plants.
The figure below shows global CO2 emissions from different fuels over time. While coal emissions increased rapidly in the mid-2000s, it has plateaued since 2013. By contrast, gas and oil emissions have steadily grown prior to the pandemic.
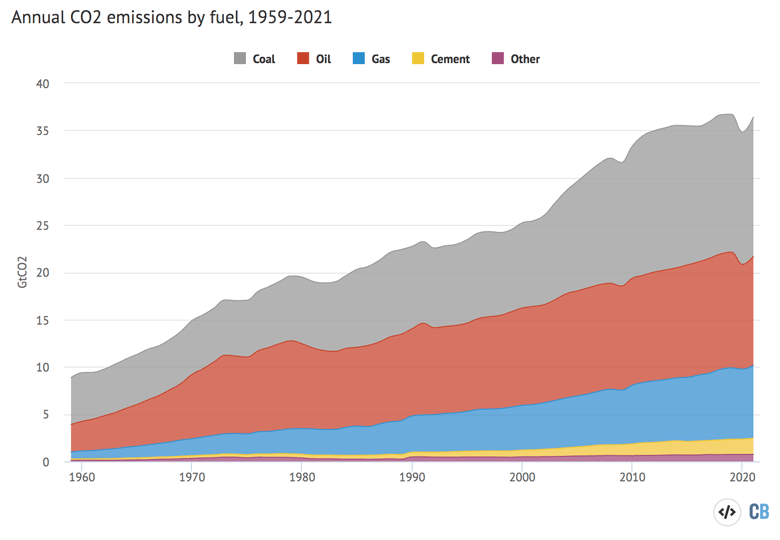
Annual CO2 emissions by fossil fuel from 1959-2021, in billions of tonnes of CO2 per year (GtCO2). Note that 2021 numbers are preliminary estimates. Data from the Global Carbon Project; chart by Carbon Brief using Highcharts.
Emissions in 2021 remain slightly below their pre-pandemic 2019 peak in large part due to persistent declines in oil use following the pandemic. However, the GCP authors warn that “a further rise in emissions in 2022 cannot be ruled out if the road transport and aviation sectors return to their pre-pandemic activity and emissions levels and coal use is stable”.
Changes to CO2 sources and sinks
Every year, the GCP provides an estimate of the global carbon budget. This is based on estimates of the release of CO2 through human activity and its uptake by the oceans and land, with the remainder adding to atmospheric concentrations of the gas.
(This differs from the commonly used term “carbon budget”, referring to the amount of CO2 that can be released while keeping warming below global limits of 1.5 or 2C.)
The most recent budget, including estimated values for 2021, is shown in the figure below. Values above zero represent sources of CO2 – from fossil fuels, cement and land use – while values below zero represent “carbon sinks” that remove CO2 from the atmosphere. CO2 emissions either accumulate in the atmosphere, or are absorbed by the oceans or land vegetation.

Annual global carbon budget of sources and sinks from 1959-2021. Note that the budget does not fully balance every year due to remaining uncertainties, particularly in sinks. 2021 numbers are preliminary estimates. Data from the Global Carbon Project; chart by Carbon Brief using Highcharts.
Atmospheric CO2 concentration increased 2.4 parts per million (ppm) in 2020 and is projected to increase by around 2ppm in 2021, resulting in atmospheric concentrations of 415ppm on average for the year. Around 47% of total CO2 emissions have remained in the atmosphere each year over the past decade, with the remainder being taken up by ocean and land sinks.
The GCP estimates that pandemic-related emissions reductions in 2020 resulted in an increase in atmospheric CO2 concentrations around 0.18ppm lower than what would have occurred in the absence of the pandemic. Lower atmospheric accumulation of CO2 in 2021 is being driven by La Niña conditions that help enhance the land carbon sink.
Update: This article was updated on 04/11/2021 to amend the quoted rebound in fossil CO2 emissions in 2021 (4.9%, rather than 4.6%) and the dip in 2020 (5.4% rather than 5.2%), along with some of the country-specific numbers. The original figures, calculated by Carbon Brief, referred to annual emissions, while the GCP figures (which the article now quotes) is calculated based on average daily emissions. The two methods only differ because 2020 was a leap year and so has an extra day.