Analysis: Which countries are historically responsible for climate change?
Simon Evans
10.05.21Simon Evans
05.10.2021 | 6:00amHistorical responsibility for climate change is at the heart of debates over climate justice.
Note that Carbon Brief published more recent versions of this analysis in 2023 and 2024.
History matters because the cumulative amount of carbon dioxide (CO2) emitted since the start of the industrial revolution is closely tied to the 1.2C of warming that has already occurred.
In total, humans have pumped around 2,500bn tonnes of CO2 (GtCO2) into the atmosphere since 1850, leaving less than 500GtCO2 of remaining carbon budget to stay below 1.5C of warming.
This means that, by the end of 2021, the world will collectively have burned through 86% of the carbon budget for a 50-50 probability of staying below 1.5C, or 89% of the budget for a two-thirds likelihood.
In this article, Carbon Brief looks at national responsibility for historical CO2 emissions from 1850-2021, updating analysis published in 2019.
For the first time, the analysis includes CO2 emissions from land use and forestry, in addition to those from fossil fuels, which significantly alters the top 10.
In first place on the rankings, the US has released more than 509GtCO2 since 1850 and is responsible for the largest share of historical emissions, Carbon Brief analysis shows, with some 20% of the global total.
China is a relatively distant second, with 11%, followed by Russia (7%), Brazil (5%) and Indonesia (4%). The latter pair are among the top 10 largest historical emitters, due to CO2 from their land.
- Analysis: In-depth Q&A: What is ‘climate justice’?
- Analysis: The lack of diversity in climate-science research
- Climate justice: The challenge of achieving a ‘just transition’ in agriculture
- Experts: Why does ‘climate justice’ matter?
- Researchers: The barriers to climate science in the global south
- Guest post: An Indigenous peoples’ approach to climate justice
Meanwhile, large post-colonial European nations, such as Germany and the UK, account for 4% and 3% of the global total, respectively, not including overseas emissions under colonial rule.
These national totals are based on territorial CO2 emissions, reflecting where the emissions take place. In addition, the analysis looks at the impact of consumption-based emissions accounting in order to reflect trade in carbon-intensive goods and services. Such accounts are only available for recent decades, even though trade will have influenced national totals throughout modern history.
The analysis then explores the figures in relation to population, where the likes of China and India fall down the rankings. Notably, per-capita rankings depend strongly on the methodology used and – unlike cumulative emissions, overall – these figures do not relate directly to warming.
Finally, this article presents a detailed explanation of the data behind the analysis, where it comes from and how it was put together, including assumptions, uncertainty and changing borders.
- Why cumulative CO2 matters
- National responsibility for historical emissions
- Cumulative consumption emissions
- Cumulative per-capita emissions
- Methodology: Fossil data
- Methodology: Industrial baseline
- Methodology: Changing borders
- Methodology: Land-use emissions
Why cumulative CO2 matters
There is a direct, linear relationship between the total amount of CO2 released by human activity and the level of warming at the Earth’s surface. Moreover, the timing of a tonne of CO2 being emitted has only a limited impact on the amount of warming it will ultimately cause.
This means CO2 emissions from hundreds years ago continue to contribute to the heating of the planet – and current warming is determined by the cumulative total of CO2 emissions over time.
This is the scientific basis for the carbon budget, the total amount of CO2 that can be emitted to stay below any given limit on global temperatures.
The link between cumulative emissions and warming is measured by the “transient climate response to cumulative emissions” (TCRE), estimated by the latest Intergovernmental Panel on Climate Change (IPCC) report to be 1.65C per 1,000bn tonnes of carbon (0.45C per 1,000GtCO2).
Carbon Brief’s analysis for this article shows that humans have emitted some 2,504GtCO2 into the atmosphere since 1850, a figure that aligns with those presented by the IPCC and by the Global Carbon Project, an international effort to quantify carbon emissions and sinks each year.
Based on the TCRE, those cumulative CO2 emissions correspond to warming of around 1.13C – and temperatures in 2020 reached around 1.2C above pre-industrial levels.
(This article does not consider emissions of non-CO2 greenhouse gases or aerosols, which are predominantly short-lived and so do not accumulate over time in the same way as CO2. The warming impact of non-CO2 gases is roughly balanced by the cooling from aerosols.)
The chart below shows how rapidly global CO2 emissions have risen over the past 70 years. It also highlights the split between CO2 emissions from fossil fuels and cement, shown in grey, compared with those from land use, land-use change and forestry (LULUCF, green).
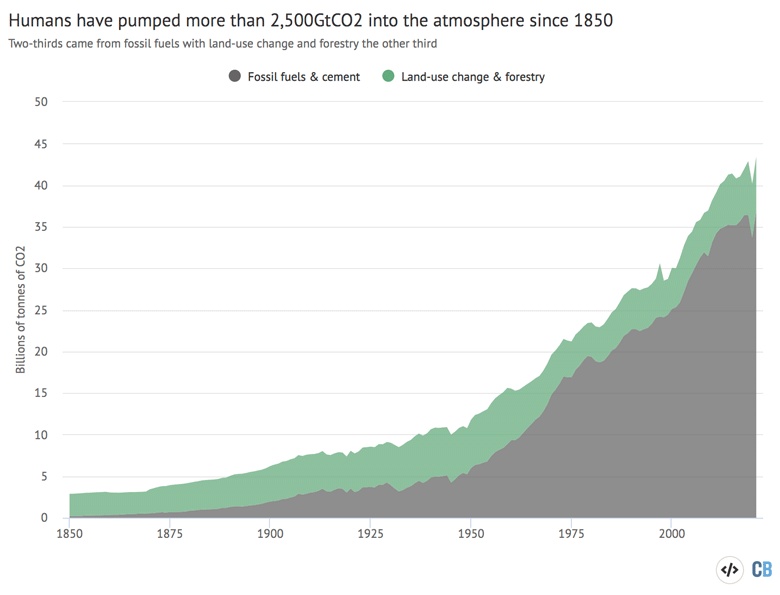
At a global level, emissions from land use and forestry have remained relatively consistent over the past two centuries. They amounted to around 3GtCO2 in 1850 and stand at roughly 6GtCO2 today, despite huge shifts in regional patterns of deforestation over time.
(A visible spike in 1997 was caused by widespread forest fires in Indonesia and other parts of Asia, subsequently described as an “unprecedented ecological disaster”.)
In contrast, fossil-fuel emissions have doubled over the past 30 years, quadrupled over the last 60 years and risen nearly twelve-fold over the past century. The 0.2GtCO2 released in 1850 amounts to just half a one percent of the roughly 37GtCO2 that is likely to be emitted in 2021.
Nevertheless, while the large majority of CO2 emissions today are from burning fossil fuels, human activity, such as deforestation, has made a significant contribution to the cumulative total.
Land-use change and forestry added some 786GtCO2 during 1850-2021, amounting to nearly a third of cumulative total, with the remaining two-thirds (1,718GtCO2) from fossil fuels and cement.
In terms of assigning national responsibility for current warming, it is therefore impossible to ignore the important contribution from CO2 emissions due to land-use change and forestry.
Taken together, cumulative emissions between 1850-2021 add up to some 86% of the carbon budget for an even chance of staying below 1.5C, or 89% of the budget for a two-thirds chance.
As emissions have increased, the carbon budget has been used up at an accelerating pace, with half the cumulative total since 1850 having been released over the past 40 years alone.
From the start of 2022, the remaining 1.5C budget (50% probability) would be used up within 10 years, if annual emissions remain at current levels – and the budget for a two-thirds likelihood of staying below 1.5C would last just seven years.
National responsibility for historical emissions
The question of who is responsible for using up the carbon budget is clearly crucial in the context of climate justice debates. It speaks to the responsibility for dealing with the impact of climate change to date – as well as who ought to do the most to prevent further warming.
However, assigning responsibility is far from straightforward. Carbon Brief’s analysis primarily looks at cumulative national territorial emissions, since this is the way the available data is presented.
(Alternative approaches are discussed further down the article.)
In loose terms, cumulative national allocations give “responsibility” for historical emissions to the modern-day country that occupies the territory that emitted in the past. Clearly, shifting territorial ownership and the unification and dissolution of countries complicates matters (see below).
On this basis – and including all human sources of CO2 – the animation above shows for the first time the countries most responsible for historical emissions as they accumulate during 1850-2021.
Each bar, marked with a contemporary national flag, represents a country’s cumulative emissions over time and is colour-coded by region of the world, according to the map in the top-right corner.
The year and the size of the remaining carbon budget for 1.5C as it gets used up over time are indicated in the bottom right corner.
The history of national CO2 emissions is also a history of development. While the changing positions in the rankings relate to a multitude of factors, some broad themes emerge.
In the early decades of the timeline, global CO2 emissions were dominated by land-use change and forestry and this is reflected in the top 10 shown in the animation.
In this period, the largest emitters were primarily geographically extensive nations cutting down their temperate forests for agricultural land and for fuel, such as the US, Russia and China.
In the US, for example, a wave of settlers spread across the continent from east to west, following their “manifest destiny” and clearing land for farming as they went.
At the same time, a few European countries (which had largely cleared their land for farming before 1850) start to rise up the rankings because they were in the throes of coal-fuelled industrialisation, including France, Germany and – above all – the UK.
Although these countries have significantly reduced their emissions in recent decades, they remain among the most important contributors to historical warming today.
The rainforest nations of Brazil and Indonesia were also being deforested in the late 19th and early 20th centuries by settlers growing rubber, tobacco and other cash crops. But deforestation began “in earnest” from around 1950, including for cattle ranching, logging and palm-oil plantations.
The US remains in first position for its cumulative CO2 emissions throughout the timeseries, as its development continued first with widespread use of coal, then with the advent of the motor car.
By the end of 2021, the US will have emitted more than 509GtCO2 since 1850. At 20.3% of the global total, this is by far the largest share and is associated with some 0.2C of warming to date.
This is shown in the chart below, which also breaks down each country’s cumulative total into emissions from fossil fuel use (grey) or from land-use change and forestry (green).
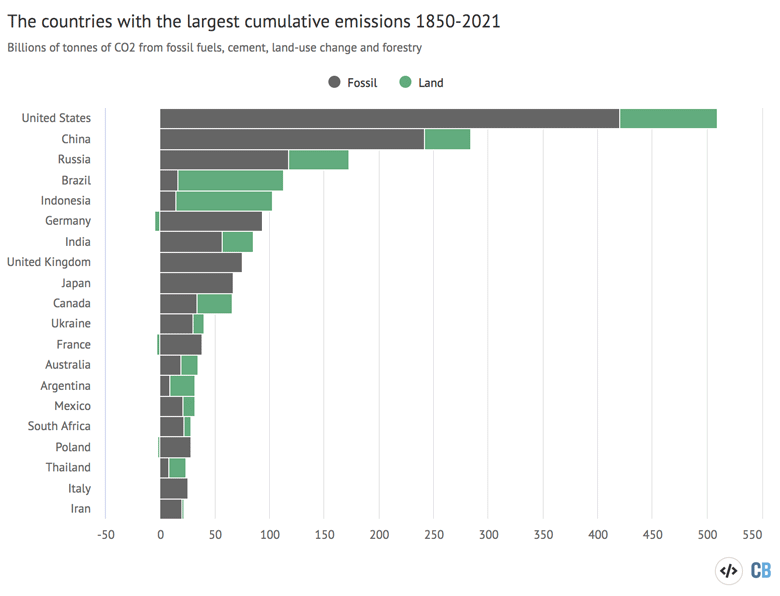
In second place is China, with 11.4% of cumulative CO2 emissions to date and around 0.1C of warming. While China has had high land-related emissions throughout, its rapid, coal-fired economic boom since 2000 is the main cause of its current position.
(See the methodology for more information on China’s pre-industrial coal use.)
China’s CO2 output has more than tripled since 2000, overtaking the US to become the world’s largest annual emitter, responsible for around a quarter of the current yearly total.
Russia is third, with some 6.9% of global cumulative CO2 emissions, followed by Brazil (4.5%) and Indonesia (4.1%). Notably, the chart above shows how the latter pair are in the top 10 largely as a result of their emissions from deforestation, despite relatively low totals from the use of fossil fuels.
Germany, in sixth place with 3.5% of cumulative emissions thanks to its coal-reliant energy industry, illustrates how some countries’ land sectors have become cumulative CO2 sinks rather than sources, as trees have returned to previously deforested areas.
(Note that the data used for this article is based on the scientific approach to accounting for land-use emissions, which differs from that used in the official inventories submitted to the UN. The difference, which relates to what is counted as a “human” versus “natural” source or sink of CO2, was explored in a Carbon Brief guest post published earlier this year.)
India is in seventh place in the rankings, with 3.4% of the cumulative total – just above the UK, on 3.0% – as a result of a higher contribution from land-use change and forestry.
Japan on 2.7% and Canada, with 2.6%, close out the top 10 largest contributors to historical emissions. International transport emissions from aviation and shipping, which are almost always excluded from national inventories and targets, would rank 11th in the list, if viewed as a “nation”.
Cumulative consumption emissions
One common argument in climate-justice conversations is that certain countries have reduced their territorial emissions at home, but continue to rely on high-carbon goods imported from overseas.
Consumption-based emissions accounts give full responsibility to those that use the products and services rendered with fossil energy, tending to reduce the total for major exporters, such as China.
There are practical challenges to gathering such accounts, which rely on detailed trade tables. As such, they are only available for the years since 1990, even though international trade in carbon-intensive products has been going on throughout modern history.
Despite these limitations, it is possible to examine the impact of traded CO2 on countries’ cumulative emissions, as shown in the chart below. The grey bars show cumulative national emissions on a territorial basis, with the light grey chunks indicating CO2 associated with exports and the red chunks representing emissions embedded in imported goods and services.
Notably, the top 19 countries according to their cumulative consumption emissions are the same as the top 19 on a territorial basis – and none of the top 10 shift position in the rankings. This is despite some countries now having a much larger CO2 footprint than their territorial total.
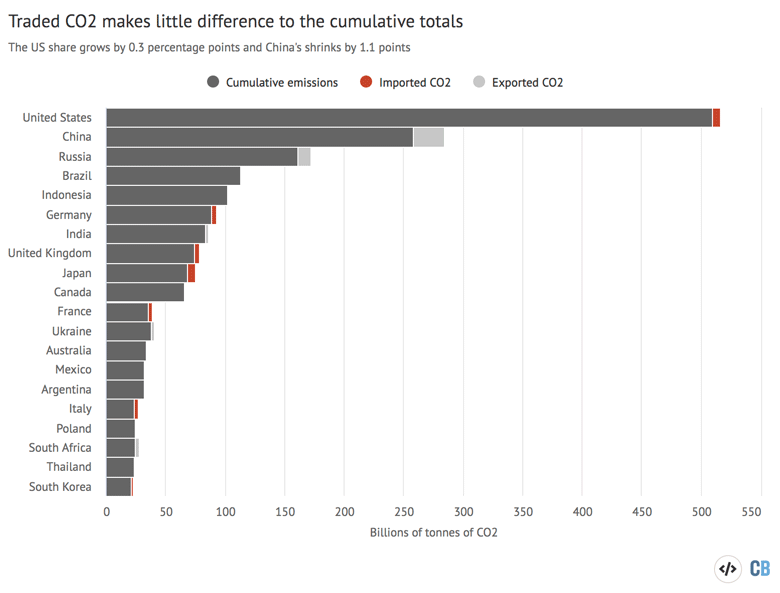
While the main rankings do not change as a result of using consumption-based emissions accounts, the shift does add to the share of responsibility accorded to wealthy nations.
The US and Japan each gain 0.3 percentage points of the global cumulative total, while Germany and the UK add 0.2 points each, whereas China’s share drops by 1.1 points and Russia’s by 0.5.
Note that the consumption accounting used here only includes CO2 from fossil fuels and cement, hence Brazil and Indonesia’s cumulative totals barely change.
Note also that the unavailability of consumption-based accounts prior to 1990 means that earlier carbon-intensive trade is excluded from the analysis. The UK, as the original “workshop of the world” in the 19th century, exported large volumes of energy- and carbon-intensive goods.
Other industrialising nations, such as the US and Germany, did the same, playing, as one 2017 paper puts it, a similar role to the China’s today:
“Today, China is often perceived as the workshop of the world, producing large amounts of cheap consumer goods for others. A century ago Britain and Germany (along with the United States) played a similar role both for Europe and globally.”
In 1890, nearly 20% of UK energy use related to exported goods, meaning a similar proportion of its CO2 emissions would have been allocated overseas on a consumption accounting basis.
Consumption-based accounting still does not fully resolve the question of responsibility for emissions, however, given that both sides of a trade relationship are likely to gain financially.
In the modern context, only one side of that relationship has full sovereignty over the CO2-emitting activities involved – though it would have been a different story under historical colonial rule.
A third approach is to make fossil-fuel producers responsible for the CO2 released when their coal, oil or gas is burned. This idea is often mentioned in relation to the “scope 3 emissions” of oil companies, or when discussing major fossil-fuel exporters, such as Australia.
However, national emissions on a production basis are not currently available and, without careful accounting, this could risk the double-counting of CO2 produced in one place and used elsewhere.
Cumulative per-capita emissions
The idea of national responsibility has other issues, including the unequal size, wealth and carbon intensity of present-day populations, as well as those of previous generations.
These issues apply both within and between countries. Moreover, countries themselves are somewhat arbitrary human constructs, resulting from accidents of history, geography and politics. With alternative borders, the ranking of historical responsibilities might look very different.
One way to attempt to untangle this is to normalise countries’ contributions to cumulative CO2 emissions according to their relative populations.
Unlike cumulative historical emissions, which relate directly to current warming, these per-capita figures are not immediately relevant to the climate, explains Prof Pierre Friedlingstein, chair in mathematical modelling of climate systems at the University of Exeter. He tells Carbon Brief:
“What matters for the atmosphere and the climate is cumulative CO2 emissions. While cumulative per-capita emissions are interesting, they shouldn’t be interpreted as country shares of responsibility because they’re not directly relevant to the climate. You would have to multiply it by the country’s population to make that link to warming.”
Another way to think about this is to note that small countries with high per-capita emissions are still relatively unimportant for warming overall. For this reason, the table below excludes countries with present-day populations lower than 1 million people. (This removes the likes of Luxembourg, Guyana, Belize and Brunei.)
Carbon Brief’s analysis for this article approaches the question of accounting for relative population sizes in two different ways. These approaches give markedly different results, highlighting the challenge of interpreting cumulative per-capita emissions.
The first approach takes a country’s cumulative emissions in each year and divides it by the number of people living in the country at the time, implicitly assigning responsibility for the past to those alive today. The table, below left, shows the top 20 countries on this basis, as of 2021.
The second approach takes a country’s per-capita emissions in each year and adds them up over time, with the result, as of 2021, shown in the table, below right. This gives equal weight to the per-capita emissions of the populations of the past and of the present day.
| Rank | Country | Cumulative emissions per population in 2021, tCO2 | Rank | Country | Cumulative per capita emissions, tCO2 |
|---|---|---|---|---|---|
| 1 | Canada | 1,751 | 1 | New Zealand | 5,764 |
| 2 | United States | 1,547 | 2 | Canada | 4,772 |
| 3 | Estonia | 1,394 | 3 | Australia | 4,013 |
| 4 | Australia | 1,388 | 4 | United States | 3,820 |
| 5 | Trinidad and Tobago | 1,187 | 5 | Argentina | 3,382 |
| 6 | Russia | 1,181 | 6 | Qatar | 3,340 |
| 7 | Kazakhstan | 1,121 | 7 | Gabon | 2,764 |
| 8 | United Kingdom | 1,100 | 8 | Malaysia | 2,342 |
| 9 | Germany | 1,059 | 9 | Republic of Congo | 2,276 |
| 10 | Belgium | 1,053 | 10 | Nicaragua | 2,187 |
| 11 | Finland | 1,052 | 11 | Paraguay | 2,111 |
| 12 | Czechia | 1,016 | 12 | Kazakhstan | 2,067 |
| 13 | New Zealand | 962 | 13 | Zambia | 1,966 |
| 14 | Belarus | 961 | 14 | Panama | 1,948 |
| 15 | Ukraine | 922 | 15 | Cote d'Ivoire | 1,943 |
| 16 | Lithuania | 899 | 16 | Costa Rica | 1,932 |
| 17 | Qatar | 792 | 17 | Bolivia | 1,881 |
| 18 | Denmark | 781 | 18 | Kuwait | 1,855 |
| 19 | Sweden | 776 | 19 | Trinidad and Tobago | 1,842 |
| 20 | Paraguay | 732 | 20 | United Arab Emirates | 1,834 |
Perhaps the most notable impact of accounting for population is the absence, in the table above, of several of the top 10 for cumulative emissions overall, namely China, India, Brazil and Indonesia.
While these countries have made large contributions to global cumulative emissions, they also have big populations, making their impact per person much smaller. Indeed, those four countries account for 42% of the world’s population, but just 23% of cumulative emissions 1850-2021.
In contrast, the remainder of the top 10, namely US, Russia, Germany, the UK, Japan and Canada, account for 10% of the world’s population, but 39% of cumulative emissions.
This is reflected in the weighting by current populations, in the table above left, where Canada ranks in first place, followed by the US, Estonia, Australia, Trinidad and Tobago, and Russia.
For the larger countries on this list, their rankings reflect combinations of high deforestation rates during the 19th and mid-20th centuries – often when populations were much lower – along with high per-capita fossil fuel use in more recent decades.
For others, the reasons are less obvious. Estonia, for example, has long relied on oil sands for most of its energy needs, meaning it has had high annual per-capita emissions. The Estonian government has pledged to phase out oil sands production by 2040.
(Note that as a former Soviet state, Estonia’s emissions before 1991 are estimated according to its share of the USSR’s total at that time, meaning there is more uncertainty than for most other countries. See the methodology sections below for more details.)
Trinidad and Tobago, a Caribbean island nation of just 1.4 million people, ranks highly thanks to its large oil and gas industry, which also feeds a sizeable chemicals sector.
Turning to the cumulative per-capita ranking in the table, above right, the list is quite different, although it once again features Canada, Australia and the US in prominent positions.
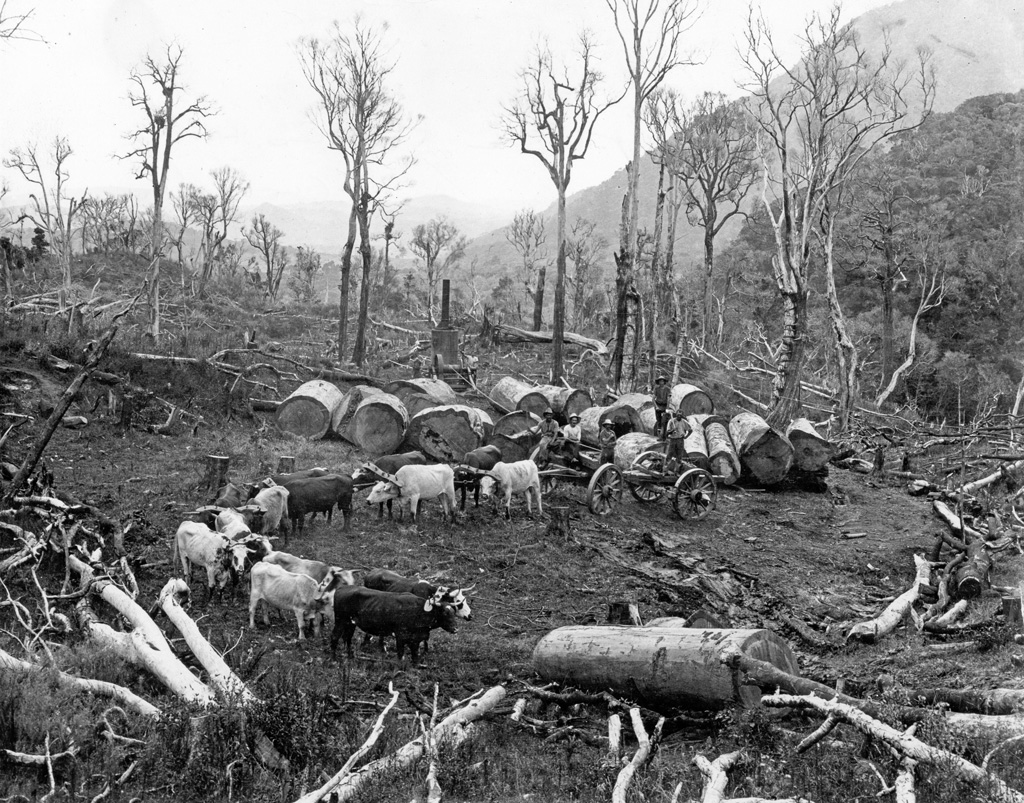
New Zealand ranks at the top of this list because of extensive deforestation during the 19th century, when much of its native Kauri forest was cleared for its valuable timber. The country’s tiny population at the time consequently had very high annual per-capita emissions, with the cumulative total by 1900 making up around two-thirds of the total amassed by the present day.
Other countries on this list as a result of emissions from deforestation include Gabon, Malaysia and the Republic of Congo, as well as several South American nations.
In terms of assigning “responsibility” for these emissions, this again raises difficult questions relating to colonisation and the extraction of natural resources by foreign settlers.
Methodology: Fossil data
Scientists have been making estimates of global CO2 emissions for more than a century, with Swedish geochemist Arvid Högbom making what is thought to be the earliest attempt in 1894.
In a translation by Robbie Andrew, senior researcher at the Center for International Climate Research (CICERO) in Norway, Högbom describes how he came up with his estimate:
“Current global hard coal production is in round numbers 500m tonnes per annum, or 1 tonne per km2 of the Earth’s surface. Transformed to CO2 this amount of coal represents approximately a thousandth part of the air’s total CO2.”
According to Andrew, Högbom’s work implied global CO2 emissions from coal burning of about 1.8GtCO2 in 1890. Despite clearly being rather approximate, this first effort was remarkably close to the contemporary estimate of emissions from coal at the time, some 1.3GtCO2.
Högbom’s paper helped inspire the seminal 1896 work by Svante Arrhenis, the first to predict that changing atmospheric CO2 levels could substantially alter the Earth’s temperature.
Over the years, scientists have developed several timeseries estimating CO2 emissions from the burning of fossil fuels and, although they do not align perfectly, they agree within a few percent.
The data for this article is drawn from a long list of sources. The first is the estimates of national historical CO2 emissions from fossil fuels and cement production, developed by the Carbon Dioxide Information Analysis Center (CDIAC) in the US and adapted by the Global Carbon Project.
The CDIAC figures, now maintained and updated by the Appalachian Energy Center at Appalachian State University, run from 1750 through to the present day.
The historical fossil CO2 estimates are based on a methodology that was developed by 1984 and has since been refined. In broad terms, it uses records of fossil fuel production, trade and use, as well as estimates of the amount of CO2 released when a given weight of coal, oil or gas is burned.
Conceptually, this is the way that Högbom made his first estimate of global CO2 emissions – and a more sophisticated version of this approach is still used to estimate contemporary emissions today.
Gregg Marland, one of the lead authors of the CDIAC timeseries, who has been working on the figures for decades, tells Carbon Brief:
“I think that most people do not appreciate that CO2 emissions are seldom actually measured anywhere, but rather are estimated from the best data available on the amount of fossil fuel produced and what we do with it.”
Andrew writes:
“Because fossil-fuel CO2 emissions are largely connected with energy, which is a closely tracked commodity group with its critical role in economic activity, there is a wealth of underlying data that can be used for estimating emissions.”
Overall, Marland says: “We are fairly comfortable with the basic estimates of global CO2 emissions, but the uncertainty can be quite large for some individual countries back at the early stages of the dataset.” He tells Carbon Brief:
“[T]here is data on fossil-fuel use and processing back to 1751. The data take some processing and they are not perfect, but they permit a rather good history…Constructing estimates for the early years is facilitated by two facts: Early on there were only a few countries burning fossil fuels and the rate of growth is such that the great majority of global emissions have been during the most recent decades.”
One obvious question arising from the data is why China, with a population of some 400 million people even in 1850, should be recorded as having zero emissions from fossil fuel burning until around the turn of the 20th century.
China is thought to have been using coal for thousands of years, with one account suggesting it was burning hundreds of thousands of tonnes a year to make iron as early as the 11th century.
However, coal use was said to be highly localised due to the high cost of transport, and some iron hubs collapsed after the Mongol invasion. China remained predominantly reliant on wood fuel, causing widespread deforestation. In a 2004 article, energy historian Vaclav Smil writes:
“By 1900, several European countries were almost completely energised by coal – but energy use in rural China during the last year of the Qing dynasty (1911) differed little from the state that prevailed in the Chinese countryside 100 or 500 years earlier.”
“Coal [use in China] is hard to quantify prior to 1900,” notes another database of historical energy use around the world, compiled by Prof Paolo Malanima and hosted by the Center for History and Economics at Harvard University. Nevertheless, this data supports the figures given by CDIAC.
Marland tells Carbon Brief:
“It seems unlikely to me that there was a large use of coal [in China] that is not represented in some of the historic data that we used.”
Methodology: Industrial baseline
Carbon Brief’s analysis for this article begins in 1850, because this coincides with the IPCC definition of the pre-industrial baseline period of 1850-1900 and because data on national emissions from land use and forestry are not available before 1850 (see below).
According to the CDIAC figures, only a handful of countries were emitting significant CO2 from fossil-fuel burning before 1850 – and many had negligible totals until well into the 20th century.
Therefore, starting in 1850 excludes just 3.8GtCO2 of fossil fuel emissions released during the century from 1750-1850, roughly 0.2% of the total emitted across the full period 1750-2021.
Of the pre-1850 total, nearly three-quarters (2.8GtCO2) was from the UK. Extending the analysis back to 1750 would add 0.1 percentage points to the UK’s share of global cumulative emissions.
The CDIAC work is also used in the historical timeseries published by the Global Carbon Project (GCP), which has been aggregated with other useful information by Our World in Data (OWID). Carbon Brief’s analysis takes fossil emissions data through to 2019 from the OWID compilation.
The analysis then estimates emissions in 2020 and 2021 using the near real-time figures published by Carbon Monitor. This offers data for major economies and the rest of the world in aggregate.
Figures for 2020 apply the annual percentage change from Carbon Monitor to the 2019 total from GCP in tonnes. The approach for 2021 is the same, but uses the year-on-year percentage change in emissions to date. At time of writing, Carbon Monitor data ran through to the end of July 2021.
Data for fossil CO2 emissions from international transport are reported separately by GCP and collected from the personal webpage of Robbie Andrew, one of the project’s collaborators. Carbon Brief assumed international transport emissions halved in 2020 before returning to 2019 levels.
GCP via Our World in Data is also the source of consumption-based emissions accounts, which run from 1990 onwards. Population data comes from Our World in Data and Gapminder.
Methodology: Changing borders
Territorial changes and the unification or disintegration of national entities presents a particular problem for the historical division of emissions. “When possible”, the CDIAC data accounts for changing national boundaries over time, though this is “very difficult”, Marland says.
For example, responsibility for emissions from the coal- and mineral-rich region of Alsace-Lorraine switches between France and Germany, according to contemporary borders.
Similarly, emissions from the area that now forms Pakistan are reported under India’s total prior to the country’s partition in 1947, with Bangladesh splitting further from Pakistan in 1971.
Marland tells Carbon Brief:
“There are, of course, some changes in national borders that are very difficult to deal with. But things like the breakup of the former Soviet Union or the former Yugoslavia – or the combining of North and South Vietnam or East and West Germany – actually leave some data trails that allow reconstruction. The key, I think, is to be transparent and honest and to be guided by the best data available.”
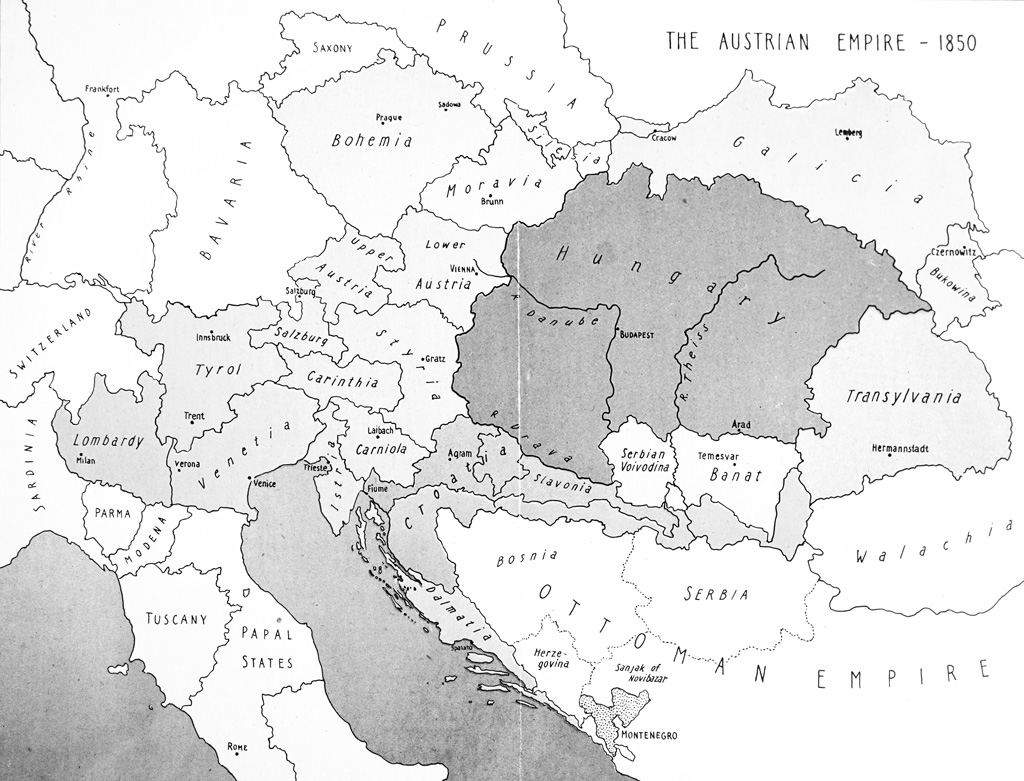
The treatment of countries within supranational entities, such as the Austro-Hungarian or Ottoman empires, creates further difficulties – and the potential for double-counting, Andrew says.
A key difference from CDIAC is that the GCP aggregates and disaggregates national emissions according to modern geographic entities, joining east and west Germany into a single unit.
Similarly, whereas CDIAC reports emissions from Czechoslovakia as a single country until its separation into Czechia and Slovakia after 1991, the GCP reports figures for the two constituent countries throughout the timeseries. This split is based on the shares of emissions due to Czechia and Slovakia, at the time of partition in 1991, with these shares projected backwards through time.
GCP uses the same approach to countries in the former Soviet Union, whereas CDIAC reports data for the USSR from 1830-1991 and for the independent states thereafter.
This is clearly a crude approach, which adds to the other sources of uncertainty in the data – and so the relative rankings of these countries should not be over-interpreted.
Nevertheless, in order to track cumulative emissions over time, Carbon Brief’s analysis uses the GCP reporting of national emissions, rather than the shifting country definitions used by CDIAC.
Methodology: Land-use emissions
Estimated national CO2 emissions from land use, land-use change and forestry (LULUCF) are the average of two data sources, namely Houghton and Nassikas (2017, hereafter “HN”) and Hansis et al (2015, “BLUE”).
Updated versions of these datasets, covering 1850-2019 and using harmonised country labelling, were shared with Carbon Brief by one of the authors, Prof Julia Pongratz, director of the department of geography at the Ludwig-Maximillians University Munich.
Both datasets derive from “bookkeeping models”, which, in simple terms, record changes in soil and above-ground carbon stocks over time, based on aggregate levels of land-use change.
Richard Houghton, senior scientist emeritus at the Woodwell Climate Research Center and the lead author of the HN timeseries, explains the concept to Carbon Brief:
“We calculate the annual emissions from land-use change with a bookkeeping model and two kinds of data. The first kind reconstructs AREAS of croplands, pastures, forests and other lands. The second kind of data are the CARBON data. How much carbon is in the vegetation and soils of different types of ecosystems and how do those stocks change as a result of land-use change and forestry?”
Drawing on the wider scientific literature, the researchers tell the model how much carbon is lost or gained when land use changes as a result of human activity, Houghton says:
“The bookkeeping model is based on knowing the annual changes in the carbon stocks of a hectare of land undergoing some kind of management or land use, for example, clearing a forest for cropland, or planting a forest on open land. These data on carbon stocks and their changes from management are obtained from ecological and forestry literature.”
The two LULUCF datasets contain significant differences at global and national levels, explored in a recent joint paper published by the two groups.
Key factors include the use of different underlying land-use data and that HN aggregates this at national level, whereas BLUE is spatially explicit. This allows BLUE to track shifting cultivation that may affect carbon stocks across a wider area, even if the net area of farmland stays the same.
The models also differ in their estimates of carbon stocks for each type of land use, as well as in their treatment of the share of stocks that quickly decompose.
To bring these time series fully up to date for 2021, Carbon Brief assumed land-use emissions in the most recent years were unchanged since the most recently available estimate.
As with the estimates of fossil CO2 emissions, the uncertainty in the LULUCF figures increases further back in time. Houghton tells Carbon Brief:
“Obviously, the uncertainty results from incomplete data and the assumptions we use to fill in missing pieces. The uncertainty increases as we go back in time, but rates of change in land use were generally lower in the past than in the last 60 years.”
Pongratz says that the overall uncertainty in global land use and forestry emissions amounts to around plus or minus 2.5GtCO2 per year, which is a similar range to that for fossil fuels. However, this uncertainty is much greater in relative terms, at ±50% of the estimated LULUCF total.
Although the level of uncertainty in land use and forestry emissions has been significantly reduced over the past few years, Pongratz says:
“It’s the most uncertain part of the anthropogenic carbon budget, yet now takes on important political dimensions with discussions around CO2 removal.”
A third dataset on LULUCF emissions, the “OSCAR” timeseries, is averaged together with HN and BLUE for the annual Global Carbon Budget analysis.
However, OSCAR is reported at regional rather than country level, so was not used in Carbon Brief’s national historical emissions analysis. Pongratz tells Carbon Brief the OSCAR data is generally roughly in the middle of the other two series. The cumulative global total for LULUCF used by Carbon Brief differs from the three-way average used by GCP by less than 2%.
Although Carbon Brief’s analysis starts in 1850, as with fossil fuels, this date does exclude some CO2 emissions related to pre-industrial land-use change, predominantly forest clearance.
Pongratz was lead author on a 2012 paper exploring regional land-use change emissions during the 1,000 year pre-industrial period from 800-1850.
In Europe, this research shows a large pulse of emissions due to widespread forest clearance until the black death, followed by a further wave of deforestation during the renaissance period.
Interestingly, however, it shows that global land-use change emissions overall are dominated by China and South Asia, a region predominantly made up of India.
The paper concludes that pre-industrial CO2 emissions increase Asia’s share of current warming by 2-3 percentage points, while reducing North America and Europe’s share by a similar amount.
-
Analysis: Which countries are historically responsible for climate change?