
In-depth Q&A: The IPCC’s sixth assessment report on climate science
Carbon Brief Staff
08.09.21Carbon Brief Staff
09.08.2021 | 5:17pmThe United Nations’ Intergovernmental Panel on Climate Change (IPCC) has published the first part of its sixth assessment report (AR6), which will form the cornerstone of climate science for the years ahead.
Summarising the “physical science basis” for climate change, the report pulls together the findings from more than 14,000 peer-reviewed studies.
The authors conclude that it is “unequivocal” that humans have warmed the planet, causing “widespread and rapid” changes to Earth’s oceans, ice and land surface. They warn that the present state of many parts of the climate system is “unprecedented over many centuries to many thousands of years”.
-
WG1
- In-depth Q&A: The IPCC’s sixth assessment report on climate science
- Scientists react: What are the key new insights from the IPCC’s WG1 report? WG2
- In-depth Q&A: The IPCC’s sixth assessment on how climate change impacts the world
- Scientists react: What are the key new insights from the IPCC’s WG2 report? WG3
- In-depth Q&A: The IPCC’s sixth assessment on how to tackle climate change
- Scientists react: What are the key new insights from the IPCC’s WG3 report?
Many of these changes – particularly to the oceans, ice sheets and global sea levels – are “irreversible”, the authors say. Abrupt changes and “tipping points” – such as rapid Antarctic ice sheet melt and forest dieback – “cannot be ruled out”.
One of the key developments since the IPCC’s last assessment report in 2013-14 is the strengthening of the links between human-caused warming and increasingly severe extreme weather, the authors say. This is now “an established fact”, they write.
“We’re already experiencing climate change, including more frequent and more extreme weather events,” IPCC author Prof Ed Hawkins of the University of Reading told a press briefing, adding that “the consequences will continue to get worse for every bit of warming, and for many of these consequences, there’s no going back”.
In almost all emissions scenarios, global warming is expected to hit 1.5C “in the early 2030s”, the report says. And without reaching “net-zero” CO2 emissions – along with “strong reductions” in other greenhouse gases – the climate system will continue to warm.
Despite the “bad news”, IPCC author Prof Piers Forster from the University of Leeds said he and his fellow authors are also “really certain” that near-term emissions cuts can “really reduce the rate of unprecedented warming”. He added:
“The report does really show – scientifically and robustly – that net-zero does work for stabilising or even reducing surface temperatures.”
In the in-depth Q&A below, Carbon Brief unpacks the key findings of the report and explains the advances and developments since the IPCC’s last assessment. Please use the links to navigate between the sections.
- What is this report?
- How is Earth’s temperature changing?
- How much warmer will the world get in future?
- When might global warming reach 1.5C?
- How are rainfall patterns changing?
- What impact is warming having on the world’s snow and ice?
- What does the report say about changes to the oceans?
- How have projections of sea level rise changed since AR5?
- What does the report say about the impact humans are having?
- What does the report say about abrupt changes and ‘tipping points’?
- How does air pollution affect global temperatures?
- How have climate sensitivity estimates changed since AR5?
- What does the report say about the remaining carbon budget?
- What does the report say about ‘net-zero’?
- How are weather extremes changing and what role does climate change play?
- How do climate risks vary across the world?
What is this report?
Before this latest report, the IPCC had previously published five sets of “assessment reports” since its foundation in 1988. Each “comprehensively and consistently [lays] out the rapidly accumulating evidence of a changing climate system”, the new report says.
The last set – the fifth assessment report (“AR5”) – was published in 2013-14. (See Carbon Brief’s coverage here.) In October 2015, the IPCC elected South Korean economist Prof Hoesung Lee as its new chair, who led the organisation into its sixth assessment “cycle”.
As usual, efforts of the IPCC for AR6 are divided into three “working groups”:
- Working Group I (WG1): The physical science basis
- Working Group II (WG2): Impacts, adaptation and vulnerability
- Working Group III (WG3): Mitigation of climate change
Back in September 2017, the IPCC agreed report outlines for all three working groups. And in April 2018, the IPCC announced the authors who had been selected – more than 700 in total, who all work on a voluntary basis.
I am very pleased to announce that the new outline of the @IPCC_CH WGI report for the #AR6 has just been approved! pic.twitter.com/WQH1rxiyhC
— Dr Valérie Masson-Delmotte (@valmasdel) September 10, 2017
The WG1 report is the first of these to be published. Originally slated for April 2021, the publication date was pushed back due to the disruption caused by the Covid-19 pandemic.
-
WG1
- Media reaction: IPCC’s new climate science report and what it means for the world
- Analysis: What the new IPCC report says about when world may pass 1.5C and 2C
- Explainer: What the new IPCC report says about extreme weather and climate change
- IPCC: How the AR6 WG1 summary for policymakers compares to its predecessor WG3
- Analysis: What the new IPCC report says about how to limit warming to 1.5C or 2C
- Guest post: How not to interpret the emissions scenarios in the IPCC report
- Guest post: Why estimates of the ‘cost’ of climate action are overly pessimistic
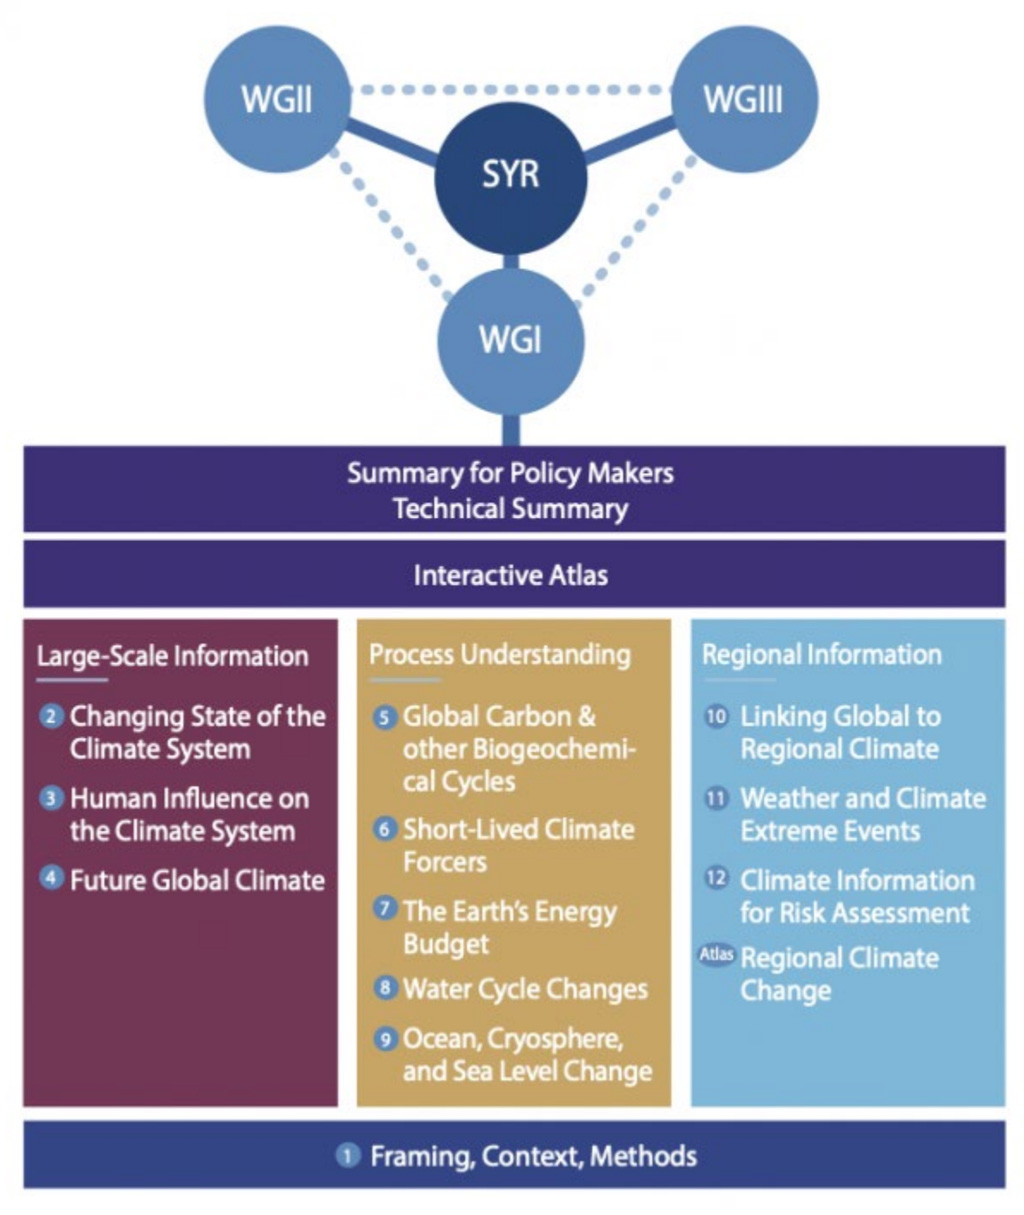
The aim of the WG1 report is to “assesses the current evidence on the physical science of climate change, evaluating knowledge gained from observations, reanalyses, palaeoclimate archives and climate model simulations, as well as physical, chemical and biological climate processes”, the IPCC says.
It includes 12 core chapters and an online interactive “atlas” – a “novel compendium of global and regional climate change observations and projections”. In total, the report runs to around 3,000 pages and references more than 14,000 scientific papers.
Over the AR6 cycle, three drafts of the full report have been reviewed by experts and governments. In total, the report’s authors have received more than 70,000 comments.
With the main report complete, the final step has been a line-by-line agreement of the short summary for policymakers (SPM) document by government delegates. This approval meeting has been carried out – remotely for the first time – over the past two weeks.
How are discussions on the @IPCC_CH Working Group I contribution to the Sixth Assessment Report structured, you wonder?
— Earth Negotiations Bulletin (@IISD_ENB) July 27, 2021
Here’s a short thread 🧵:
1/9
The WG2 and WG3 reports are planned for publication in February and March next year, respectively. A “synthesis report” pulling together the findings of the three working groups will follow in September 2022.
The IPCC does not only publish full assessment reports. The sixth assessment cycle has also included shorter “special reports” on three topics:
- Global warming of 1.5C (“SR15”) in 2018
- Climate change and land (“SRCCL”) in 2019
- The ocean and cryosphere in a changing climate (“SROCC”) in 2019
(In addition, the IPCC has published a 2019 “methodology report” on guidelines for national greenhouse gas inventories.)
The special reports are referenced frequently throughout the AR6 report, as is an earlier special report on extreme events (“SREX”), which was published in 2012.
The AR6 WG1 report uses the output from the latest generation of global climate models, produced as part of the sixth Coupled Model Intercomparison Project (CMIP6). These coordinated efforts consist of “runs” from around 100 distinct climate models being produced by dozens of different modelling groups around the world. (The report also uses output from CMIP5, used extensively in AR5 and since.)
The model simulations themselves use “a new set of scenarios, derived from the Shared Socio-economic Pathways (SSPs)”, the report says. The SSPs were initially developed to describe “five broad narratives of future socio-economic development”, the report explains.
The SSP narratives and drivers were then “used to develop scenarios of energy use, air pollution control, land use and greenhouse gas (GHG) emissions developments using integrated assessment models (IAMs)”, the report says.
The term SSP is now “more widely” used in reference to these final scenarios, the authors say, which are categorised by “the approximate radiative forcing levels each one entails at the end of the 21st century”.
The figure below illustrates how the SSPs (columns) combine with the forcing levels (rows) – note that not all forcing levels are possible under each socio-economic pathway. The figure also shows the “Representative Concentration Pathways” (RCPs), which were used in AR5. These “are not directly comparable” with the SSPs, the report says.
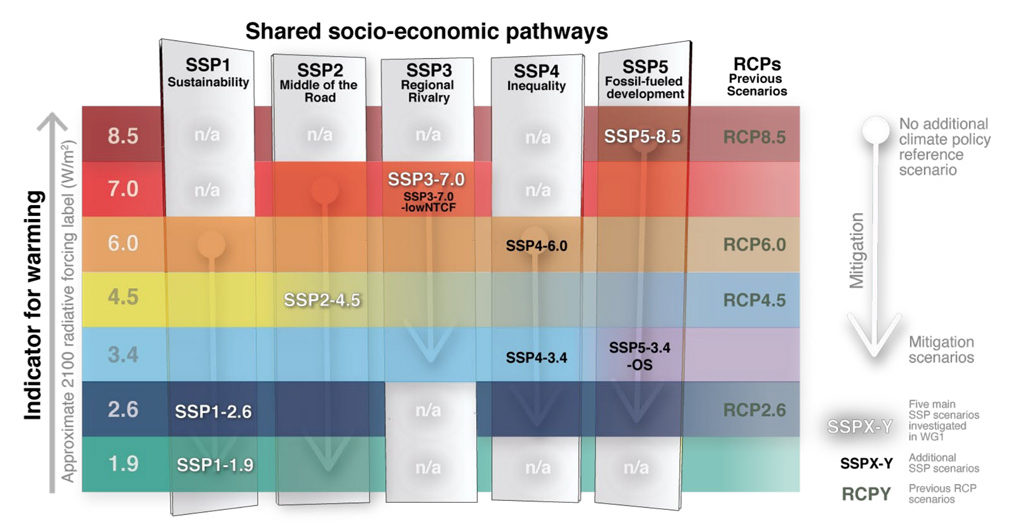
The final SSPs in white lettering indicate the core set of five illustrative SSP scenarios, which spans “a wide range of plausible societal and climatic futures from potentially below 1.5C best-estimate warming to over 4C warming by 2100”, the report says:
- SSP1-1.9: Holds warming to approximately 1.5C above 1850-1900 in 2100 “after slight overshoot” and implied net-zero CO2 emissions around the middle of the century.
- SSP1-2.6: Stays below 2C warming with implied net-zero emissions in the second half of the century.
- SSP2-4.5: Approximately in line with the upper end of combined pledges under the Paris Agreement. The scenario “deviates mildly from a ‘no-additional climate-policy’ reference scenario, resulting in a best-estimate warming around 2.7C by the end of the 21st century”.
- SSP3-7.0: A medium-to-high reference scenario resulting from no additional climate policy, with “particularly high non-CO2 emissions, including high aerosols emissions”.
- SSP5-8.5: A high reference scenario with no additional climate policy. Emissions as high as SSP5-8.5 are only achieved within the fossil-fuelled SSP5 socioeconomic development pathway.
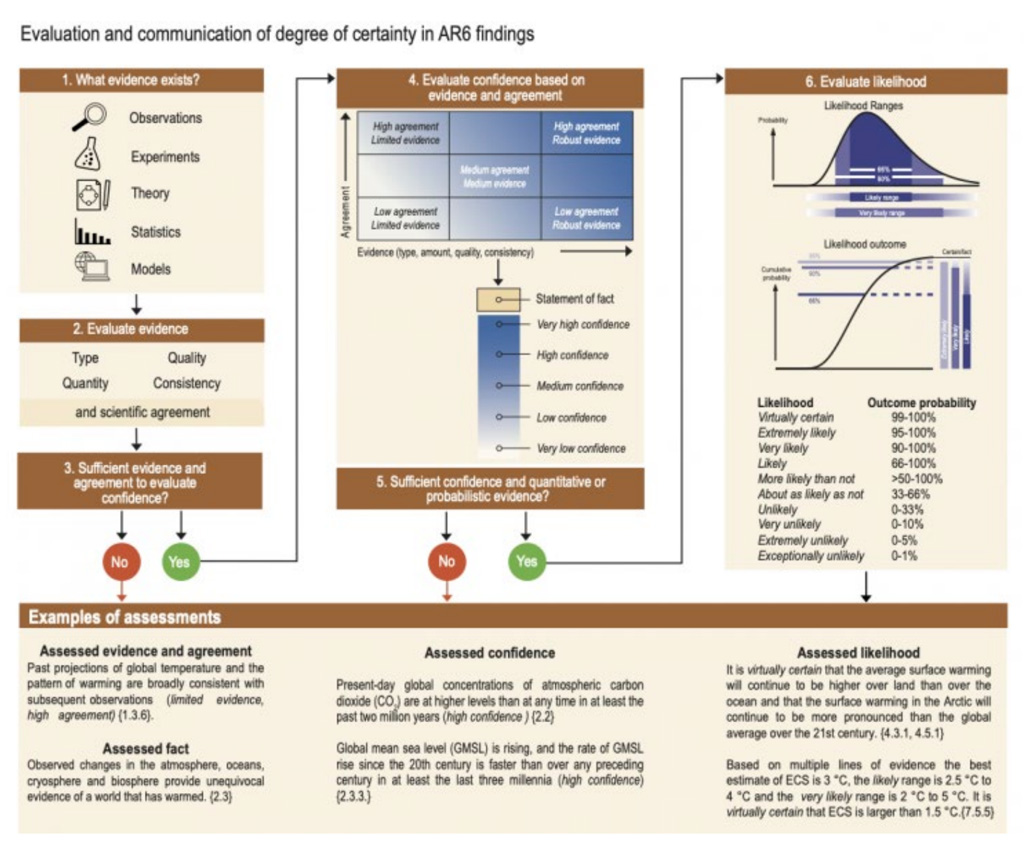
The new report follows the same set of “calibrated language” that AR5 used to communicate levels of certainty behind the statements it included. These terms fall into two categories:
- Confidence: “a qualitative measure of the validity of a finding, based on the type, amount, quality and consistency of evidence…and the degree of agreement.”
- Likelihood: “a quantitative measure of uncertainty in a finding, expressed probabilistically”, based on “statistical analysis of observations or model results, or both, and expert judgement by the author team or from a formal quantitative survey of expert views, or both.”
These statements of confidence and likelihood – listed in the figure below – are shown in italics in the report and in this article, too.
How is Earth’s temperature changing?
The AR6 WG1 report contains an updated assessment of how much the Earth’s temperature has already risen and how “climate drivers” – primarily greenhouse gases – have led to this change.
The information feeding into the report includes the latest observations collected from land and ocean, remote measurements from satellites, and data drawn from climate proxies, which indicate longer term changes in the Earth’s climate.
The report accounts for new and revised datasets and includes a reevaluation of the metrics used to assess global warming.
It also considers the recent occurrence of record warm years, noting that every year during 2015-20 has likely been warmer than any prior year for which records exist. As it stands, 2021 is also shaping up to be among the seven hottest years on record.
The maps below show how the rate of warming has accelerated over the past four decades (bottom) compared to the previous 80 years (top).
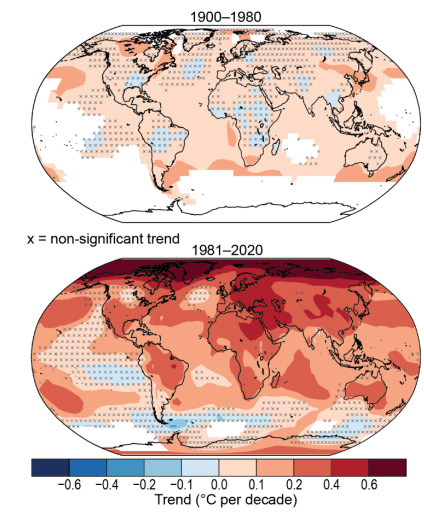
Overall, AR6 concludes that temperatures have been rising faster than in previous IPCC assessment cycles.
This is all laid out in Chapter 2 of the report, which also explores changes in “modes of variability”, meaning natural climate-altering events, such as El Niño and the Indian Ocean Dipole.
With high confidence, the report states:
“Observed changes in the atmosphere, oceans, cryosphere and biosphere provide unequivocal evidence of a world that has warmed. Over the past several decades, key indicators of the climate system are increasingly at levels unseen in centuries to millennia, and are changing at rates unprecedented in at least the last 2,000 years.”
Specifically, global mean surface temperature (GMST) has increased by 1.09C between the pre-industrial baseline period 1850-1900 and the most recent decade of 2011-20. This was more likely than not the warmest in roughly 125,000 years.
The lower chart below, taken from the report, shows the global surface average temperature since 1850, according to four different datasets, as well as the decadal averages.
The upper chart shows that the temperature increase over land – which warmed 1.59C during this period – has been faster than over the ocean, which warmed by 0.88C. A Carbon Brief guest post published in 2020 explains the reasons for this divergence.
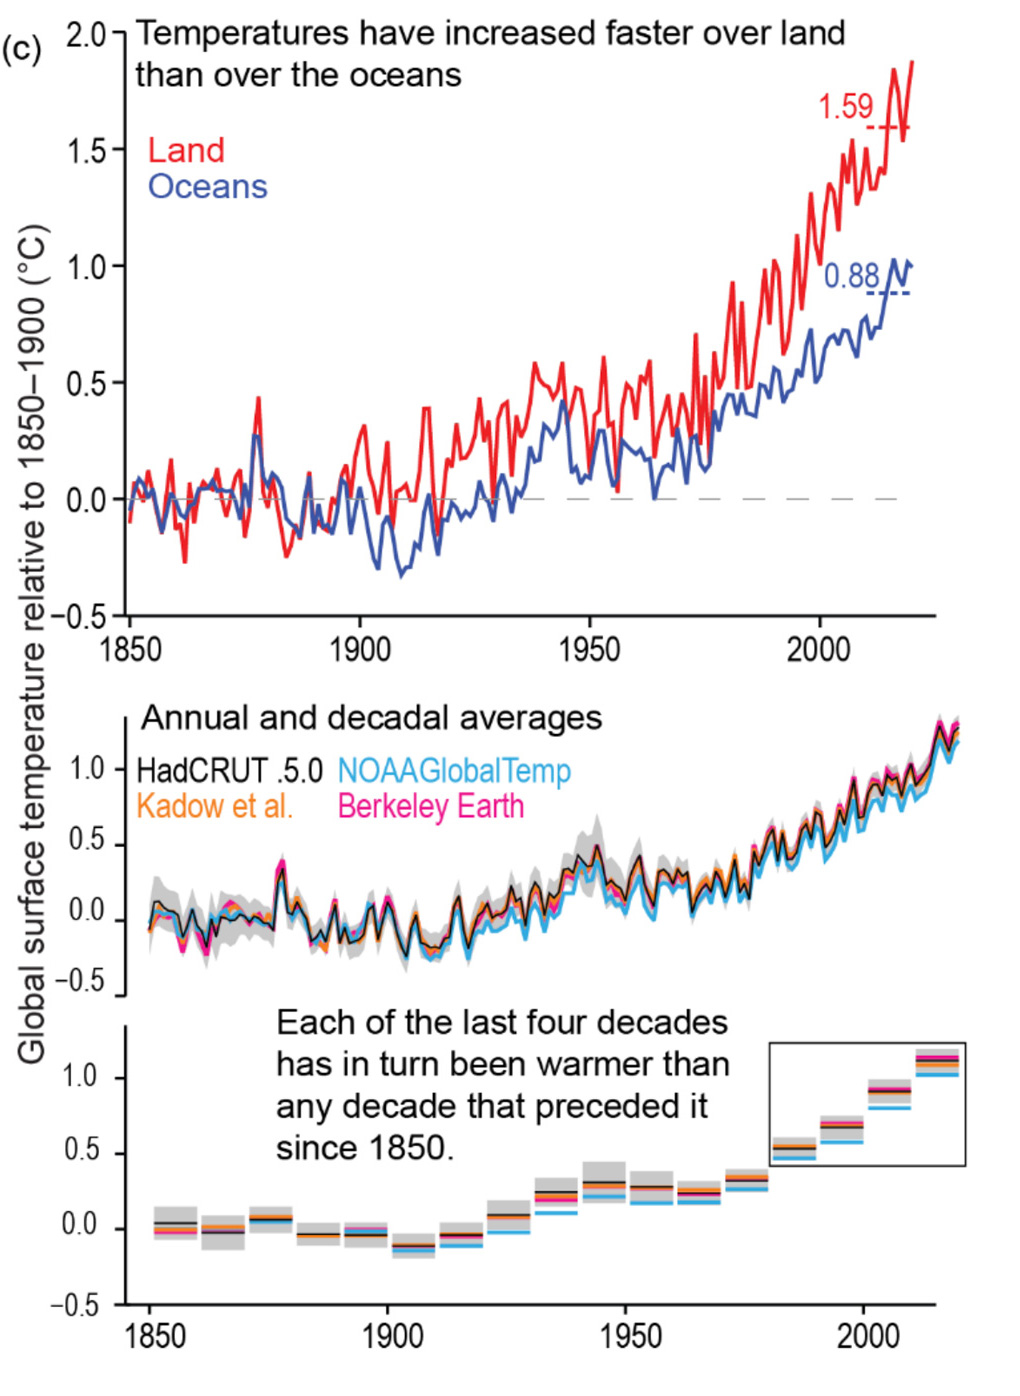
Overall, AR6 estimates that the temperature increase between 1850-1900 and 1986-2005 is 0.08C larger than in AR5.
This is largely due to “dataset innovations” that have taken place over the past eight years, the report explains, which better account for historical changes in the way sea temperatures are measured and provide more comprehensive global coverage.
(Carbon Brief published an explainer in 2017 on how data adjustments affect global temperature records.)
These updates to observational datasets have implications for the remaining carbon budget and the years when warming is expected to breach the 1.5C and 2C thresholds of the Paris Agreement (see: When might global warming reach 1.5C?).
However, the report notes that the increase in warming estimates “has no consequence on the assessment of past climate impacts, nor does it generally imply that projected climate impacts are now expected to occur earlier”.
Instead, the main outcome is that the level of warming associated with a particular impact has been revised upwards, the report adds:
“With this warming now estimated as 0.08C larger than in AR5, the future impacts previously associated with 1.5C warming are now associated with 1.58C warming.”
The report also includes an analysis of the difference between key metrics of global warming.
GMST is the standard metric used when discussing historical, observation-based recordings. It is based on a combination of land-surface air temperatures from weather stations and the sea surface temperature (SST), measured using buoys and ships.
It is subtly different from global surface air temperature (GSAT), which is generally used by climate models. GSAT is also based on land surface air temperatures, but this is combined with temperatures of the air above seawater (“marine air temperature” or “MAT”), rather than of the seawater itself.
Although closely related, the two measures are “physically distinct”, the report notes, and the implications of this “have become more apparent since AR5”. It has been shown, for example, that “MAT and SST can show distinct multidecadal-scale trends and patterns of interannual variability”.
The authors find that there is high confidence that “long-term changes in GMST and GSAT differ by at most 10% in either direction”. However, it adds, “conflicting lines of evidence from models and direct observations combined with limitations in theoretical understanding lead to low confidence in the sign of any difference in long-term trends”. As a result, “long-term changes in GMST/GSAT are presently assessed to be identical, with expanded uncertainty in GSAT estimates”.
Where AR5 used GMST for observed changes and GSAT for projections, AR6 makes “three changes to this approach”. The authors explains:
“First, the AR6 assessment of improved observational records is used. Second, the recent past baseline period is updated from 1986-2005 to 1995-2014, and, third, historical estimates are expressed in GSAT instead of GMST for consistency of historical estimates with future projections.”
As for the greenhouse gases driving global warming, the report states that concentrations of CO2, methane and nitrous oxide “have increased at rates that have no precedent on centennial time scales in at least the past 800,000 years”.
It notes, with high confidence, that concentrations of CO2 in the atmosphere are higher than they have been for at least the past two million years.
The report also says with very high confidence that changes in effective radiative forcing (ERF) resulting from natural factors – such as changes in solar or volcanic activity – since pre-industrial times are “negligible” compared to anthropogenic drivers. (See: What does the report say about the impact humans are having?)
This can be seen in the chart below, with the pink, brown and turquoise lines showing the rise in ERF resulting from rising levels of the greenhouse gases CO2, methane and nitrous oxide, respectively.
The blue line shows the warming impact of halogenated gases, such as hydrochlorofluorocarbons (HCFCs), which are also greenhouse gases and are the products of industrial activities, such as refrigeration and foam production.
Other short-lived gases such as ozone also have a positive ERF, albeit a small one.
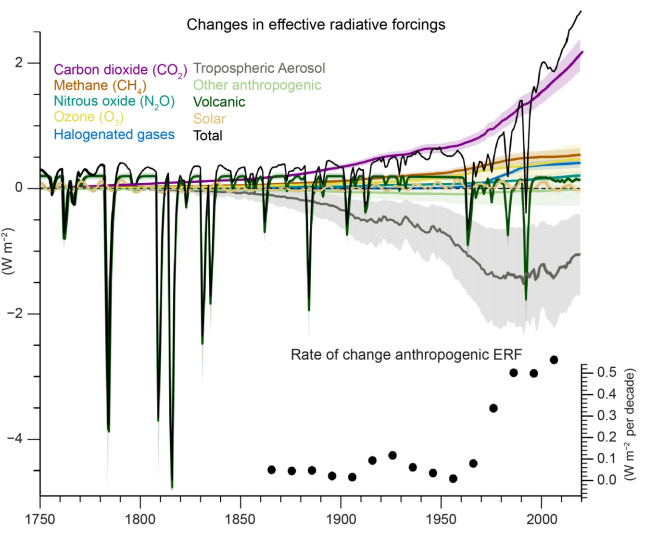
The grey line on the chart shows the impact of aerosols – particles of air pollution that have a net cooling effect as they reflect sunlight away from the Earth.
Overall, apart from some short-lived negative spikes following large volcanic eruptions that produce lots of sunlight-reflecting particles, ERF has been positive and increasing since pre-industrial times, the report says.
AR6 concludes that the rate of change has likely increased in the last 30 years due largely to rising CO2 emissions, and more likely than not also impacted by a decline in cooling by aerosols.
How much warmer will the world get in future?
The Earth will be 1.4-4.4C hotter than pre-industrial levels by the end of this century, AR6 concludes, depending on whether emissions are rapidly cut to net-zero or continue to rise.
The report says:
“It is virtually certain that global surface temperature rise and associated changes can be limited through rapid and substantial reductions in global GHG emissions.”
Compared to AR5, there are a number of important changes in the way that AR6 considers how much warming will take place. These mean that, overall, it projects slightly more warming for similar emissions scenarios, but with a narrower range of uncertainty.
The starting point for future warming is AR6’s affirmation that the decade 2011-20 was already more than a degree hotter than the 1850-1900 period and that it was more likely than not the hottest in roughly 125,000 years. (See: How is Earth’s temperature changing?)
The report goes on to say that the past decade will, nevertheless, be cooler than temperatures throughout the rest of this century, “even under the very low emissions scenarios SSP1-1.9”.
Moreover, it says that the 1.5 and 2C limits of the Paris Agreement will be breached unless there are rapid and stringent cuts in emissions of CO2 and other greenhouse gases. It adds that warming will continue until mid-century – even if deep emissions cuts take place.
The AR6 SPM says:
“Global surface temperature will continue to increase until at least the mid-century under all emissions scenarios considered. Global warming of 1.5C and 2C will be exceeded during the 21st century unless deep reductions in CO2 and other greenhouse gas emissions occur in the coming decades.”
But the report makes clear that there is still a choice about how much warming will take place this century. (See: What does the report say about ‘net-zero’?).
Specifically, the report explores “possible climate futures” through five “core” emissions scenarios, spanning the “very low emissions” SSP1-1.9, “low” SSP1-2.6 and “intermediate” SSP2-4.5, through to “high” SSP3-7.0 and “very high” SSP5-8.5. (See: What is this report?)
The amount of warming projected under each of these scenarios is shown in the chart below. In the lowest emissions scenario SSP1-1.9 (light blue line), temperatures reach 1.4C above 1850-1900 levels in 2081-2100, whereas they climb 4.4C under SSP5-8.5 (dark red).
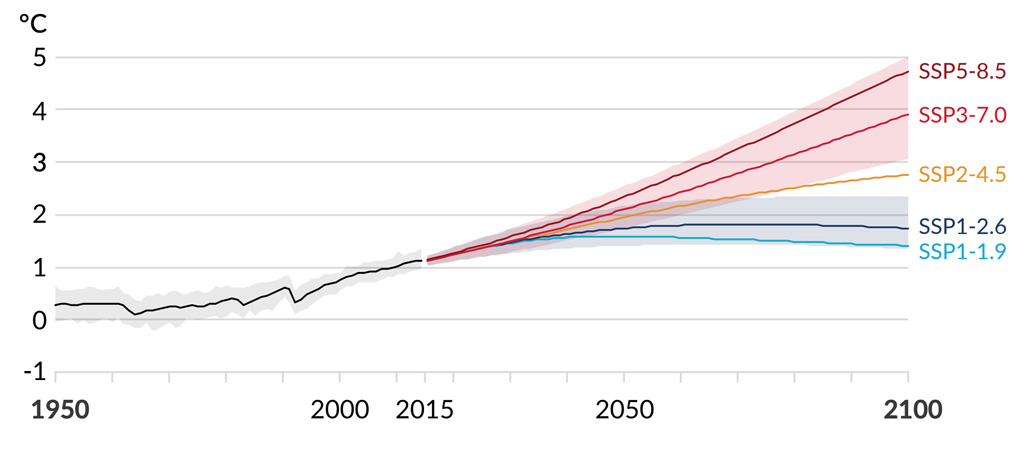
The report says warming is very likely to be 1.0-1.8C by 2081-2100 in the lowest emissions SSP1-1.9 scenario, 2.1-3.5C in the intermediate SSP2-4.5 and 3.3-5.7C under SSP5-8.5.
The full set of warming projections for the 20-year periods 2021-40, 2041-60 and 2081-100 are shown in the table below, with central “best estimates” and very likely ranges shown separately for each period and for each emissions scenario.
| Near term, 2021–2040 | Mid-term, 2041–2060 | Long-term, 2081–2100 | ||||
|---|---|---|---|---|---|---|
| Scenario | Best estimate (C) | Very likely range (C) | Best estimate (C) | Very likely range (C) | Best estimate (C) | Very likely range (C) |
| SSP1–1.9 | 1.5 | 1.2 to 1.7 | 1.6 | 1.2 to 2.0 | 1.4 | 1.0 to 1.8 |
| SSP1–2.6 | 1.5 | 1.2 to 1.8 | 1.7 | 1.3 to 2.2 | 1.8 | 1.3 to 2.4 |
| SSP2–4.5 | 1.5 | 1.2 to 1.8 | 2.0 | 1.6 to 2.5 | 2.7 | 2.1 to 3.5 |
| SSP3–7.0 | 1.5 | 1.2 to 1.8 | 2.1 | 1.7 to 2.6 | 3.6 | 2.8 to 4.6 |
| SSP5–8.5 | 1.6 | 1.3 to 1.9 | 2.4 | 1.9 to 3.0 | 4.4 | 3.3 to 5.7 |
The SPM further notes:
“The last time global surface temperature was sustained at or above 2.5C higher than 1850–1900 was over 3m years ago (medium confidence).”
The report looks in detail at when – or whether – the 1.5C warming limit will be breached under the various emissions scenarios. (See: When might global warming reach 1.5C?)
A key innovation in AR6 is that its warming projections are “for the first time” based on multiple lines of evidence, including observations of historical and recent warming trends. This is a major shift, as earlier IPCC projections were based entirely on climate models.
These “assessed warming” projections in AR6 are based on a combination of the latest CMIP6 climate models and the report’s updated estimate of climate sensitivity. (See: How have climate sensitivity estimates changed since AR5?)
Specifically, the assessed warming combines a subset of CMIP6 models that are able to accurately reproduce historical warming trends, with projections based on the estimated range of “equilibrium climate sensitivity”, which is not derived from climate models.
The multiple lines of evidence used to assess future warming produce “consistent results”, the report says, meaning it has high confidence in its projections.
The report explains that the CMIP6 models are better, with high confidence, at simulating “most large-scale indicators of climate change” than the previous CMIP5 models.
This is thanks to “new and better representation of physical, chemical and biological processes, as well as higher resolution”, in particular improved simulation of clouds.
However, it adds that some of the CMIP6 models simulate higher rates of warming this century that are very unlikely, based on other lines of evidence. This is why AR6 uses “observational constraints” to select a subset of CMIP6 for its warming projections.
The new report projects slightly more warming for a given emissions pathway than AR5, as shown in the chart below. For example, in the low emissions RCP2.6 pathway, the AR5 best estimate of warming by 2081-2100 was 1.6C, whereas for SSP1-2.6 in AR6 it is 1.8C.
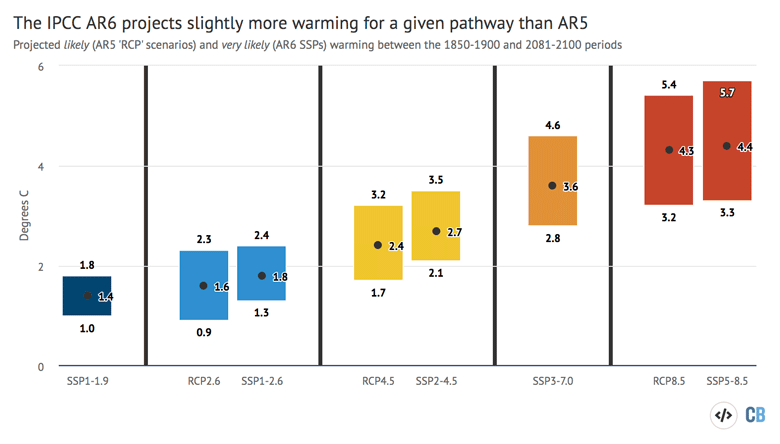
Projected warming under similar emissions scenarios in the IPCC AR5 and AR6 reports, degrees C in 2081-2100 relative to 1850-1900. Dots show best estimates and columns show the range of uncertainty assessed as likely for the AR5 “RCP” scenarios and very likely for the AR6 SSP scenarios. Source: IPCC (2014) and (2021). Chart by Carbon Brief using Highcharts.
The higher warming projections are due to a range of factors, including the higher estimate of historical warming in AR6 and updated estimates of climate sensitivity.
The pathways of emissions of each greenhouse gas are also not exactly the same in the SSPs as they were for the RCPs that were used for AR5.
While AR6 says there will be slightly more warming for similar pathways, it also dramatically increases the level of certainty attached to its warming projections, compared with AR5.
Whereas AR5 set its projections within a likely range of uncertainty, AR6 increases this to a very likely range. In practice, this means that while AR5 saw a 33% chance that warming would be higher or lower than its projections, for AR6 the likelihood is reduced to just 10%.
The remaining uncertainty is “dominated” by uncertainty over how sensitive the climate is to additional greenhouse gas emissions, the report says, with very high confidence.
This is one of the three major sources of uncertainty about how much warmer the world will get in the future, with the second being the path of future emissions – as represented by the SSP scenarios – and the third being the “carbon cycle feedback”.
Notably, the report puts the SSP scenarios at arms’ length, saying their “feasibility or likelihood” was not considered, with feasibility – the how and if – being a question for WG3, which is due to published in 2022.
Some have questioned the likelihood of emissions reaching the very high levels seen in the SSP5-8.5 and “RCP8.5” scenario and this scepticism is duly noted in the report.
But it says that the projections from the SSP5-8.5 scenario “can still be valuable” and that the concentrations of greenhouse gases it contains “cannot be ruled out”.
This is due to “uncertainty in carbon-cycle feedbacks”, which could push CO2 concentrations towards the levels in SSP5-8.5 even under “nominally lower emissions trajectories”.
Carbon cycle feedbacks include the release of methane from thawing permafrost or shifts in forest ecosystems as a result of higher CO2 levels and higher warming.
AR6 says that there is high confidence that warming will lead to carbon release from the thawing of permafrost, but there is low confidence in the timing and size of emissions. (See: What does the report say about abrupt changes and ‘tipping points’?)
Overall, it says that estimates of carbon cycle feedbacks do not affect the AR6 projections of warming this century, with high confidence. Nevertheless, “large uncertainties” remain:
“[T]hese feedbacks represent identified additional risk factors that scale with additional warming and mostly increase the challenge of limiting warming to specific temperature levels.”
The report also looks at how much hotter the world will get in the longer term, with warming by 2300 potentially reaching levels “that have not been seen in millions of years”.
It says there is medium confidence that an intermediate emissions pathway would lead to 2.3-4.6C of warming by 2300, similar to the “Pliocene Warm Period” about 3.2m years ago.
The very high emissions SSP5-8.5 scenario would lead to warming of 6.6-14.1C by 2300, AR6 adds, a level not seen since the “Early Eocene Climate” about 50m years ago.
When might global warming reach 1.5C?
Since parties to the Paris Agreement pledged to “pursue efforts” to keep global warming below 1.5C, there has been an increasing focus on this more ambitious climate goal.
In 2018, as requested by the Paris text, the IPCC published a special report on 1.5C (SR15) that looked at questions including how close the world was to breaching the limit, what it would take to avoid doing so and what might happen if those efforts failed.
The WG1 report from AR6 revisits the first part of these questions, looking predominantly at when global warming might reach 1.5C above pre-industrial levels.
Contrary to some media reports, the findings are very similar. The SPM says in a footnote that, based on a like-for-like comparison of the two: “[T]he SR1.5 estimate of when 1.5C global warming is first exceeded is close to the best estimate reported here.”
According to the AR6 report, in broad terms, the temperature limit of 1.5C “would be exceeded during the 21st century” under intermediate or higher emissions scenarios.
AR6 explains that warming during 2021-40 is very likely to exceed 1.5C under very high emissions and is likely to do so under intermediate or high emissions. Even if emissions are low, as in SSP1-2.6, near-term warming is more likely than not to breach 1.5C.
The picture is more nuanced in the very low emissions SSP1-1.9 scenario, where global greenhouse gases decline “from the 2020s onwards” and CO2 reaches net-zero “in the 2050s”.
Under this pathway, near-term warming is more likely than not to “reach” 1.5C, the report says, but temperatures are more likely than not to fall back below 1.5C later this century “with a temporary overshoot of no more than 0.1C”. Moreover, warming would be extremely likely to stay below 2C.
The report goes on to assess when, more precisely, the world might have warmed by 1.5C and 2C.
It defines the “threshold-crossing time” as the midpoint of the first 20-year period when the global surface air temperature (GSAT) averages higher than the threshold temperature.
For 1.5C, the AR6 report says:
“In all scenarios assessed here except SSP5-8.5, the central estimate of crossing the 1.5C threshold lies in the early 2030s.”
Specifically, the report says that under the lowest emissions SSP1-1.9, the 1.5C limit will be exceeded during the 20-year period from 2025-44, implying a crossing time half way through 2035.
For SSP1-2.6, the range and crossing time are 2023-2042 and 2032, while the figures are the same, at 2021-40 and 2030 for the intermediate and high emissions scenarios. For the very high emissions SSP5-8.5, the 1.5C crossing time is half way through 2027.
These AR6 estimates of the 1.5C crossing (“exceedance”) time are shown in the figure below, along with similar numbers from the SR15 (on the left-hand side) and analysis published by Carbon Brief last year.
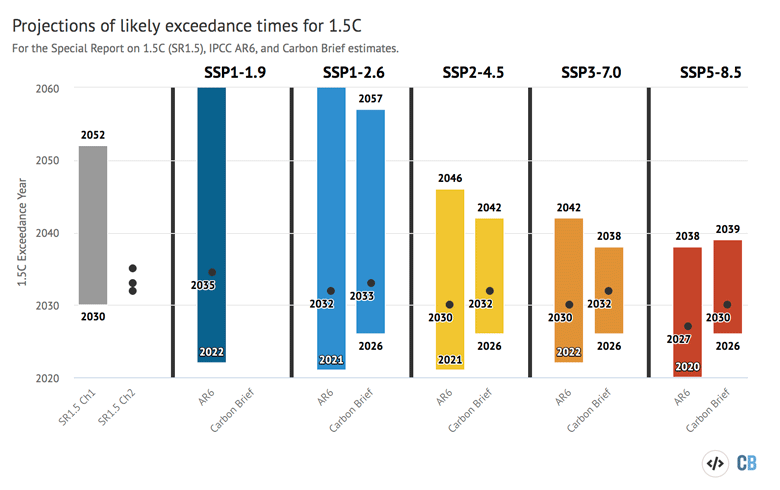
Range of possible 1.5C exceedance years from Chapter 1 and Chapter 2 of the IPCC SR15 report (grey bar and dots, respectively), as well as AR6 and Carbon Brief exceedance year estimates for each of the SSPs. Dots represent central estimates (when available), while bars represent the very likely (5–95%) range. 20-year average periods in the AR6 are converted to expected exceedance years by taking the midpoint of the range. Note that bars extending to the top of the graph represent cases where the uncertainty range encompases outcomes that never exceed 1.5C. Chart by Carbon Brief using Highcharts.
The SPM, agreed with IPCC member governments and written after the rest of the report, gives a lengthy explanation of how the SR15 and AR6 estimates should – and should not – be compared.
It says, specifically, that the AR6 work on 1.5C crossing years is more detailed and “not directly comparable” to the headline finding in the SR15 SPM. The footnote explains:
“The AR6 assessment of when a given global warming level is first exceeded benefits from the consideration of the illustrative scenarios, the multiple lines of evidence entering the assessment of future global surface temperature response to radiative forcing, and the improved estimate of historical warming. The AR6 assessment is thus not directly comparable to the SR1.5 SPM, which reported likely reaching 1.5C global warming between 2030 and 2052, from a simple linear extrapolation of warming rates of the recent past. When considering scenarios similar to SSP1-1.9 instead of linear extrapolation, the SR1.5 estimate of when 1.5C global warming is first exceeded is close to the best estimate reported here.”
Earlier drafts of the underlying chapters of AR6 had made this comparison, noting that estimates of when 1.5C will be exceeded are “about 10 years earlier than the midpoint of the likely range (2030-52) assessed in the SR1.5”.
This line had also been repeated in earlier drafts of the SPM and consequently appeared in some early media coverage, based on leaked drafts of the report.
But following the approval of the SPM, references to “10 years earlier” have been removed from the final version of AR6 via the “trickle back” document that ensures consistency between the government-approved summary and the rest of the report.
Instead, the report now says the AR6 estimate of when 1.5C will be crossed lies “in the early part of the likely range (2030-52) assessed in the SR1.5”.
As the SPM’s footnote explains and the chart above shows, SR15 also contained a second set of crossing year estimates in its chapter 2, which are both more directly comparable to those set out in AR6 – and come to very similar conclusions.
These details will be discussed at greater length in a dedicated Carbon Brief analysis due to be published shortly.
Finally, the WG1 report notes that global temperatures in any single year can be higher or lower than the long-term average due to natural variability.
It says, with medium confidence, that by 2030 there is a 40-60% chance that any given year will be more than 1.5C hotter than pre-industrial levels, depending on emissions pathway.
However, this would not mean the Paris goals have been breached, as a recent Carbon Brief article explained. AR6 notes:
“The occurrence of individual years with global surface temperature change above a certain level, for example 1.5C or 2C, relative to 1850-1900 does not imply that this global warming level has been reached.”
How are rainfall patterns changing?
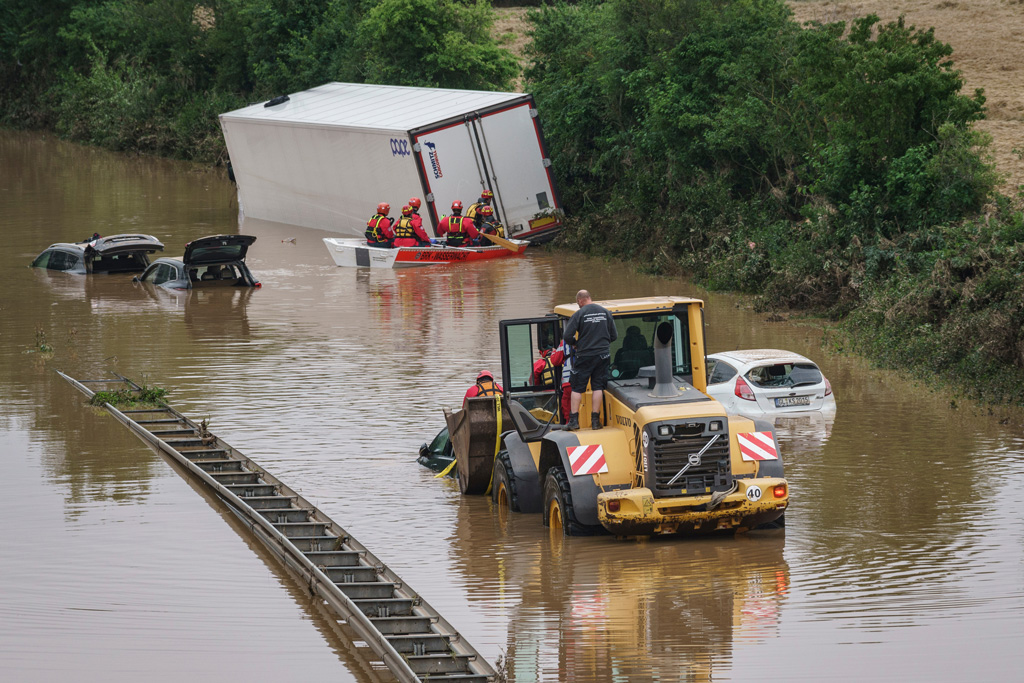
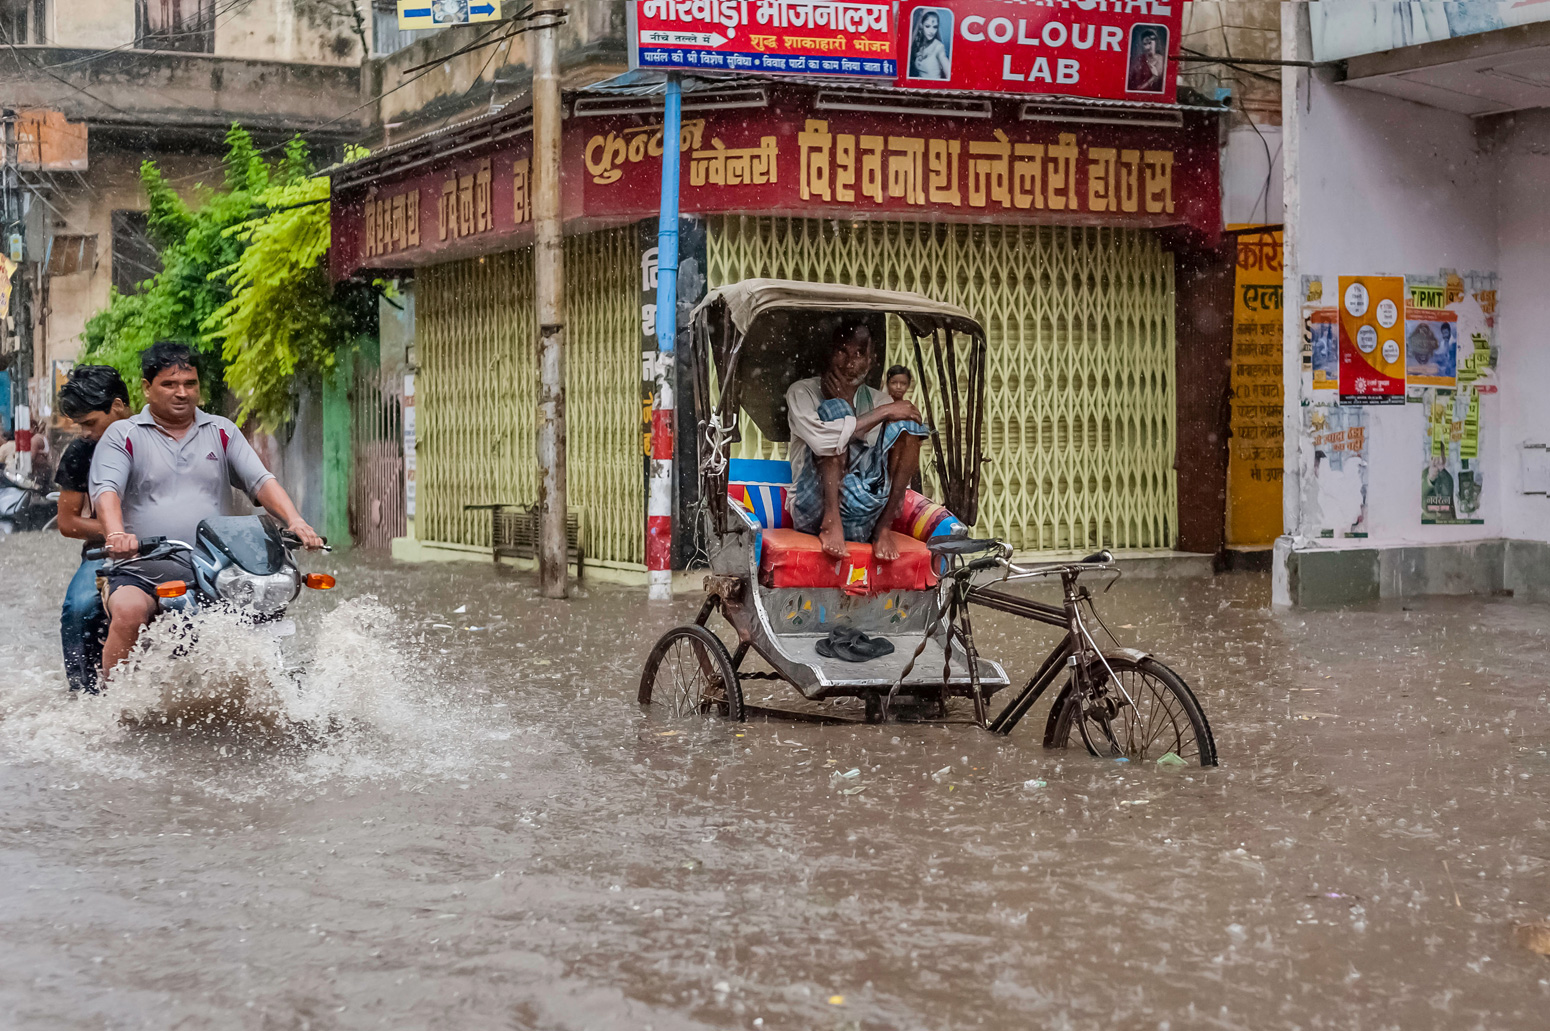
The impact of global warming on rainfall is especially pertinent given the record-breaking floods that have recently struck countries across the northern hemisphere.
The report is clear that climate change is already having an impact on the water cycle and driving such extreme events. It states that evidence for the link between rising temperatures and heavy precipitation events has “strengthened since AR5”.
However, these interactions are complex and affect different parts of the world in different ways.
AR6 considers real-world observations of changing rainfall patterns, as well as palaeoclimate evidence, reanalyses of data and model simulations.
It incorporates improvements since AR5, including longer and more consistent datasets, new historical simulations and improved detection-attribution tools.
In total, these innovations have “enabled a more comprehensive assessment and a better understanding of recent observed water cycle changes, including the competing effects of greenhouse gases and aerosol emissions”.
Other additions include new palaeoclimate reconstructions, particularly from the southern hemisphere, and “advances in modelling clouds, precipitation, surface fluxes, vegetation, snow, floodplains, ground water and other processes relevant to the water cycle”, the report says.
The water cycle is discussed in-depth in Chapter 8 of the report, with some discussion in Chapter 2 as well.
With high confidence, the report concludes that global average precipitation and evaporation are increasing with global warming – very likely with a range of 1-3% per degree C.
It says that land precipitation has likely increased since 1950 and has been increasing faster since the 1980s. In an executive summary of Chapter 8, the report says it shows:
“Widespread, non-uniform human-caused alterations of the water cycle, which have been obscured by a competition between different drivers across the 20th century that will be increasingly dominated by greenhouse gas forcing at the global scale”.
The “different drivers” it mentions include factors such as human-caused aerosols – particles of air pollution and smoke – as well as land-use change and water extraction, all of which can impact rainfall and the wider water cycle.
Outcomes expected with high confidence as the planet warms include:
- Wetter wet seasons and events.
- More severe “very wet” and “very dry” events.
- More intense heavy precipitation events and greater flood hazards during such events.
- Increased severity of droughts as warming over land drives an increase in evaporation.
- Drying in some regions as greater warming over land than over oceans shifts atmospheric circulation patterns and reduces relative humidity (although the report also notes that humidity has very likely increased over land and likely over the oceans as well, a phenomenon explained in this Carbon Brief guest post.)
- A slowdown of tropical circulation that partly offsets the warming-induced strengthening of precipitation in monsoon regions.
In northern high latitudes, the report concludes – with high confidence – that there has already been a “detectable” increase in rainfall, driven by greenhouse gas-induced radiative forcing.
Meanwhile, the dry summer climate in areas such as the Mediterranean, South Africa and western North America has become drier, it says, with medium to high confidence.
It notes with medium confidence there has also been an increase in the contrast between wet and dry seasons in tropical climates.
Large-scale atmospheric circulation has also likely been changing in recent decades, although the report says that there is low confidence in how these compare to longer-term trends owing to a lack of proxy data.
For example, it says that, since the 1980s, the global-scale atmospheric circulation known as the Hadley cell has very likely widened, monsoon rains have likely increased and the northern stratospheric polar vortex – which was behind the much-discussed “Beast from the East” that struck the UK in 2018 – has weakened and experienced “more frequent excursions towards Eurasia”.
The report states that understanding how the width and strength of the Intertropical Convergence Zone (ITCZ) – a band of low pressure around the equator which governs the rainfall for much of the tropics – respond to a warming climate has improved since AR5.
It concludes, with high confidence, that rising temperatures will narrow and strengthen the ITCZ, resulting in more rainfall around its core and less towards the north and south. There is medium confidence that this is already happening.
So far, increases in monsoon intensity due to global warming have been somewhat stifled by cooling due to aerosols in the atmosphere, the report says – with high confidence.
In the future, projections suggest with medium confidence that some monsoons will increase in intensity, namely in south, south-east and east Asia, while others will decrease – for example, in North America.
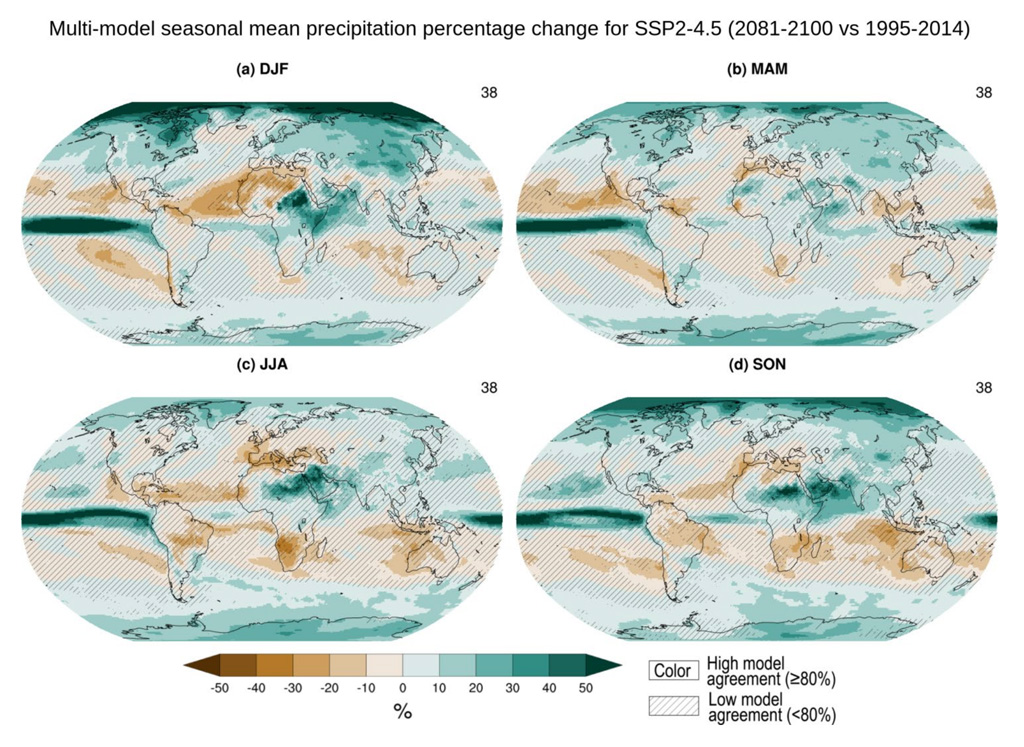
More broadly, the report says with high confidence that “without large-scale reduction in greenhouse gas emissions, global warming is projected to cause substantial changes in the water cycle at both global and regional scales”.
The maps below show the projections for global precipitation change for each season by 2081-2100, relative to 1995-2014, for the SSP2-4.5 scenario. The shading indicates increases (green) and decreases (brown) in precipitation, while the hatching shows areas with low model agreement.
The report also says with high confidence that the projected increases in rainfall volume and intensity will mean increased runoff in the northern high latitudes and that precipitation extremes will increase almost everywhere.
Such extremes will take place even in regions where seasonal average precipitation is projected to decrease, it adds with medium confidence.
At the same time, it also states with high confidence that the “total land area subject to increasing drought frequency and severity will expand”, with tropical areas such as the Amazon and Central America becoming increasingly arid.
However, the report notes that, while global climate models have become much better at representing key processes, “they are still limited in their ability to simulate all aspects of the present-day water cycle and to agree on future changes”.
Finally, the report says that “abrupt human-caused changes to the water cycle cannot be excluded”. Continued deforestation in the Amazon in combination with a warming climate, for example, “raises the probability that this ecosystem will cross a tipping point into a dry state during the 21st century (low confidence)”, the report says.
In addition, palaeoclimate records suggest a collapse of the Atlantic Meridional Overturning Circulation (AMOC) causes “abrupt shifts in the water cycle (high confidence), such as a southward shift in the tropical rain belt, weakening of the African and Asian monsoons and strengthening of southern hemisphere monsoons”, the report notes. (See: What does the report say about abrupt changes and ‘tipping points’?)
What impact is warming having on the world’s snow and ice?
Sea ice
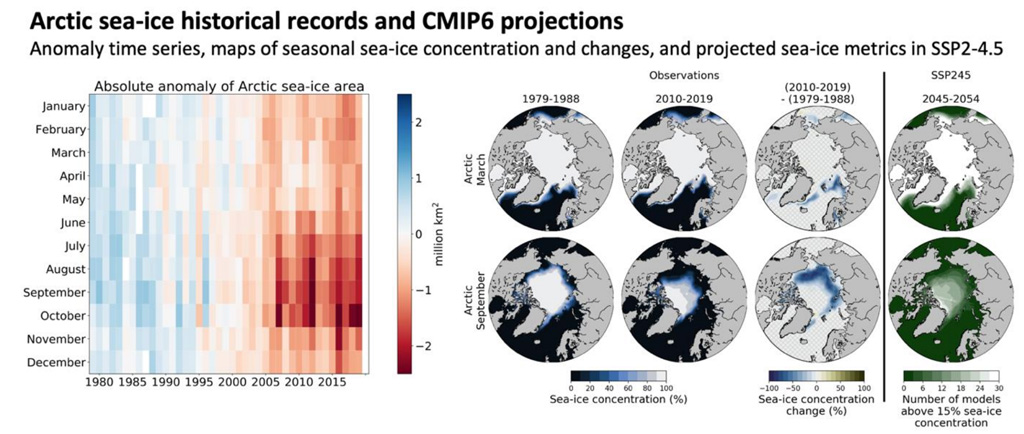
Climate change is causing ice and snow to melt across much of the planet. The report has high confidence that, between the decades of 1979-88 and 2010-19, average monthly August-October Arctic sea ice area shrunk by around one quarter – resulting in the loss of around 2m square kilometres (km2) of ice.
Furthermore, rising temperatures have driven a shift from thick, multiyear ice towards thinner, younger ice. While multi-year ice made up roughly one third of Arctic sea ice coverage in March 1985, according to the report, multiyear ice made up only 1.2% in March 2019. The loss of multi-year sea ice was particularly rapid during the 2000s, it adds.
The possibility of an “ice-free” Arctic summer has long been a research area of interest. The SPM states that “The Arctic is likely to be practically sea-ice free [indicating a sea-ice area below 1m km2] in September at least once before 2050 under the five illustrative scenarios considered in this report, with more frequent occurrences for higher warming levels”.
However, the main report stresses that there is no “tipping point” for the loss of summer Arctic sea ice.
The figure below shows observations of Arctic sea ice concentration and projected changes under SSP2-4.5.
Meanwhile, for Antarctic sea ice, the report finds “no significant trend in satellite-observed sea ice area over 1979-2020 in both summer and winter”, adding that there is low confidence in past and future simulations of Antarctic sea ice.
Ice sheets
Moving to land ice, AR6 focuses on the planet’s two ice sheets of Greenland and Antarctica.
Greenland lost 175bn tonnes (Gt) of mass per year over 2000-09, according to the report, but the rate accelerated to 243Gt per year over 2010-19. It adds that decreasing surface mass balance (SMB) – the difference between snow added to the ice sheet and melting at the surface, rather than discharge from ice calving and submarine melting – is dominating Greenland mass loss as the climate warms. There is high confidence that this trend will continue into the future, the report says.
According to the report, Greenland is virtually certain to continue losing mass throughout the century under all considered SSP scenarios. It adds that the ice sheet is likely to contribute between 0.01-0.10m of sea level rise under SSP1-2.6 and 0.09-0.18m under SSP5-8.5 by the end of the century, relative to 1995-2014 levels.
Meanwhile, mass loss from the Antarctic ice sheet is also accelerating. The report notes that the ice sheet lost an average of 70Gt per year over 2000-09 and 148Gt per year over 2010-19. However, it adds that mass loss was not uniform across the ice sheet, stating with very high confidence that mass loss in the West Antarctic ice sheet (WAIS) has dominated mass loss since the late 1970s.
The report has high confidence that parts of the East Antarctic ice sheet (EAIS) have lost mass over the last two decades, but is “currently unclear” whether mass loss from the entire sheet is “essentially zero within uncertainties”.
The report finds it likely that the Antarctic ice sheet will continue to lose mass throughout the century under all emission scenarios, contributing 0.03-0.27m towards sea level rise under SSP1-2.6 and 0.03-0.34 m under SSP5-8.5 by 2100. However, the SPM adds:
“There is limited evidence for low-likelihood, high-impact outcomes (resulting from ice sheet instability processes characterised by deep uncertainty and in some cases involving tipping points) that would strongly increase ice loss from the Antarctic Ice Sheet for centuries under high GHG emissions scenarios.”
(See: How have projections of sea level rise changed since AR5? for more on these processes and their potential impacts of sea levels.)
Glaciers
“The global nature of glacier retreat, with almost all of the world’s glaciers retreating
synchronously, since the 1950s is unprecedented in at least the last 2,000 years”, the SPM states, with medium confidence. The report adds that, over this period, 25% of mass loss came from Alaska and 13% from glaciers on the periphery of Greenland.
Glaciers have a “lagged response” to temperature changes and will continue to lose mass for “at least several decades” after temperatures stabilise, according to the report. It projects that, by 2100, glaciers will lose 18% and 36% of their early-21st-century mass under RCP2.6 and RCP8.5, respectively. It adds:
“There is limited evidence and low confidence that at sustained warming levels between 1.5C and 2C, about 50-60% of glacier mass will remain, predominantly in the polar regions. At sustained warming levels between 2C and 3C, about 50-60% of glacier mass outside Antarctica will be lost and at sustained warming levels between 3C and 5C, 60-75% of glacier mass outside Antarctica will disappear.”
Permafrost and seasonal snow cover
Permafrost – year-round frozen ground – is particularly widespread in the northern hemisphere, where it underlies about 15% of land. The report finds that areas of permafrost have warmed globally by a likely range of 0.17-0.41C over 2007-16.
The top layer of permafrost – known as the “active layer” – undergoes annual cycles of freezing and thawing. The report finds that the active layer has become thicker – meaning that deeper soil is thawing in summer – in high-elevation areas of Asia and Europe since the mid-1900s. It adds that it has medium confidence that “an increase in the active layer thickness is a pan-Arctic phenomenon”.
The report is virtually certain that permafrost extent and volume will shrink as the climate warms. It estimates that the volume of permanently frozen soil within the top three metres of the ground will drop by 25% for every 1C of global surface air temperature increase.
Snow cover is more prevalent in the northern hemisphere and the report finds a very high confidence of “substantial reductions” in snow cover area in the region since 1978 – especially in spring. It adds that, over 1981-2010, northern hemisphere snow extent decreased by 1.9m km2 for every 1C of warming throughout the snow season.
Further decreases in snow cover are virtually certain as warming continues, the report says. The authors have medium confidence that spring snow cover in the northern hemisphere will decrease by around 8% for every 1C of global surface air temperature increase – except “when snow cover vanishes”. The report explains:
“This occurs at about +2C of GSAT change above the 1995-2014 level (that is, about +3C above the pre-industrial level) for the months of July and August, and at about +3C above the 1995-2014 level for June and September.”
What does the report say about changes to the oceans?
The world’s oceans have absorbed the bulk of human-induced warming since the industrial era – about 90% of the excess heat. The current rates of heat-content gain are “greater than at any point” since the end of the last ice age, the report notes:
“Only during a short period of rapid warming at the end of the Younger Dryas (12.75-11.5 ka [thousands of years ago]) were rates comparable to those observed since the 1970s.”
New observations and analyses over the past several years “strengthen” the findings of AR5 (pdf) and the SROCC of a “sustained rise” in ocean heat content since the industrial era, the report says.
Warming rates are highest in the upper 700m of the ocean, due to the slow circulation of waters from the surface to the deep. The confidence in the warming signal decreases slightly with depth – while the report classifies warming in the upper 700m as virtually certain, warming in the layer from 700-2000m as very likely and warming below that is classed as likely.
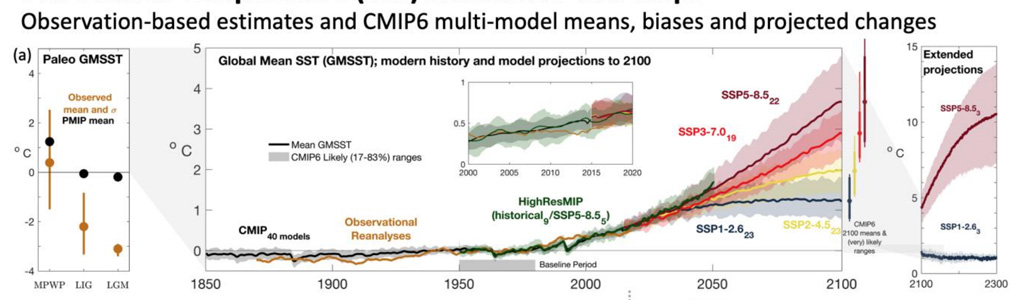
The data also show “unambiguously” that global average sea surface temperature (SST) has increased over the 20th century, the report says. The average SST increase from 1850-1900 to 2011-2020 has been 0.88C, with more than two-thirds of that increase occurring since 1980.
New data, including the digitisation of old temperature records, have made “substantial improvements” in the coverage of “data sparse regions and times” since AR5 was released. In addition, key datasets have been updated since AR5 that have resulted in more accurate estimates of SST, the report notes.
From 1995-2014 to 2081-2100, SST is projected to increase on average by 0.86C under SSP1-2.6 and by an average of 2.89C under SSP5-8.5. The chart below shows both reconstructed global mean SST from palaeoclimate records (left), CMIP model reconstructions, historical data and projections out to 2100 (centre) and projections to 2300 (right).
Enhancements in large-scale datasets have also “strengthened the observational support” for changes in ocean salinity since AR5 and the SROCC, the report finds. It is virtually certain that high-salinity regions of the ocean have become saltier and comparatively fresher regions of the ocean have become fresher since 1950.
As with changes in salinity, sea-surface warming has not been felt evenly around the world. The fastest warming has been observed in the Indian Ocean and in currents such as the Gulf Stream, the report finds, while other regions of the ocean have warmed more slowly or even cooled since the industrial era. But, across all warming scenarios, “at least 83% of the ocean surface will very likely warm over the 21st century”, the IPCC concludes.
As the surface ocean warms, it becomes more stratified (more stable), since warm water is less dense than cooler water. New, “refined” analyses of global datasets since the SROCC mean that the new estimate of this stratification is increased – 4.9% from 1970-2018 – and is twice as high as the previous one. It is virtually certain that the stability of the upper ocean will “continue to increase throughout the 21st century”, the authors say.
Increased stability can “affect vertical exchanges” between the surface and deeper parts of the ocean, the report says, as well as the large-scale ocean circulation. As a result, it contributes to observed changes in the ocean’s uptake of atmospheric gases, such as oxygen.
There has been an observed decrease of 0.5-3.3% of dissolved oxygen from the upper 1,000m of the open ocean between 1970-2010. This increase in deoxygenation is due to a number of factors, the report says, attributing 15% to solubility effects – gases dissolve less readily in warmer waters than in cold ones. Decreased transport due to higher stability in the upper ocean comprises “most of the remaining deoxygenation”, with changes in respiration also playing a role.
CMIP6 models project a 32-71% greater decline in oxygen in the subsurface ocean (100-600m) than their CMIP5 predecessors. This “continuing and accelerating decline” will result in “historically unprecedented” oceanic oxygen levels over the 21st century, the authors warn.
Deoxygenation enhances the release of nitrous oxide (N2O), methane and CO2 from the ocean, the report says – especially in regions that are already low-oxygen environments – but other oceanic processes may partially or fully offset some of these increased GHG losses.
To date, the ocean has absorbed about 20-30% of humanity’s CO2 emissions. As the ocean takes up CO2, its pH gets lower and lower through a process known as ocean acidification. The report says it is virtually certain that there has been a decrease in the pH of the surface ocean at a rate of -0.017 to -0.027 pH units per decade since the late 1980s.
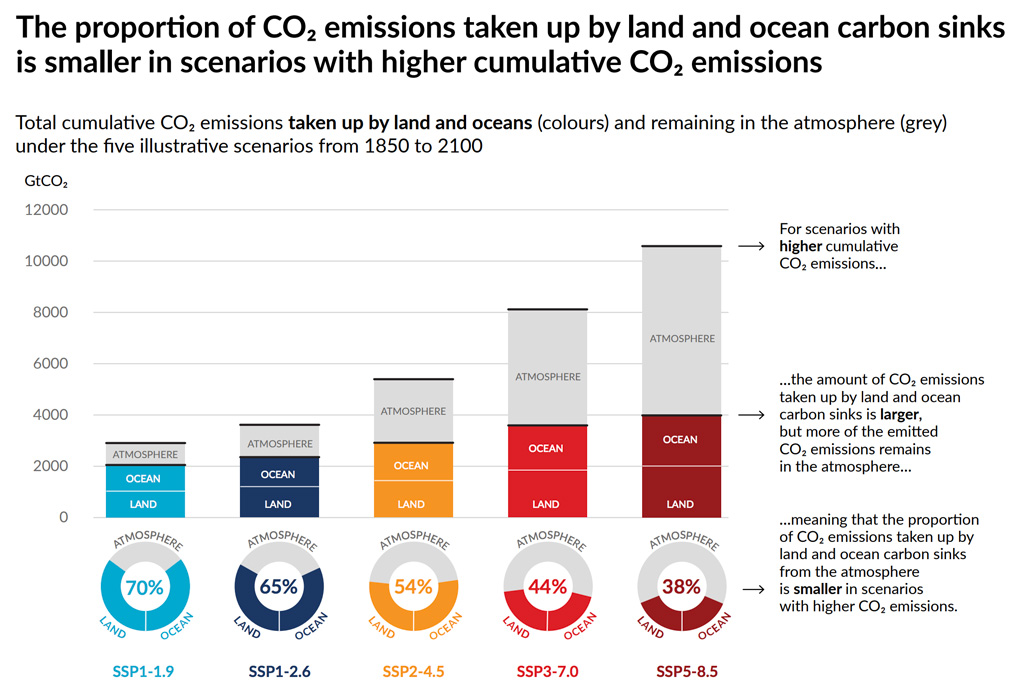
Under all scenarios studied, the ocean will continue to take up CO2 emitted to the atmosphere. The amount of CO2 absorbed by the ocean will increase with increasing emissions, but the proportion will decrease – meaning a larger portion will stay in the atmosphere. The chart below shows how CO2 emissions will be partitioned among the atmosphere, ocean and land.
Using proxy data, AR6 presents a pH record that stretches back to the Paleocene-Eocene Thermal Maximum (PETM), an abrupt warming event that resulted in the warmest climate in the past 65m years. The report states:
“The degree of acidification [during the PETM] is similar to the 0.4 pH unit decrease projected for the end of the 21st century under RCP8.5 and is estimated to have occurred at a rate about one order of magnitude slower than the current rate of ocean acidification.”
The report also examines the question of how CO2 removal will affect ocean acidification. Although it will quickly mitigate acidification of the surface ocean, slow mixing times mean that carbon will “continue to accumulate” in the deeper ocean long after atmospheric CO2 begins to decrease. Thus, the effects of acidification – at least in the deep ocean – are “irreversible” over generational timescales, even with “aggressive” CO2 removal, the authors say.
As with elsewhere in the world, extreme weather events in the ocean are becoming increasingly frequent and increasingly severe due to climate change. The most prominent of these are marine heatwaves, which have “approximately doubled in frequency” since the 1980s, the report says.
Marine heatwaves are also becoming longer and more intense. The report reads:
“There is new evidence since SROCC that the frequency of the most impactful marine heatwaves over the last few decades has increased more than 20-fold because of anthropogenic global warming.”
This is the first time that marine heatwaves have been examined in an IPCC assessment report, although they were included in both the SROCC and the SR15. By the end of the century, AR6 projects that these extreme events will become four times more frequent under SSP1-2.6, or eight times more frequent under SSP5-8.5.
How have projections of sea level rise changed since AR5?
Since 1901, global mean sea level (GMSL) has risen by about 0.20m and it is doing so at an “accelerating” rate. The report states, with high confidence, that the rate of GMSL rise in the 20th century was faster than any other century in the last three millennia and that this rate has increased since the 1960s.
The average rate of rise since the beginning of the 20th century is 1.73mm per year, the report says, but the average rate from 1971-2006 was 1.87mm per year, and from 2006-2018, it has been 3.69mm per year. Reconstructions based on tide gauges also reveal a “robust acceleration” in the rate of sea level rise (SLR) over the 20th century, it adds.
The new report projects that GMSL would rise by 0.38m, with a likely range of 0.28-0.55m, under SSP1-1.9 and 0.77m, with a range of 0.63-1.01m, under SSP5-8.5 by 2100, as compared to the baseline period of 1995-2014. These projections are “modestly higher” than those made in AR5 (pdf), the report notes, but “broadly consistent” with the projections made in the SROCC.
While the global signal of SLR is clear, at the regional level, sea level data is still dominated by shorter-term oceanic processes. However, the report notes, the human-driven signal is expected to “emerge in most regions by 2100”.
The major contributors to SLR are the thermal expansion of seawater, mass loss from glaciers and ice sheets and changes in land water storage. Since each of these is expected to continue in the coming years, the report writes:
“It is virtually certain that global mean sea level will continue to rise through 2100, because all assessed contributors to global mean sea level are likely to virtually certain to continue contributing throughout this century.”
Thermal expansion and glacial mass loss each contribute around 40% of the total change in GMSL from 1901-2018, the report says, but mass loss from ice sheets has become an increasingly important factor over the past several decades – 27% over the period 2006-18.
Ice sheet response remains one of the greatest sources of uncertainty around future SLR. As Prof Andra Garner of Rowan University told Carbon Brief for 2019’s explainer on sea level rise:
“There are a number of factors driving the uncertainty in future SLR amounts and rates, but the behaviour of the Antarctic and Greenland ice sheets in a warming climate is, perhaps, one of the largest contributors to this uncertainty. In particular, as new studies have come out suggesting the possibility of larger contributions to sea level rise from the Antarctic ice sheet than previously thought, we’ve seen the upper bound of future SLR projections climb upwards.”
AR6 assesses each component of SLR separately and then sums their contributions to get the likely total amount. The individual projections of AR6 are in line with those of AR5 and the SROCC for SLR due to thermal expansion, the Greenland ice sheet, glaciers and land water storage.
However, AR6 projects nearly twice the SLR due to Antarctic melting, resulting in a slightly higher projection of SLR for 2100 than in AR5.
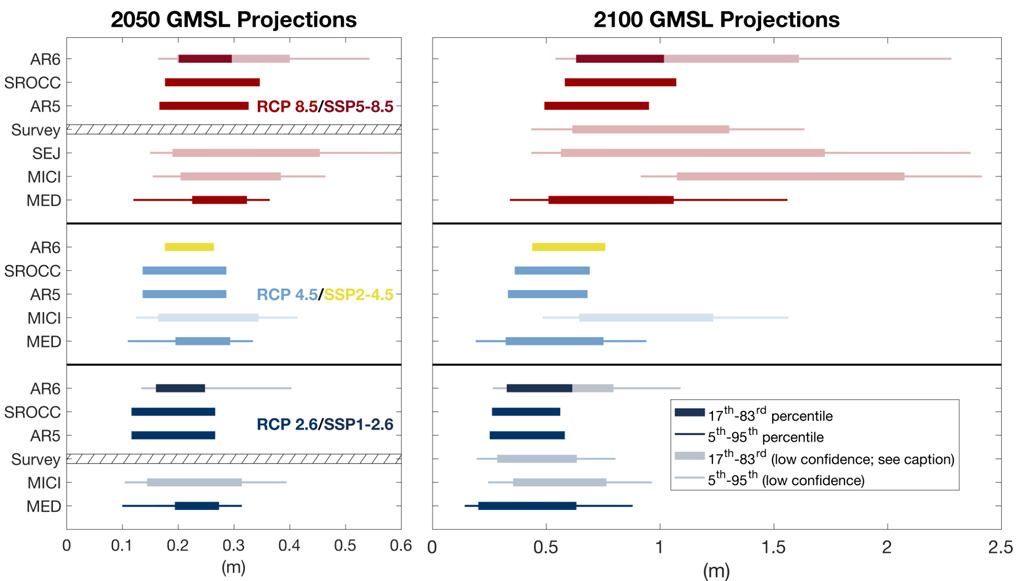
For the bulk of AR6’s projections, only processes in which there is at least medium confidence are included. This means that models which contain marine ice cliff instability (MICI) are excluded from the primary projections because it carries only low confidence.
MICI describes a process in which, with the loss of supporting ice shelves, towering ice cliffs at the face of glaciers could collapse into the ocean under their own weight, triggering further collapse. The report notes that MICI is “characterised by deep uncertainty” from “limited process understanding” and “limited availability of evaluation data”.
However, AR6 separately presents projections from models that include MICI, as well as those based on “structured expert judgment” – a “formal, calibrated method” of combining estimates from experts.
The chart below shows GMSL projections for the years 2050 and 2100 for different RCP/SSP scenarios. In addition to the projections from AR5, AR6 and the SROCC, the chart projects GMSL with the MICI included, GMSL as determined through structured expert judgment (“SEJ”) and projections as the result of a survey of 106 sea-level experts (“survey”).
Previous assessment reports have focused on projections out to the year 2100. However, as AR6 notes, “the year 2100 is now within the timeframe of some long-term infrastructure decisions”. Therefore, the new assessment also projects SLR out to 2150. “Assuming no acceleration” in ice-sheet changes beyond 2100, medium-confidence processes would result in GMSL rise of 0.46-0.99m under SSP1-2.6, up to 0.98-1.88m under SSP5-8.5.
The chart below shows projections of GMSL under five different SSP scenarios, out to 2150.
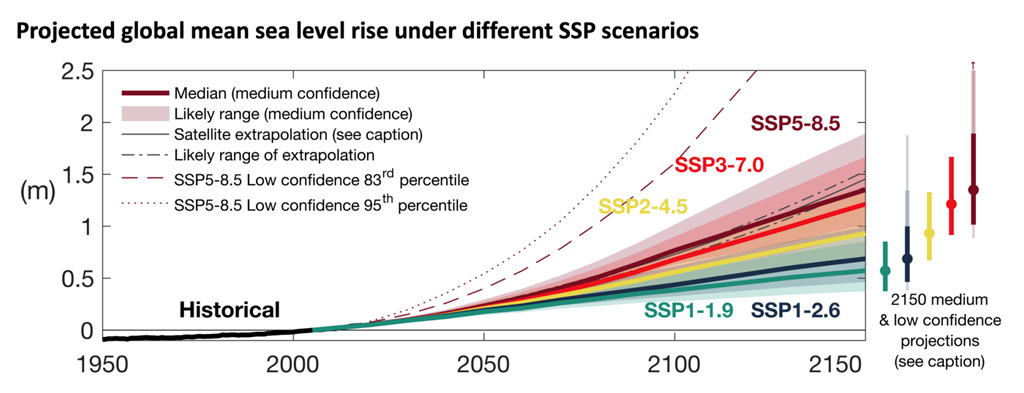
AR6 is the also first IPCC report to discuss “committed” SLR – the rise which is already locked in due to historical emissions. Even if emissions were to stop today, it is likely that sea levels would rise an additional 0.7-1.1m by 2300, the report says. Taking into account the “pledged emissions” through 2030, these numbers increase to 0.8-1.4m of committed SLR.
If emissions continue beyond 2030, sea level will continue to rise accordingly. Under the low-emissions scenario, SSP1-2.6, GMSL is projected to rise by 0.3-3.1m by 2300. In SSP5-8.5, this range increases to 1.7-6.8m, and if MICI is included, the upper bound of SLR is 16m.
Better understanding of ice-sheet dynamics is needed to better constrain these projections. The report writes:
“The eight-fold uncertainty range across projection methods under SSP5-8.5 reflects deep uncertainty in the multi-century response of ice sheets to strong climate forcing.”
There is “limited evidence” for SLR projections beyond 2300, the report notes, but two studies since AR5 have revised previous long-term estimates upwards. For a peak warming of 2C, these two studies project 2-6m of SLR over the next two millennia and a rise of 8-13m over the next 10,000 years, the report says.
The contributions of the Greenland and Antarctic ice sheets “dominate” the SLR commitment on multi-millennial timescales, the authors write. But “notably”, the report says, processes such as MICI that are responsible for “deep uncertainty” in the coming centuries do not appear to have a “substantial effect” on the magnitude of SLR on these longer timescales.
The figure below shows the expected contribution of the Antarctic ice sheet, Greenland ice sheet, glaciers and on-land water storage – as well as ocean thermal expansion – to global sea level rise, under both SSP1-2.6 and SSP5-8.5.
What does the report say about the impact humans are having?
AR6 contains a chapter dedicated to assessing the human influence on the climate system, which opens with the statement: “It is unequivocal that human influence has warmed the global climate system since pre-industrial times”.
The technical summary explains that evidence for the human influence on climate change has grown stronger in successive IPCC reports:
“The evidence for human influence on recent climate change has strengthened progressively from the IPCC second assessment report [in 1995] to the AR5 [in 2013-14] and is even stronger in this assessment, including for regional scales and for extremes.”
Speaking at a press briefing, IPCC author Prof Ed Hawkins noted that the word “unequivocal” was used in AR5 for observed warming, but for AR6 “it is used for human influence on the climate”. He added:
“So it is a statement of fact, we cannot be any more certain; it is unequivocal and indisputable that humans are warming the planet…And every government agreed to that [wording in the SPM].”
The new report also outlines the scientific advances in AR6 compared to AR5:
“Progress in our understanding of human influence is gained from longer observational datasets, improved palaeoclimate information, a stronger warming signal since AR5, and improvements in climate models, physical understanding and attribution techniques. Since AR5, the attribution to human influence has become possible across a wider range of climate variables and climatic impact-drivers. New techniques and analyses drawing on several lines of evidence have provided greater confidence in attributing changes in regional weather and climate extremes to human influence (high confidence).”
For example, AR5 found it extremely likely that human activities caused more than half of the observed increase in global mean surface temperature over 1951-2010 [pdf] and virtually certain that internal variability alone could not account for the observed global warming since 1951. In AR6, warming can be attributed to human activity since 1850-1900.
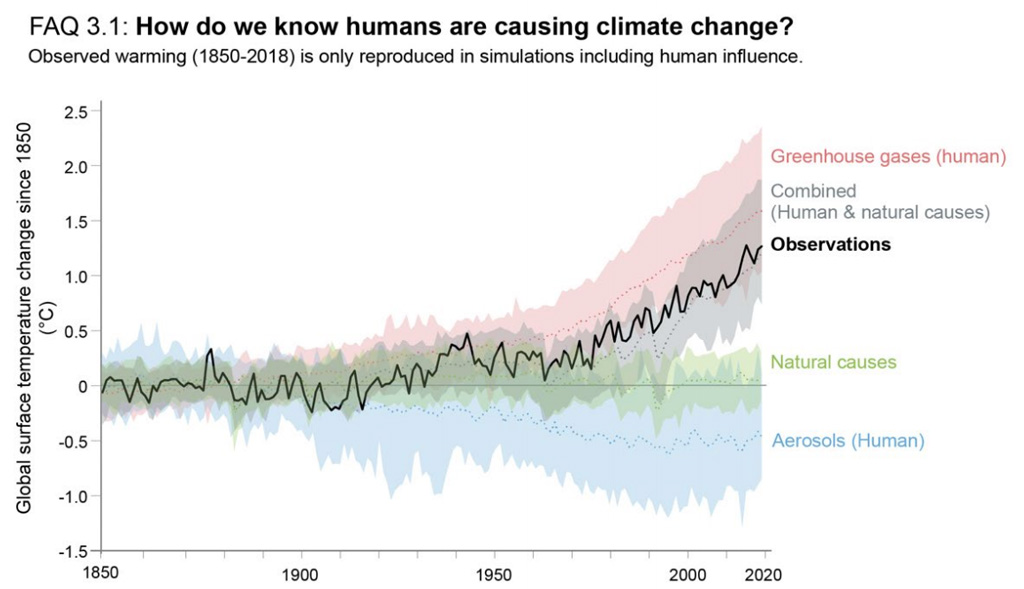
The SPM explains that between 1850-1900 and 2010-19, human activity drove 0.8-1.3C of warming, with a best estimate of 1.07C. This compares with observed warming of 1.06C over the same period – highlighting that humans are responsible for approximately 100% of global warming.
The SPM adds that greenhouse gases likely drove an increase in global surface temperature of 1.0-2.0C, which has been offset by aerosols causing a likely decrease in surface temperatures of 0.0-0.8C.
The plot below shows the warming contribution of greenhouse gases (red), the cooling influence of aerosols (blue) and the largely neutral impact of natural variability (green) to observed global temperatures (black) over 1850-2020.
The report also assesses human influence in observed changes throughout much of the climate system – including the cryosphere, atmosphere and ocean. For example, AR6 is virtually certain that human-induced greenhouse gas forcing is the main driver of the changes in hot and cold extremes on the global scale.
Similarly, it is virtually certain that the uptake of anthropogenic CO2 is the main driver of ocean acidification, while AR5 only found it very likely. This is because, since the publication of AR5, observations and simulations of surface carbon chemistry have become more robust, the report says, while “considerable improvements” have been made to differentiate between acidification caused by anthropogenic CO2 uptake, and coastal water acidification caused by eutrophication.
And SPM is virtually certain that the global upper ocean has warmed since the 1970s and finds it extremely likely that human influence is the main driver. The report adds that over 1850-2014, 58% of industrial-era heat uptake occurred in the upper layer (0-700m) of the ocean, while 21% and 22% were taken in by the intermediate and deep layers, respectively.
Meanwhile, sea level rise is made up of multiple components, and the report has different levels of confidence about the human contribution to each.
Overall, the report finds it very likely that human influence is the main driver of sea level rise since at least 1971. This is in part because, according to the report, it is very likely that human influence has been the main driver of thermal expansion – the leading contributor to global mean sea level rise – since 1970.
The report also notes that the Antarctic and Greenland ice sheets were absent in global climate models that pre-date CMIP6, adding:
“Our understanding of aspects of the global water storage contained in glaciers and ice sheets, and their contribution to sea level rise, has improved since the AR5 and SROCC – both in models and observations.”
The SPM adds that “human influence is very likely the main driver of the global retreat of glaciers since the 1990s and the decrease in Arctic sea ice area between 1979-88 and 2010-19 (about 40% in September and about 10% in March)”.
Meanwhile, the report finds that it is very likely that human influence contributed to the melting of the Greenland ice sheet. However, according to the SPM, “there is only limited evidence, with medium agreement, of human influence on the Antarctic Ice Sheet mass loss.”
And the report finds it very likely that human influence has driven the reduction in spring snow cover observed since 1950. It adds that CMIP6 models have corrected a bias from CMIP5 models in seasonal snow cover, as well as better represent the seasonality and geographical distribution of snow cover.
It also investigates the impact of humans on the biosphere. According to the report, increased levels of atmospheric CO2 have enhanced fertilisation of plant growth. However, it has low confidence that this CO2 fertilisation has also been the main driver of global greening, because land management is the dominating factor in some regions.
The SPM says it is likely that human influence has contributed to the large-scale changes in precipitation observed since the mid 20th century. It adds:
“The frequency and intensity of heavy precipitation events have increased since the 1950s over most land areas for which observational data are sufficient for trend analysis (high confidence), and human-induced climate change is likely the main driver.”
It adds, with high confidence, that while the overall performance of CMIP6 models in simulating extreme precipitation intensity and frequency is similar to that of CMIP5 models, evidence of human influence on extreme precipitation has become stronger since the AR5.
In the table below, Carbon Brief has pulled out some of the key assessments from this chapter and compared them to similar assessments made in AR5.
| Variable | Human influence AR5 | Human influence AR6 |
|---|---|---|
| Large-scale precipitation changes since 1950 | Medium confidence | Likely |
| Arctic sea ice loss | Very likely contributed since 1979. | Very likely “the main driver of Arctic sea ice loss since the late 1970s” |
| Reductions in Northern Hemisphere snow cover | Likely – since 1970. | Very likely – for spring snow cover since 1950. |
| Antarctic sea ice loss | Low confidence | Low confidence |
| Glacier retreat | Likely contributed to the retreat of glaciers since the 1960s | Very likely “the main driver of the near-universal retreat of glaciers globally since the 1990s” |
| Greenland ice sheet surface melting | Likely – since 1993 | Very likely – over the past two decades |
| Antarctic ice sheet mass loss | Low confidence | Limited evidence |
| Sea level rise | Very likely “a substantial contribution” since the 1970s | Very likely the main driver since at least 1971 |
| Deoxygenation of the upper ocean | Medium confidence | Medium confidence |
| Ocean acidification due to uptake of anthropogenic CO2 | Very likely | Virtually certain the main driver |
| Increase in ocean heat content in the upper layer | Likely made a substantial contribution | Extremely likely the main driver |
Human influence on climate change – key results from AR5 and AR6.
What does the report say about abrupt changes and ‘tipping points’?
The way that the Earth system is responding to warming is currently “proportionate to the rate of recent temperature change”, the report says, but “some aspects may respond disproportionately”.
These kinds of abrupt changes happen “substantially faster than the rate of change in recent history”, the report says. In some cases, abrupt change “occurs because the system state actually becomes unstable”. This is a “tipping point”, the authors explain, defined as “a critical threshold beyond which a system reorganises, often abruptly and/or irreversibly”.
A tipping “element” is then a component of the Earth system “that is susceptible to a tipping point”.
Understanding of abrupt climate change and irreversibility has “advanced considerably since AR5”, the report notes, “with many of the projected changes in proposed tipping elements having grown more confident”.
There is evidence of abrupt change in Earth’s history, the report says, and some “are associated with significant changes in the global climate”, such as “deglaciations” when an ice age came to an end. The authors add:
“Such events changed the planetary climate for tens to hundreds of thousands of years, but at a rate that is actually much slower than projected anthropogenic climate change over this century, even in the absence of tipping points.”
This palaeoclimate evidence “has even fuelled concerns that anthropogenic GHGs could tip the global climate into a permanent hot state”, the report says:
“However, there is no evidence of such non-linear responses at the global scale in climate projections for the next century, which indicate a near-linear dependence of global temperature on cumulative GHG emissions.”
Nonetheless, the SPM notes with high confidence that abrupt responses and tipping points in the climate system “cannot be ruled out”.
The report authors say that it is virtually certain that “irreversible, committed change is already underway for the slow-to-respond processes as they come into adjustment for past and present emissions”. It adds:
“For global climate indicators, evidence for abrupt change is limited, but deep ocean warming, acidification and sea level rise are committed to ongoing change for millennia after global surface temperatures initially stabilise and are irreversible on human time scales (very high confidence).”
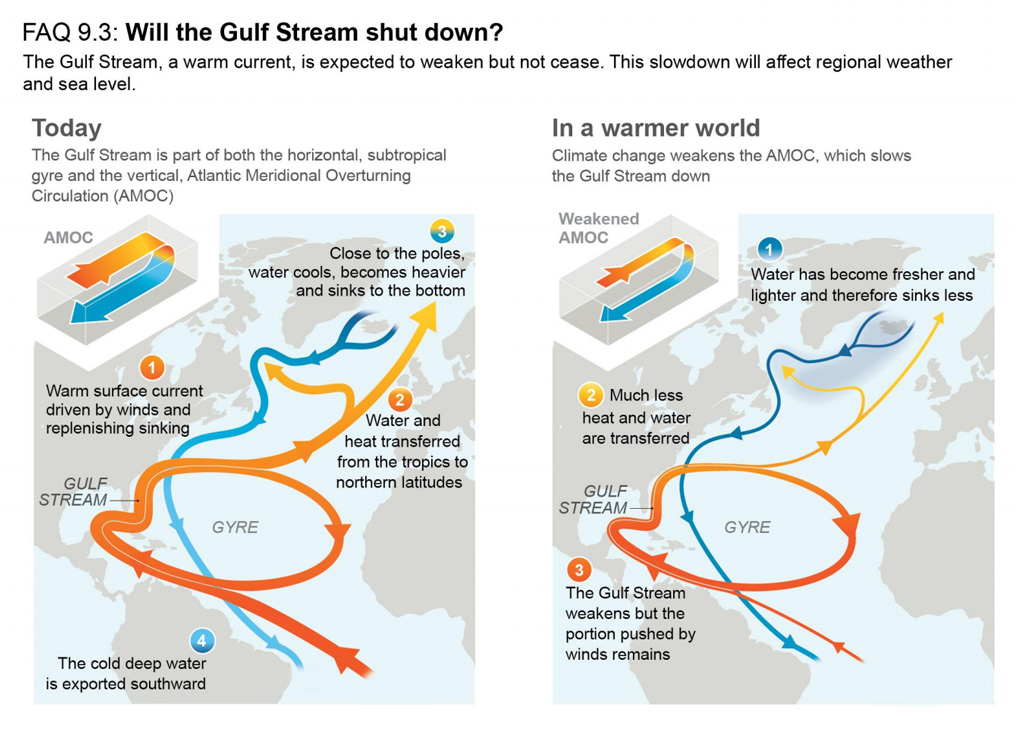
Among these slow-to-respond processes is the Atlantic Meridional Overturning Circulation (AMOC) – a system of currents in the Atlantic Ocean that brings warm water up to Europe from the tropics and beyond.
The authors conclude that AMOC “will very likely decline over the 21st century for all SSP scenarios”. And they have only medium confidence that the decline “will not involve an abrupt collapse before 2100”. (In the week before the IPCC was published, a new study suggested that “in the course of the last century, the AMOC may have evolved from relatively stable conditions to a point close to a critical transition”.)
Such a collapse “might be triggered by an unexpected meltwater influx from the Greenland ice sheet”, the report says. Should a collapse occur, “it would very likely cause abrupt shifts in the weather patterns and water cycle, such as a southward shift in the tropical rain belt, and could result in weakening of the African and Asian monsoons and strengthening of southern hemisphere monsoons”.
Another slow process is how the Earth’s ice sheets react to rising temperatures. The report finds that, at sustained warming levels between 2C and 3C, “there is limited evidence that the Greenland and West Antarctic ice sheets will be lost almost completely and irreversibly over multiple millennia”. However, the report notes – with high confidence – that “both the probability of their complete loss and the rate of mass loss increases with higher surface temperatures”. It adds:
“At sustained warming levels between 3C and 5C, near-complete loss of the Greenland ice sheet and complete loss of the West Antarctic ice sheet is projected to occur irreversibly over multiple millennia (medium confidence); with substantial parts or all of Wilkes subglacial basin in East Antarctica lost over multiple millennia (low confidence).”
The authors note that a recent review “found that some degree of irreversible loss of the West Antarctic ice sheet may have already begun”. And they add that “early-warning signals of accelerated sea level rise from Antarctica, could possibly be observed within the next few decades”.
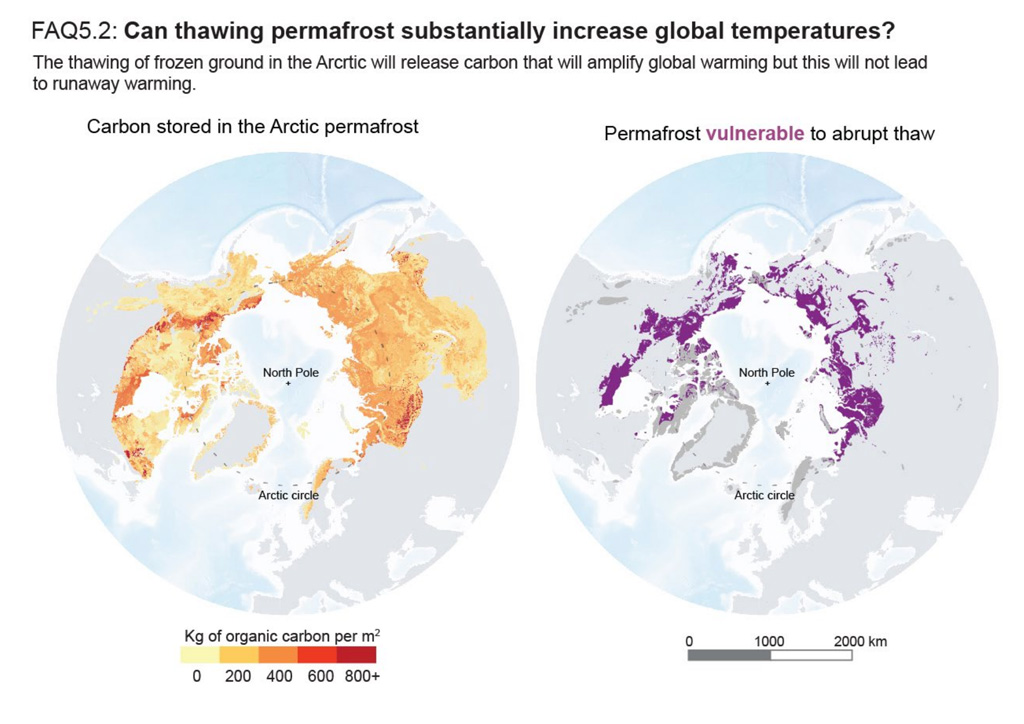
On land, the report has high confidence that thawing of permafrost – ground that has been frozen for at least two consecutive years – will lead to carbon release. But there is low confidence “in the timing, magnitude and the relative roles of CO2 versus methane as feedback processes”.
The report estimates that permafrost will release 3-41bn tonnes of carbon per degree C of global warming by 2100. However, it adds, “the incomplete representation of important processes such as abrupt thaw, combined with weak observational constraints, only allow low confidence in both the magnitude of these estimates and in how linearly proportional this feedback is to the amount of global warming”.
The report also covers methane hydrates – also known as “clathrates” – which is methane “ice” that forms at low temperatures and high pressures in continental margin marine sediments or within and beneath permafrost.
Despite rapid Arctic warming, the report concludes that substantial emissions from the “permafrost-embedded subsea clathrates is very unlikely”. Therefore, it is also very unlikely that methane emissions from clathrates “will substantially warm the climate system over the next few centuries”, the authors say.
In other potential tipping elements, the report says the “close association between the land surface and the water cycle makes the Amazon a potential hotspot for abrupt change”.
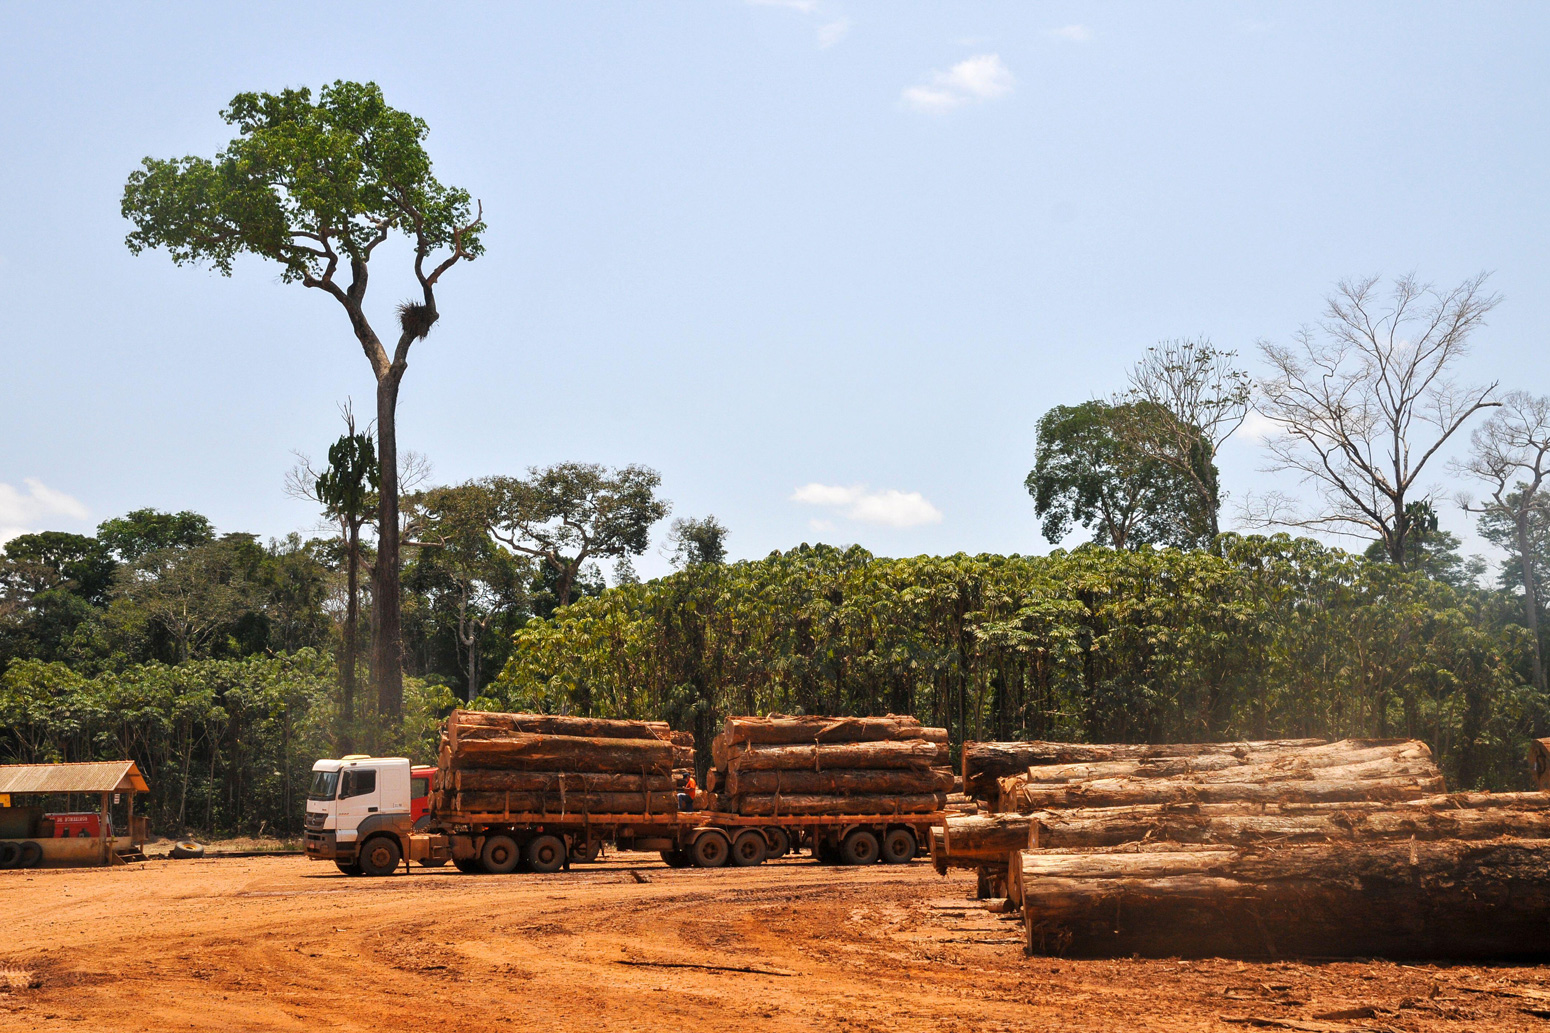
The combination of deforestation, drier conditions and increasing forest fires could push the rainforest ecosystem “past a tipping point, beyond which there is rapid land surface degradation, a sharp reduction in atmospheric moisture recycling, an increase in the fraction of precipitation that runs off, and a further shift towards a drier climate”, the report explains.
This would trigger dieback of the rainforest and a shift to permanent savannah.
However, “while there is a strong theoretical expectation that Amazon drying and deforestation can cause a rapid change in the regional water cycle”, the report notes that there is currently “limited model evidence to verify this response”. As a result, it says “there is low confidence that such a change will occur by 2100”.
Elsewhere, the potential greening of the Sahara and Sahel regions in North Africa in response to an increase in rainfall “has long been considered an amplifying mechanism that can lead to abrupt change”, the report says.
Palaeoclimatic studies “have improved our view of the timing, spatial extent and speed transitions” associated with the last Green Sahara during the African Humid Period around 11,000 to 5,000 years ago, the authors say. However, CMIP5 and CMIP6 models “cannot simulate the magnitude, nor the spatial extent, of greening and precipitation change” during the event. A result that “remains unchanged” since the IPCC’s fourth assessment report (AR4).
Given these uncertainties, the authors conclude that “there is low confidence that an abrupt change to a greener state will occur in these regions before 2100 or 2300”.
While the findings on tipping points make for sobering reading, it is important to add that “we are not doomed”, IPCC author Dr Friederike Otto from the University of Oxford told a press briefing. While scientists “cannot rule out” passing tipping points in low-warming scenarios, she added that they still “really minimise” their likelihood when compared to higher warming pathways.
The table below – Table 4.10 in the report – provides a summary of potential tipping elements and abrupt changes, including the advances from previous IPCC reports.
| Earth System Component/Tipping Element | Potential Abrupt Climate Change? | Irreversibility if forcing reversed (timescales indicated) | Projected 21st century change under continued warming | Change in Assessment |
|---|---|---|---|---|
| Global Monsoon | Yes under AMOC collapse, medium confidence | Reversible within years to decades, Medium confidence | Medium confidence in global monsoon increase; Medium confidence in Asian-African strengthening and North American weakening | More lines of evidence than AR5 |
| Tropical Forest | Yes, Low confidence | Irreversible for multidecades, Medium confidence | Medium confidence of increasing vegetation carbon storage depending on human disturbance | More confident rates than AR5 |
| Boreal Forest | Yes, Low confidence | Irreversible for multidecades, Medium confidence | Medium confidence in offsetting lower latitude dieback and poleward extension depending on human disturbance | More confident rates than AR5 |
| Permafrost Carbon | Yes, High confidence | High confidence | Virtually certain decline in frozen carbon; Low confidence in net carbon change | More confident rates than SROCC |
| Arctic Summer Sea Ice | No, high confidence | Reversible within years to decades, High confidence | Likely complete loss | More specificity than SROCC |
| Arctic Winter Sea Ice | Yes, High confidence | Reversible within years to decades, High confidence | High confidence in moderate winter declines | More specificity than SROCC |
| Antarctic Sea Ice | Yes, Low confidence | Unknown, Low confidence | Low confidence in moderate winter and summer declines | Improved CMIP6 simulation |
| Greenland Ice Sheet | No, High confidence | Irreversible for millennia, High confidence | Virtually certain mass loss under all scenarios | More lines of evidence than SROCC |
| West Antarctic Ice Sheet and Shelves | Yes, High confidence | Irreversible for decades to millennia, High confidence | Likely mass loss under all scenarios; Deep uncertainty in projections for above 3°C | Added deep uncertainty at GWL > 3°C |
| Global Ocean Heat Content | No, High confidence | Irreversible for centuries, Very high confidence | Very high confidence oceans will continue to warm | Better consistency with ECS/TCR |
| Global Sea-Level Rise | Yes, High confidence | Irreversible for centuries, Very high confidence | Very high confidence in continued rise; Deep uncertainty in projections for above 3°C | Added deep uncertainty at GWL > 3°C |
| AMOC | Yes, Medium confidence | Reversible within centuries, High confidence | Very likely decline; Medium confidence of no collapse | More lines of evidence than SROCC |
| Southern MOC | Yes, Medium confidence | Reversible within decades to centuries, Low confidence | Medium confidence in decrease in strength | More lines of evidence than SROCC |
| Ocean Acidification | Yes, High confidence | Reversible at surface; irreversible for centuries to millennia at depth, Very high confidence | Virtually certain to continue with increasing CO2; Likely polar aragonite undersaturation | More lines of evidence than SROCC |
| Ocean Deoxygenation | Yes, High confidence | Reversible at surface; irreversible for centuries to millennia at depth, Medium confidence | Medium confidence in deoxygenation rates and increased hypoxia | Improved CMIP6 simulation |
How does air pollution affect global temperatures
Observations
The AR6 report dedicates a whole chapter to “short-lived climate forcers” (SLCFs). These include aerosols – such sulphates, nitrates, dust and sea spray that are also known as “particulate matter” – as well as “chemically reactive gases,” including methane, ozone, nitrogen oxides and carbon monoxide. “In most cases,” they are also air pollutants, according to the report.
Aerosols can either cool or warm the planet by scattering or absorbing radiation, but the report finds that, overall, “anthropogenic aerosols have likely cooled global mean surface air temperature since 1850-1900 driven by the negative aerosol forcing”. It adds:
“The overall effect of surface cooling from anthropogenic aerosols is to reduce global precipitation and alter large-scale atmospheric circulation patterns (high confidence), primarily driven by the cooling effects of sulphate aerosols. In addition, there is high confidence that darkening of snow through the deposition of black carbon and other light absorbing particles enhances snow melt.”
The graphic below shows the main SLCFs, their sources, their atmospheric lifetimes and their warming or cooling effect on the planet over 1750-2019.
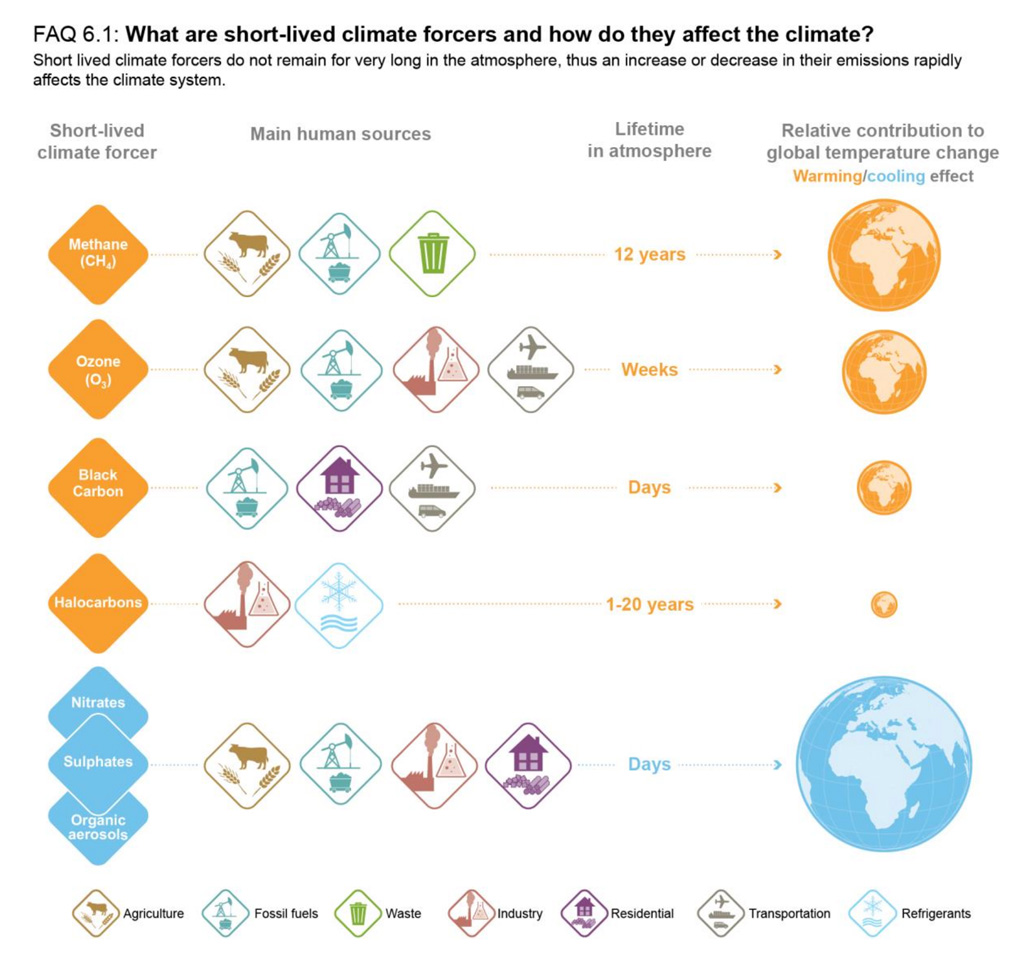
Many SLCFs have lifespans of just days or weeks – and are, therefore, “spatially heterogeneous”, according to the report – meaning that they usually form hotspots where they were emitted. It notes that the past decade has seen “strong shifts” in the geographical distribution of SLCF emissions, with “unprecedented growth of east and south Asian emissions since 2000” – making Asia “the dominant SLCF source region”.
Power plants and industry were responsible for more than 80% of global manmade sulphur dioxide (SO2) emissions in 2014, of which half came from Asia, according to the report. It notes that SO2 emissions are declining over east Asia – in part because China’s SO2 emissions decreased by 70% over 2006-17 (high confidence) – but adds that this contrasts with the trend of “continuing strong growth” in south Asian SO2 emissions.
Meanwhile, it notes that over Europe and North America, SO2 emissions have dropped by 80% since measurements began around 1980. This was due to the implementation of air quality policies, such as the acid rain programme under the clean air act in the US.
Similarly, the report finds that nitrogen dioxide (NO2) emissions have declined over North America, Europe and East Asia over the past decade (high confidence), but have continued to increase over south Asia (medium confidence) – leading to an overall increase in global nitrogen oxide and nitrogen dioxide (NOx) emissions.
The transport sector was responsible for half of all NOx emissions and one quarter of carbon monoxide (CO) emissions in 2014, the report notes. It adds that although there is high confidence that CO emissions have declined globally since the year 2000, there are still “seasonal hotspots” in tropical South America, equatorial Africa, south-east Asia and Australia linked to biomass burning.
Ammonia (NH3) emissions – mainly produced from agriculture – have remained constant or declined slightly over the US and Europe in recent decades, but have increased over Asia, the report finds. Meanwhile, hydrofluorocarbon (HFC) levels have increased over the past decade (high confidence), it adds.
Projections
The report notes that halting warming requires “reaching at least net-zero CO2 emissions” along with “strong reductions in other greenhouse gas emissions”.
The authors note that, in all emissions scenarios, it is likely that changes in SLCF emissions will drive warming between 0.06C and 0.35C warming by 2040, compared to 2019 temperatures. This is due to the competing effects of warming from methane and ozone and cooling from aerosols.
In the SPM, the authors emphasise that “strong, rapid and sustained reductions” in methane emissions would have the dual impact of limiting “the warming effect resulting from declining aerosol pollution” and improving air quality.
The warming and cooling effects of aerosols, methane, ozone and HFCs under eight SSP scenarios are shown below.
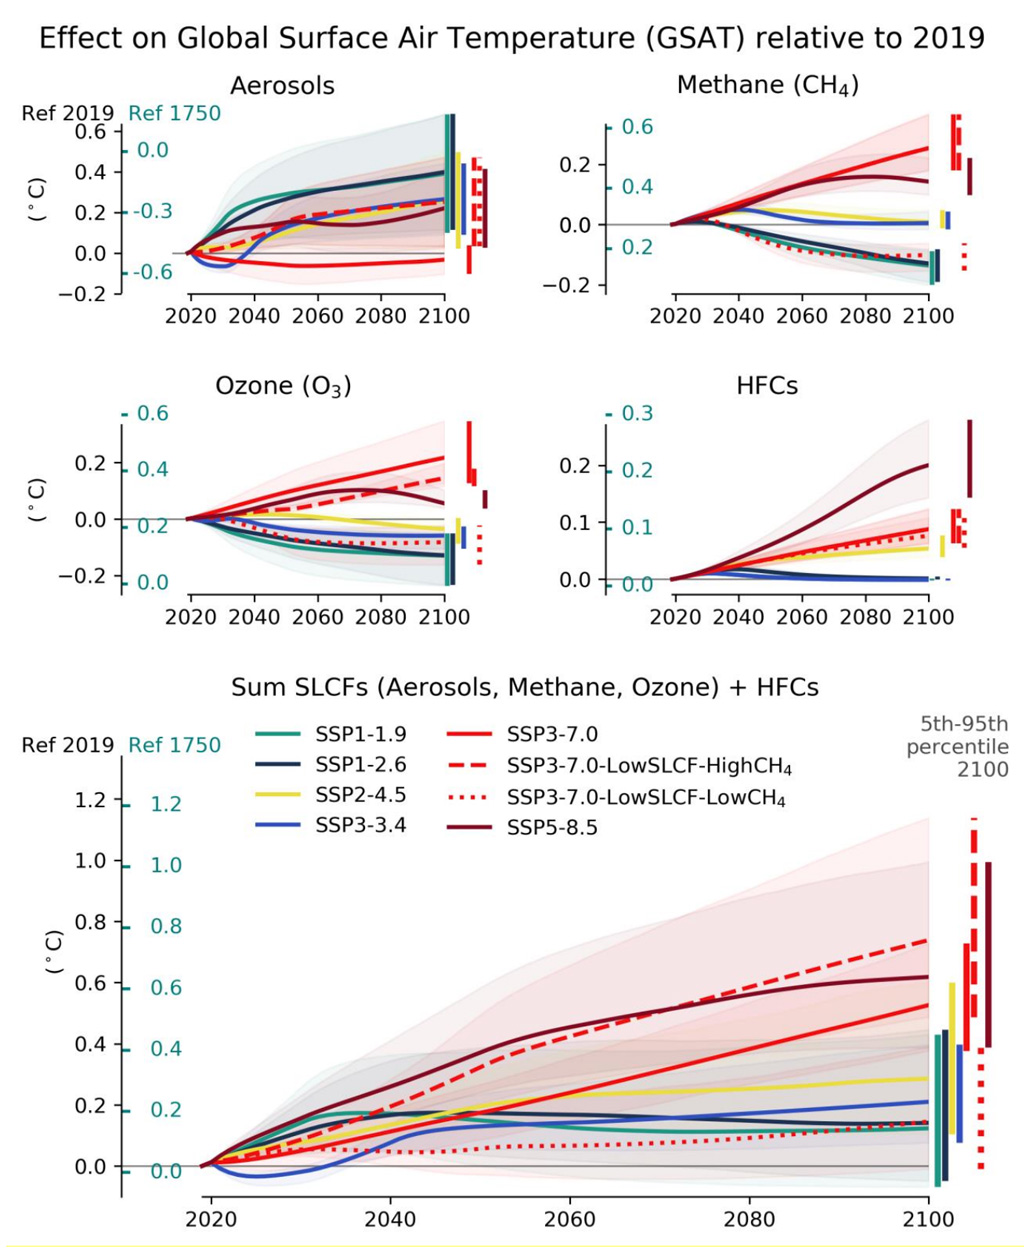
In all scenarios except SSP3-7.0, the report projects a decline in global total SLCF emissions by the year 2100. The biggest reductions are expected for SO2, the report finds, largely due to more stringent legislation in China’s power sector, declining coal use, stricter emission limits for India’s power sector and drop in the sulphur content of shipping fuel.
However, most scenarios project increasing ammonia emissions throughout the 21st century – due to a combination of increased food demand and “general lack of effective policies targeting agricultural emissions”.
The SSP5-8.5 scenario assumes limited climate mitigation and projects increasing surface ozone levels – especially over east and south Asia, the developing Pacific and much of Africa – until 2050, alongside increasing methane emissions in North America, Europe and Africa. Changing methane emissions alone will drive 0.14C warming in SSP5-8.5 by the end of the century, according to the report.
However, SSP5-8.5 also projects strong air quality policies – and a consequent decrease in particulate matter. As such, it is the highest-warming scenario throughout the century, projecting between 0.4C and 0.9C warming by the end of the century relative to 2019 temperatures, with the most rapid warming is expected in the first half of the decade, according to the report.
Meanwhile, the SSP3-7.0 scenario assumes no climate mitigation and weak, regionally varied air pollution controls. It is the only scenario that does not include the Kigali amendment to the Montreal Protocol – in which parties agree to a phaseout of HFCs.
The report projects a similar pattern of increasing ozone and NOx emissions in SSP3-7.0 as in SSP5-8.5, but also projects constant or increasing aerosol emissions. Warming in this scenario comes from the increase in ozone and methane – which becomes the dominant SLCF – rather than from a drop in aerosols. The report projects constant warming of 0.08C per decade in this scenario.
Meanwhile, SSP1-1.9 and SSP1-2.6 have the most stringent climate and air pollution controls – and assume that all SLCFs decrease overall. SLCF-related warming is “most pronounced” in these scenarios in the near term – mainly due to a reduction in sulphate aerosols – reaching a very likely range of 0.04-0.34C warming by 2040, the report says. After this peak, reductions in methane and ozone emissions lead to overall cooling in this scenario.
The report also has a section on Covid-19 – noting that the pandemic drove a 13-48% drop in NO2 emissions, a 10-33% drop in aerosols and a decrease in surface ozone of up to 4%. Overall, the report estimates a net radiative forcing of +0.05 Watts per square metre for the spring of 2020 due to changes in SLCFs as a result of lockdowns around the world.
How have climate sensitivity estimates changed since AR5?
One of the most significant advances in the AR6 WG1 report is to narrow the range for “equilibrium climate sensitivity” (ECS), allowing for more confident projections of future warming.
The ECS is a key climate metric, first estimated by the scientist Svante Arrhenius in 1896, showing how much the world is expected to warm if CO2 levels double compared to pre-industrial levels.
(The concentration of CO2 in the atmosphere today is already around 50% higher than pre-industrial levels).
Despite decades of intensive research, ECS had remained stubbornly uncertain. Since AR5, however, there has been “substantial quantitative progress”, the AR6 report says, resulting in a central estimate of 3.0C, with a likely range of 2.5-4C and a very likely range of 2-5C.
This is much narrower than the AR5 likely range of 1.5-4.5C and very likely range of 1-6C.
Crucially, AR6’s WG1 says it is virtually certain that the ECS is larger than 1.5C and that “all lines of evidence help rule out” lower values. This echoes a major study on ECS published last year.
The conclusion means that attempts to avoid dangerous warming will not be able to rely on a low climate sensitivity, which would have allowed more time to reduce emissions.
While AR6 also lowers the high end of the estimated very likely range for sensitivity, it says that “currently it is not possible to rule out ECS values above 5C”. As a result, AR6 only has medium confidence that sensitivity will be lower than 5C, compared with high confidence in relation to the lower end of the range.
Changes in estimates of ECS over time are shown in the chart below. On the far left (grey bar) is the range from the Charney report – the result of a study group convened by the US National Research Council back in 1979 to establish a “consensus” position on the “implications of increasing CO2”. The bars to the right run through each IPCC report in sequence, from the first in 1990 (“FAR”, light blue) through to the most recent AR6 range on the right (red).
In the chart, central estimates are shown with a dot, where available. The coloured bars indicate the estimated likely range for ECS and very likely ranges are marked with whiskers.
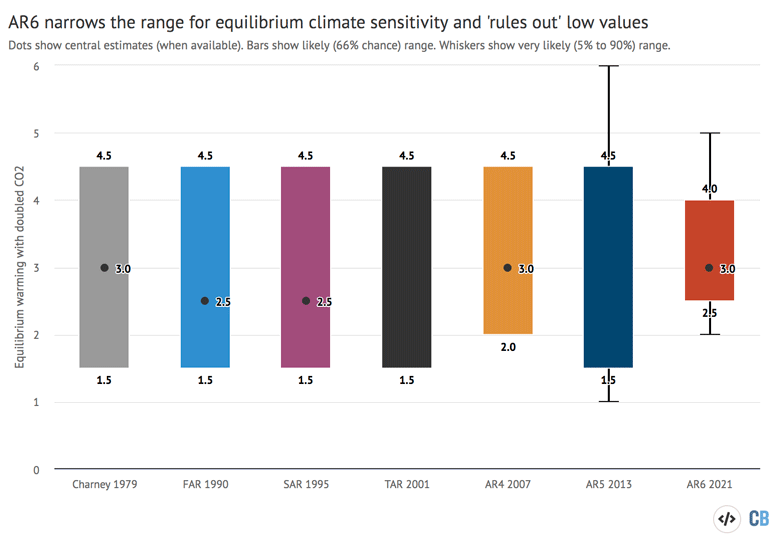
Estimates of equilibrium climate sensitivity (ECS) – the warming when CO2 doubles – published in successive IPCC assessments since the Charney report in 1979. Dots show best estimates. The coloured bars show the likely range and the very likely range is given by whiskers. Source: Charney report and IPCC assessment reports. Chart by Carbon Brief using Highcharts.
AR6 also narrows the likely range for the “transient climate response” (TCR) to 1.4-2.2C, with a best estimate of 1.8C. This compares to the AR5 likely range of 1-2.5C.
TCR is a slightly different metric that shows how much the Earth will warm after CO2 doubles, having gradually increased by 1% per year.
This gives a better indication of the warming that can be expected if and when CO2 doubles this century, whereas ECS gives the ultimate warming after CO2 concentrations have been at the same doubled level for hundreds of years.
The TCR is lower than ECS because the oceans, which absorb most of the excess warming due to the greenhouse effect, only slowly reach “equilibrium” after redistributing heat into the atmosphere.
Notably, the estimates of climate sensitivity in AR6 do not rely directly on climate models. This is in contrast to earlier estimates that were largely based on models as the “primary line of evidence”.
Instead, AR6 uses observations of historical warming, evidence of past climates (“palaeoclimate” data), physical understanding of climate processes and “emergent constraints”. AR6 explains:
“A key advance is the broad agreement across these multiple lines of evidence…AR6 differs from previous reports in not directly using climate model estimates of ECS and TCR in the assessed ranges of climate sensitivity.”
The lines of evidence supporting the ECS conclusions in AR6 are described in more detail in FAQ 7.3 (pdf) of the report, as well as in a Carbon Brief explainer on climate sensitivity, which was published in 2018.
The wide range in estimates of climate sensitivity has been driven by uncertainties in climate feedbacks. These are processes that amplify or dampen the warming caused by rising levels of CO2, known as positive or negative feedbacks, respectively.
Feedbacks include physical processes, such as the extra heat absorbed by less reflective (lower “albedo”) ocean when sea ice melts, as well as shifts in the regional structure of clouds.
The report also quantifies “biogeophysical” and “biogeochemical” feedbacks, such as shifts in vegetation patterns as a result of a changing climate, which could go on to affect albedo.
The most important is the carbon cycle feedback and this is discussed separately. (See: How much warmer will the world get in future?)
By definition, ECS is the warming after a doubling of CO2, whereas the carbon cycle feedback would further increase (or decrease) its concentration.
Overall, AR6 says it is virtually certain that the combined effects of all feedbacks is to amplify the warming due to greenhouse gas emissions and other “climate forcings”.
Underlying the narrower estimate of ECS in AR6 are a series of incremental advances in scientists’ understanding of exactly how much warming is caused by each type of forcing, as well as more significant leaps in their ability to quantify the strength of cloud feedbacks.
An FAQ in chapter seven of the report explains why this is important:
“One of the biggest challenges in climate science has been to predict how clouds will change in a warming world and whether those changes will amplify or partially offset the warming caused by increasing concentrations of greenhouse gases and other human activities. Scientists have made significant progress over the past decade and are now more confident that changes in clouds will amplify, rather than offset, global warming in the future.”
The figure below shows how clouds are expected to amplify future warming, with high confidence, as a result of higher clouds and fewer low-level clouds, despite a small negative feedback from an increase in the number of water droplets in clouds.
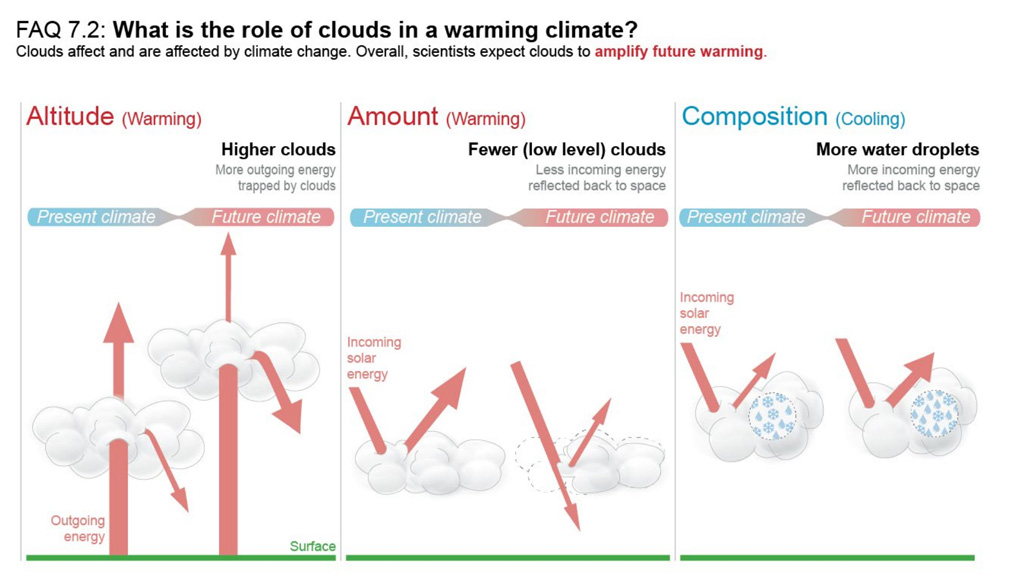
The report gives a best estimate of the cloud feedback of +0.42 Watts per metre squared per degree C (W/m2/C) with a very likely range of -0.10 to +0.94W/m2/C. This compares with the best estimate and range given in AR5 (pdf) of +0.60 (-0.20 to +2.0) W/m2/C.
The uncertainty associated with cloud feedbacks has, therefore, been cut by about 50% compared with AR5 thanks to “deepened” understanding, “better observations” and higher-resolution simulation of cloud processes, the report says.
It adds that there is “agreement” between its estimates of cloud feedback and what can be inferred directly from observations.
While there is high confidence that clouds remain the largest part of the uncertainty in feedbacks overall, AR6 says that a negative cloud feedback that dampens future warming is now thought to be very unlikely.
The findings are fully in line with a major study of cloud feedbacks, based on satellite observations and published just weeks before the AR6 report came out.
Finally, AR6 emphasises that climate feedbacks are expected to become more powerful over time, with high confidence, further amplifying warming as the Earth heats up. It explains:
“Feedback processes are expected to become more positive overall (more amplifying of global surface temperature changes) on multi-decadal timescales as the spatial pattern of surface warming evolves and global surface temperature increases.”
The potential for climate feedbacks to change, depending on the state of the Earth system and the spatial pattern of warming, has long been recognised, the report says, but “the implications for projected future warming have been investigated only recently”.
This new understanding helps to explain why estimates of ECS based on the instrumental record of warming since 1870 are too low, with high confidence, compared to the range presented in AR6.
What does the report say about the remaining carbon budget?
Carbon budgets are a simplified way to measure the additional emissions that can enter the atmosphere if the world wishes to limit global warming to levels such as 1.5C. They are based on the fact that the amount of warming that will occur can be approximated by total – that is, cumulative – CO2 emissions.
In practice, though, carbon budgets mask a lot of complexity. Due to the world being already most of the way to 1.5C of warming, the remaining budget is relatively small and, therefore, quite sensitive to the approach used. The 2018 SR15 report significantly expanded the carbon budget relative to what was reported in AR5.
This was primarily due to the use of observations rather than climate model projections to estimate historical warming; for more technical details see this Carbon Brief analysis.
The AR6 report provides updates on the remaining carbon budgets for 1.5C and 2C. It only makes “small” updates in approach when compared to SR15, the authors say:
“When adjusted for emissions since previous reports, estimates of remaining carbon budgets are therefore of similar magnitude compared to SR15, but larger compared to AR5 due to methodological improvements.”
The figure below shows the remaining carbon budgets for both a 50% chance and a 66% chance of avoiding more than 1.5C warming above pre-industrial levels from the SR15 (grey bars) and the AR6 (blue), as of 1 January 2021.
These are calculated by subtracting observed global emissions (as reported by the Global Carbon Project) over the 2018-20 period from the SR15 budget (which gives the remaining allowable budget starting in 2018) and by subtracting observed 2020 emissions from the AR6 budget (which provides a budget starting in 2020).
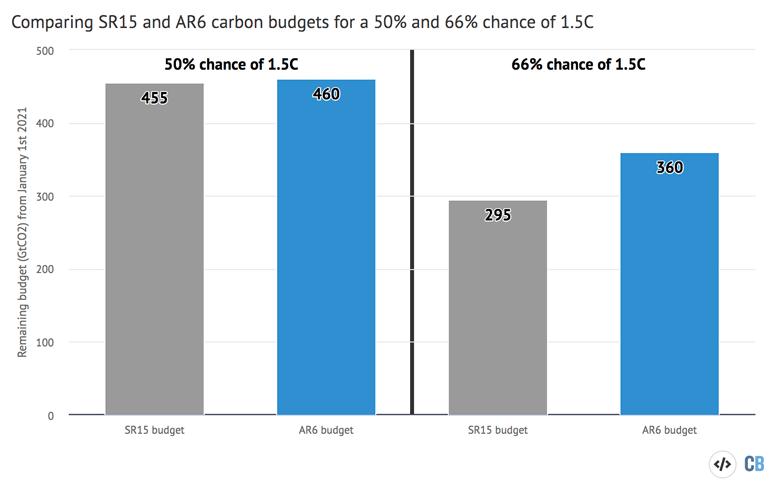
Remaining carbon budgets for a 50% and 66% chance of avoiding more than 1.5C warming as of January 1st 2021. Published budgets have been adjusted using observed CO2 emissions from the Global Carbon Project. Chart by Carbon Brief using Highcharts.
Both the SR15 and AR6 suggest that the world has around 460bn tonnes of CO2 (GtCO2) remaining in the 1.5C budget for a 50% avoidance chance. This means that the world would fully exhaust the remaining carbon budget in just 11.5 years of current (2020) emissions. It could be less than that if global emissions rebound (as expected) in 2021 – following the easing of Covid-related restrictions in much of the world – and do not decrease over the next decade. This would result in a world committed to a 1.5C temperature increase around 2031 – quite similar to the best estimate exceedance dates found in the AR6.
For a 66% chance of limiting warming to 1.5C, the AR6 reports that the world has a remaining carbon budget of 360GtCO2 – or nine years of current emissions. This is a notable increase from the SR15 carbon budget of 295GtCO2.
This increased carbon budget for a 66% avoidance chance reflects a narrower “transient climate response to cumulative carbon emissions” (TCRE) value calculated in the AR6 report (1.0C to 2.3C per 1,000bn tonnes of carbon emissions (GtC)) than in the SR15 (0.8C to 2.5C per 1,000GtC), resulting from the narrower estimate of climate sensitivity in the AR6 (see: How have climate sensitivity estimates changed since AR5?).
This TCRE revision does not affect the 50% avoidance chance as the best-estimate of TCRE is unchanged at 1.65C per 1,000GtC.
Several other factors affect “the precise value of remaining carbon budgets”, the report says, including “estimates of historical warming, future emissions from thawing permafrost, and variations in projected non-CO2 warming”.
However, it notes, “these uncertainties do not change the basic conclusion that global CO2 emissions would need to decline to at least net-zero to halt global warming”.
(Carbon Brief will shortly publish a piece covering the AR6 carbon budgets – and warming thresholds – in more detail. This will cover updates to how the budgets are calculated.)
In addition to remaining carbon budgets for 1.5C, both the SR15 and AR6 provide carbon budgets for 2C. These are shown – calculated as starting in 2021 – in the figure below.
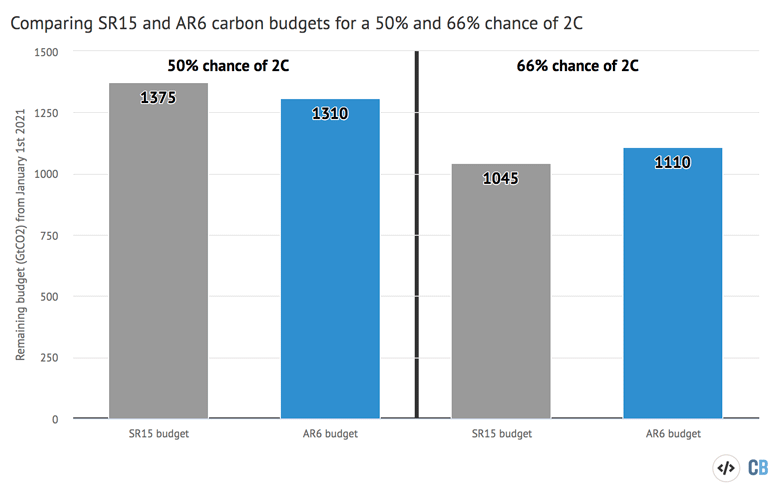
Remaining carbon budgets for a 50% and 66% chance of avoiding more than 2C warming as of January 1st 2021. Published budgets have been adjusted using observed CO2 emissions from the Global Carbon Project. Chart by Carbon Brief using Highcharts.
The AR6 slightly reduces the remaining carbon budget for a 50% chance of avoiding 2C relative to that in the SR15 – from 1,375GtCO2 (or 34 years of current emissions) to 1,310GtCO2 (or 33 years of current emissions). This suggests that the world will exhaust its remaining 2C carbon budget around 2053 if current emissions continue – quite similar to the 2052 exceedance year in the modest mitigation SSP2-4.5.
For a 66% chance of avoiding 2C warming – which is how the Paris Agreement goal of limiting warming to well-below 2C is commonly interpreted – the AR6 slightly increased the remaining carbon budget from 1,045GtCO2 (26 years of current emissions) to 1,110GtCO2 (28 years of current emissions). This reflects the updated TCRE values in the AR6 compared to the SR15 report.
What does the report say about ‘net-zero’?
Since the publication of AR5, the concept of “net-zero” – cutting the vast majority of CO2 emissions and offsetting any residual emissions through carbon removal techniques – has emerged as a guiding principle of climate mitigation.
Under the Paris Agreement of 2015, signatories committed to “balance” greenhouse gas emissions and sinks “in the second half of this century”. This wording, widely taken to mean net-zero emissions, was reinforced by the IPCC in its 2018 special report on 1.5C.
The report said that, in order to limit warming to 1.5C with “no or limited overshoot”, net global CO2 emissions need to fall by about 45% from 2010 levels by 2030 and reach “net-zero” by around 2050.
In 2019, the UK became the first major economy to set a legally binding net-zero goal. Since then, many more countries have set net-zero goals or are developing policies to do so.
The new report underlines that “limiting further climate change would require substantial and sustained reductions of GHG emissions”. It adds:
“Without net-zero CO2 emissions, and a decrease in the net non-CO2 forcing (or sufficient net negative CO2 emissions to offset any further warming from net non-CO2 forcing), the climate system will continue to warm.”
In other words, stopping warming requires reaching net-zero CO2 emissions and then cutting other GHGs as well – and/or using additional CO2 removal to offset their warming impact. As IPCC WG1 co-chair Dr Valérie Masson-Delmotte put it at the report’s launch:
“This report reaffirms that there is a near-linear relationship between the cumulative amount of emissions of CO2 in the atmosphere from human activities and the extent of observed and future warming. This is physics. This means that the only way to limit global warming is to reach net-zero CO2 emissions at the global scale. Every additional tonne of CO2 emissions adds to global warming.”
The report notes that climate model experiments since AR5 confirm that the warming after all CO2 emissions cease would be “small” and is “likely less than 0.3C in magnitude on decadal time scales”. It adds:
“Consistent with SR15, the central estimate is taken as zero for assessments of remaining carbon budgets for global warming levels of 1.5C or 2C.”
(A recent explainer by Carbon Brief unpacks why warming is likely to more or less stop once CO2 emissions reach net-zero, while net-zero GHGs would actually cause global temperatures to fall slightly.)
In a press briefing, IPCC author Prof Piers Forster from the University of Leeds described this as one of the elements of “good news” from the report. He said:
“We can be very certain that near-term reduction [in emissions] can really reduce the rates of unprecedented warming…And the other big news is that the report does really show – scientifically and robustly – that net-zero does work for stabilising or even reducing surface temperatures.”
The report notes that scenarios SSP1-1.9 and SSP1-2.6 are consistent with “CO2 emissions declining to net-zero around or after 2050, followed by varying levels of net-negative CO2 emissions”.
However, at the same briefing, IPCC author Dr Joeri Rogelj of the Grantham Institute at Imperial College London warned that the current trajectory of global emissions is above both of these. He said:
“If what is pledged currently [in terms of global emissions cuts] – on the table – would be implemented, then we would be following SSP2-4.5. But given that not everything that is pledged is already put into practice and policy, we’re rather trailing somewhere between the SSP2-4.5 and the SSP3-7.0 scenario.”
The report also notes that being on SSP1-1.9 or SSP1-2.6 rather than one of the high emissions pathways would see “discernible differences in trends of global surface temperature…within around 20 years”.
Rogelj added:
“Our activities today have changed – and continue to change – the planet we live on. And it will be our activities and choices that will determine where we end up over the next decade, and over the next centuries. And now – better than ever – we understand what needs to be done.”
A key part of reaching net-zero is being able to remove CO2 from the atmosphere at scale. This is possibly the most controversial aspect of net-zero targets.
Carbon dioxide removal (CDR) – also known as negative emissions – encompasses a range of techniques to deliberately take CO2 from the atmosphere and store it in “geological, terrestrial or ocean reservoirs, or in products”, the report says. These include “nature-based solutions” – such as reforestation, land-use change and other ecosystem-based approaches – and more industrial processes, such as direct air capture and bioenergy with carbon capture and storage (BECCS).
The report notes with high confidence that CDR “has the potential to remove CO2 from the atmosphere and durably store it in reservoirs”.
Emission pathways that limit global warming to 1.5C or 2C “typically assume the use of CDR approaches in combination with GHG emissions reductions”, the report says. It explains that CDR could be used to “compensate for residual emissions from sectors that are difficult or costly to decarbonise”.
CDR could also be “implemented at a large scale to generate global net-negative CO2 emissions”, the authors say, resulting in “anthropogenic CO2 removals exceeding anthropogenic emissions”. This could “compensate for earlier emissions as a way to meet long-term climate stabilisation goals after a temperature overshoot”.
However, the report notes with high confidence that “CDR methods have a range of side effects that can either weaken or strengthen the carbon sequestration and cooling potential of these methods and affect the achievement of sustainable development goals”.
In addition, the report says – again with high confidence – that “deployment of CDR, particularly on land, can also affect water quality and quantity, food production and biodiversity”. These effects are “often highly dependent on local context, management regime, prior land use and scale”.
CDR also potentially offers co-benefits, the authors say, particularly “with methods that seek to restore natural ecosystems or improve soil carbon sequestration”.
The authors note that “a comprehensive assessment of the ecological and socioeconomic dimensions of CDR options is left to the WG2 and WG3 reports”. But, it adds:
“If global net negative CO2 emissions were to be achieved and be sustained, the global CO2-induced surface temperature increase would be gradually reversed, but other climate changes would continue in their current direction for decades to millennia (high confidence).
“For instance, it would take several centuries to millennia for global mean sea level to reverse course even under large net-negative CO2 emissions (high confidence).”
How are weather extremes changing and what role does climate change play?
The first of the AR6 reports follows a series of deadly extreme weather events around the world that have made international news.
The middle of 2021 has seen, for example, a record-breaking “heat dome” in the Pacific north-west, wildfires in the western US and Europe, catastrophic flooding in Europe and China and rainfall-induced landslides in India.
Fittingly then, the report includes – for the first time – a dedicated chapter (pdf) on weather extremes.
(Carbon Brief has also published an in-depth article on this chapter specifically.)
Since the IPCC’s fifth assessment report (AR5) in 2013-14, “there have been important new developments and knowledge advances on changes in weather and climate extremes”, the new report says. In particular, these cover “human influence on individual extreme events, on changes in droughts, tropical cyclones and compound events, and on projections at different global warming levels”.
For example, attribution science has “emerged as a growing field of climate research with an increasing body of literature”, the AR6 report says. These studies assess whether – and to what extent – human-caused climate change and other drivers have affected the frequency and/or intensity of extreme weather events.
Observations
The chapter’s executive summary leads with the conclusion that it is an “established fact” that human-caused emissions of greenhouse gases “have led to an increased frequency and/or intensity of some weather and climate extremes”.
The term “established fact” is not one of the “likelihood statements” in the IPCC’s calibrated language around uncertainty. As the IPCC explains in its guidance, “in some cases, it may be appropriate to describe findings for which evidence and understanding are overwhelming as statements of fact without using uncertainty qualifiers”.
The AR6 report says that it is virtually certain that “the frequency and intensity of hot extremes have increased and those of cold extremes have decreased on the global scale from 1950”.
The authors are also virtually certain that human-caused greenhouse gas emissions are “the main driver”. For context, AR5 concluded (pdf) that this was very likely.
Reflecting the findings of recent attribution studies, the report notes that “some recent hot extreme events would have been extremely unlikely to occur without human influence on the climate system”.
On heavy rainfall events, the report concludes that their frequency and intensity “have likely increased at the global scale over a majority of land regions with good observational coverage”. Human influence is likely the main driver, it says.
The report suggests that observed changes in flooding and drought are less clear-cut, not least because there is more than one way to define these events and they both involve “a complex interplay of hydrology, climate and human management”.
Nonetheless, the authors conclude with medium confidence that climate change has “contributed to decreases in water availability during the dry season over a predominant fraction of the land area due to evapotranspiration increases”.
For flooding, the report says “confidence about peak flow trends over past decades on the global scale is low”, but it notes that “there are regions experiencing increases, including parts of Asia, southern South America, the north-east US, north-western Europe and the Amazon, and regions experiencing decreases, including parts of the Mediterranean, Australia, Africa and the south-western US”.
On tropical cyclones (TC) – powerful storms that develop in the warm ocean waters of the tropics – the report says “it is likely that the proportion of major TC intensities and the frequency of rapid intensification events have both increased globally over the past 40 years”.
This compares to AR5, which concluded (pdf) that “confidence remains low for long-term (centennial) changes in tropical cyclone activity, after accounting for past changes in observing capabilities”.
Projections
Looking ahead, the AR6 report finds that “regional changes in the intensity and frequency of climate extremes generally scale with global warming”. It adds:
“New evidence strengthens the conclusion from [the IPCC’s special report on 1.5C of warming] that even relatively small incremental increases in global warming (+0.5C) cause statistically significant changes in extremes on the global scale and for large regions (high confidence).”
This is particularly the case for “temperature extremes (very likely), the intensification of heavy precipitation (high confidence) including that associated with tropical cyclones (medium confidence), and the worsening of droughts in some regions (high confidence)”, the authors note.
The maps below present the IPCC’s projections for annual maximum temperature (top) and annual minimum temperature (bottom) under 1.5C (left), 2C (middle) and 4C (right) of warming.
The shading indicates the size of the projected change, with the deeper reds showing larger increases. The report notes that “large warming in hot and cold extremes will occur even at the 1.5C warming level”.
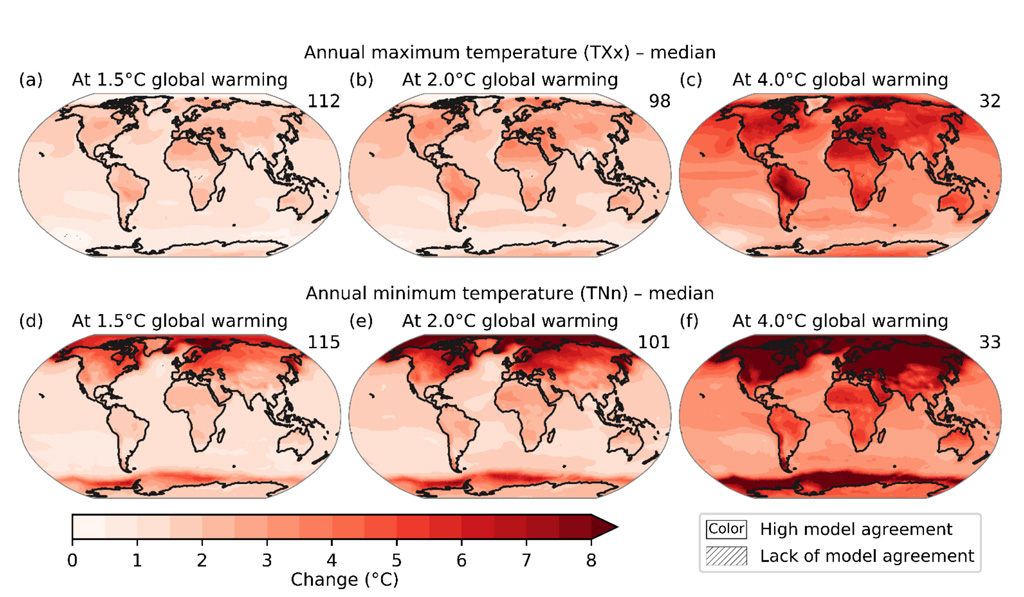
The maps illustrate that the projected warming for annual minimum temperatures is larger than for maximum temperatures and exhibits stronger warming at the poles than the equator.
In the Arctic, for example, “the rate of warming of the temperature of the coldest nights is about three times the rate of global warming”, the report says. In the mid-latitudes, “the rate of warming of hot extremes can be twice the rate of global warming”.
Rising temperatures will mean “the land area affected by increasing drought frequency and severity” will expand, the report adds, with high confidence.
For changes in heavy rainfall, the maps below present future projections of annual maximum daily precipitation under 1.5C (left), 2C (middle) and 4C (right) of warming. The shading indicates increases (green) and decreases (brown), while the hatching shows parts of the world with limited agreement across climate models.
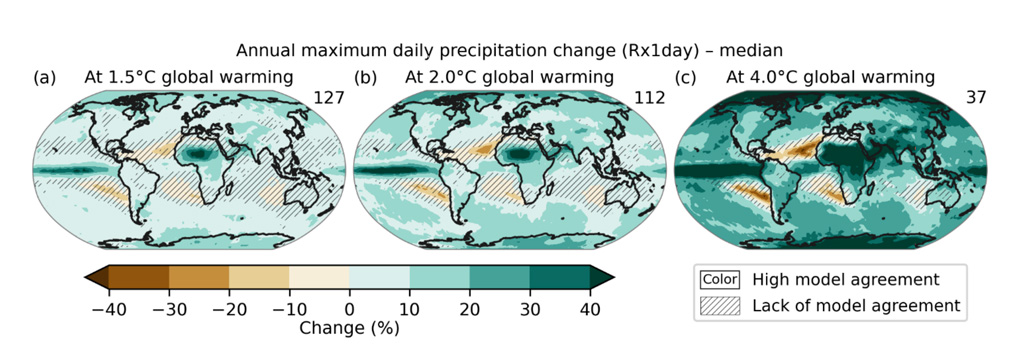
The spatial patterns across the maps “are quite similar” and show “near-linear scaling between extreme precipitation and global warming levels at regional scales”, the report says:
“Extreme precipitation nearly always increases across land areas with larger increases at higher global warming levels, except in very few regions, such as southern Europe around the Mediterranean Basin in some seasons.”
Most projected decreases in extreme rainfall are confined to “subtropical ocean areas”, the report says, and are “highly correlated to decreases in mean precipitation due to storm track shifts”.
On tropical cyclones, the report concludes – with high confidence – that “the proportion of intense TCs, average peak TC wind speeds, and peak wind speeds of the most intense TCs will increase on the global scale with increasing global warming”.
It adds, with medium confidence, that “the total global frequency of TC formation will decrease or remain unchanged with increasing global warming”.
How do climate risks vary across the world?
The AR6 report has “a far greater emphasis on regional climate change” than in previous assessments, the IPCC says (pdf). One element of this is WG1’s chapter 12, which provides climate change information for regional impact and risk assessments as “part of WG1’s contribution to solutions”.
Another is the online interactive “atlas”. This has a “regional information component” that “provides access to climate change information from the main datasets used in the report”.
The SPM the main report states:
“With further global warming, every region is projected to increasingly experience concurrent and multiple changes in climatic impact-drivers. Changes in several climatic impact-drivers would be more widespread at 2C compared to 1.5C global warming and even more widespread and/or pronounced for higher warming levels”.
The map below summarises the climate-driven impacts for different regions projected by 2041-60 with high confidence, relative to 1995-2014. Red indicates an increase, while blue indicates a decrease.
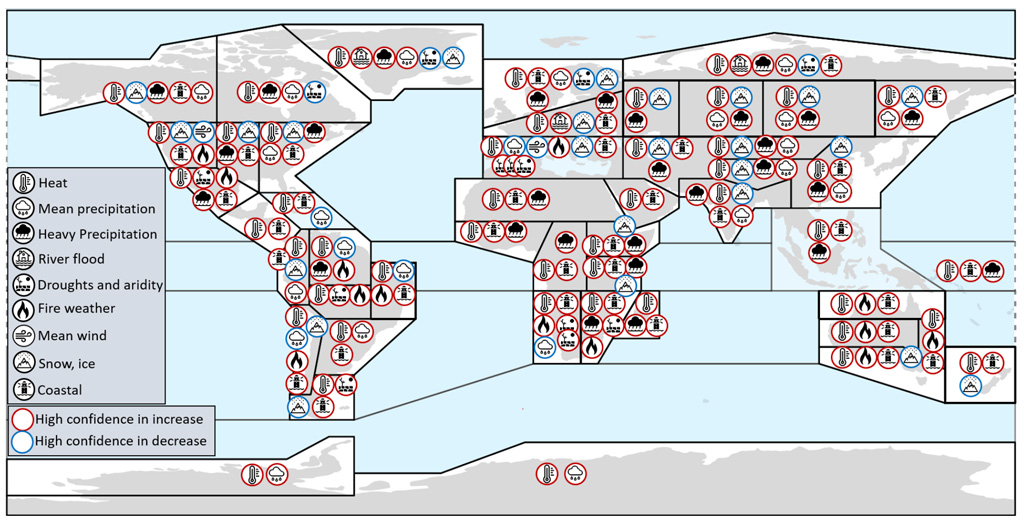
Some of the key regional impacts include:
Africa
“Mortality-related heat stress levels and deadly temperatures are very likely to become more frequent” across Africa – even given a temperature rise of only 2C, the report finds. It adds that equatorial regions, where the heat is compounded by high humidity levels, are particularly at risk.
Meanwhile, the study finds that most African regions will experience an increase in heavy rainfall that could often lead to flooding (high confidence) – although north Africa and regions in southern Africa will see an increase in fire weather, agricultural drought and ecological drought expected across much of the continent (high and medium confidence).
The SPM adds:
“Monsoon precipitation is projected to increase in the mid- to long term at global scale, particularly over south and south-east Asia, east Asia and west Africa apart from the far west Sahel (high confidence).”
Asia
“There is medium confidence that extreme precipitation, mean precipitation and river floods will increase across most Asian regions”, the report finds. It adds that, as the climate warms, river floods will increase across China – and the south Asia monsoon will intensify.
Floods and landslides are the most frequently occurring natural hazards in the eastern Himalaya – particularly caused by torrential rain during the monsoon season – according to the report. It notes that more intense precipitation and permafrost thaw will drive landslides in regions including parts of northern Taiwan and China as the climate warms.
High-mountain Asia – often known as the planet’s “third pole” for its extensive snow and ice reserves – will experience changing snowmelt patterns that could shift spring floods earlier in the season, the report finds – with medium confidence.
Meanwhile, it adds that dangerous heat stress thresholds will be crossed more often across much of Asia – especially in the south.
Australasia
The “unprecedented” fires in south-eastern Australia in 2019-20 made headlines worldwide. The report finds that they were driven by “extreme hot and dry weather in significantly drier than average conditions”, adding that fire weather – especially with respect to “extreme fire and induced pyroconvection” – will increase throughout most of Australia and much of New Zealand as the climate warms.
Rainfall will decrease across southern and eastern Australia, but will increase in central and north-east Australia, driving an increase in flooding, according to the report. Meanwhile, it notes that more frequent hot extremes will be seen across the continent, stating:
“Heat thresholds potentially affecting agriculture and health, such as 35C or 40C, are also projected to be exceeded more frequently over the 21st century in Australia under all RCPs.”
Central and South America
South America is home to the Amazon – the world’s largest rainforest. According to the report, the Amazon is one of two “drying hotspots” in South America – and will see an increase in agricultural and ecological drought and aridity over the coming century. It adds, with high confidence, that the Amazon will have among the highest “fire weather indices” in the world over the 21st century – regardless of future warming.
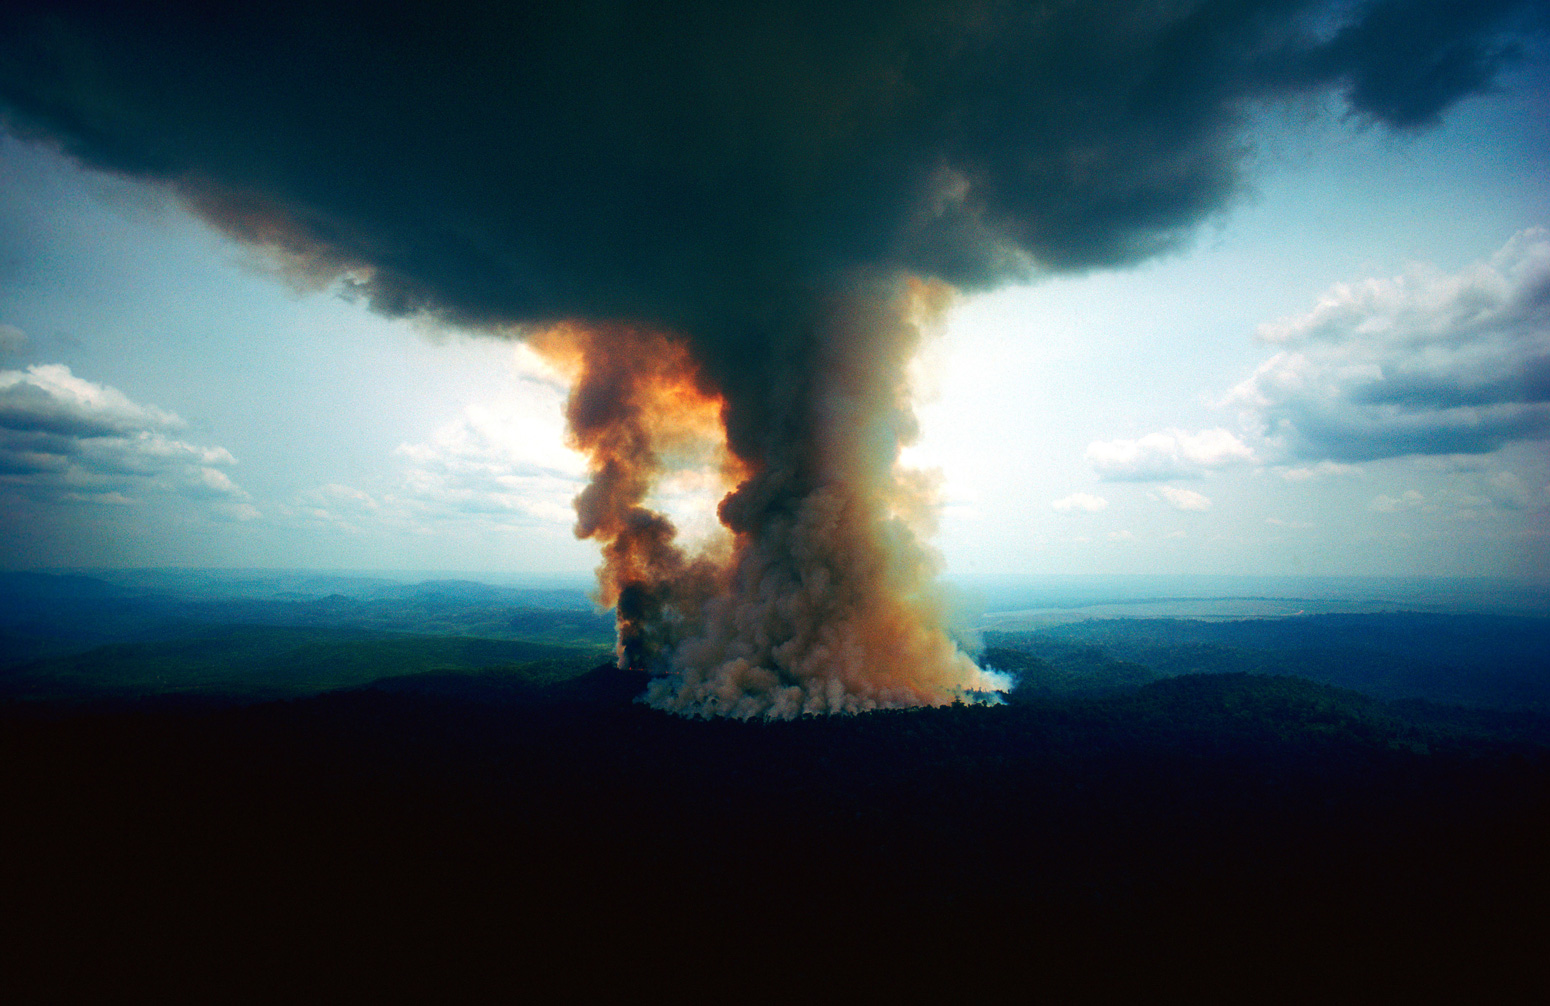
Most regions across Central and South America will experience extreme heat conditions “much more often” by 2100, according to the report.
The report notes that future rainfall changes will vary across the continent. However, it adds that melting glaciers and thawing permafrost over the Andes will cause reductions in river flow in all future warming scenarios, potentially causing “high-magnitude glacial lake outburst floods”. Furthermore, continued sea level rise will drive a rise in coastal flooding in low-lying areas.
Europe
Heat extremes will become more frequent across Europe, with an “increasing gradient” towards the south, the report finds. Meanwhile, it adds that river floods will increase in central and western Europe, while decreasing in northern, eastern and southern Europe.
In the European Alps and Scandinavia, glaciers are expected to melt further, and permafrost will continue to thaw, the report finds. It adds:
“Most of the northern Europe periglacial will disappear by the end of the century even for a lower emissions scenario.”
The authors also note that a combination of increasing temperature and decreasing precipitation will make the Mediterranean region more arid, adding that warming of 2C or more will drive an increase in agricultural, ecological and streamflow droughts in the region. Furthermore, the report predicts an increase in fire weather across the Mediterranean.
The report also highlights that compound flood events – caused by a combination of sea level rise and extreme rainfall events – will be particularly prevalent along northern European coasts as the climate warms, the report adds.
North America
The report highlights the increasing risk of forest fires in North America. Over 2000-15, climate change exposed 75% more forested area to high fuel aridity over western US, adding nine more “high fire potential” days to each year, the report notes. It adds that, if the warming exceeds 2C, the fire season across North America “expands dramatically”.
Tropical cyclones, severe wind and dust storms in North America are also “shifting toward more extreme characteristics”, the report adds. Meanwhile, it notes that Mexico and the US Gulf and Atlantic coasts will see more intense storms with higher wind speeds, more intense precipitation and storm surges.
Small islands
This section covers small island nations – particularly islands in the Caribbean sea and Pacific ocean. Sea level rise is a “major threat” to small islands, the report notes, as it can “exacerbate the impacts of other climate hazards on low-lying coastal communities and infrastructures, ecosystems, and freshwater resources”.
By 2100, a central estimate of more than 100 metres of shoreline retreat is projected for all small islands under both the RCP4.5 and RCP8.5 scenarios, according to the report. It highlights that the Carribean is particularly at risk and will see coastline retreat approaching 200 metres, relative to 2010, under both RCPs.
The report also states that tropical cyclones have “devastating impacts” on small islands due to the intense winds. It states that, as the climate warms, storms will generally become less frequent but more intense (medium confidence) – with higher sea surface temperatures driving an increase in tropical cycling intensity over the Caribbean and rising sea levels exacerbating storm surge potential. However, it adds that there is “substantial variability across small island regions given projected regional shifts in storm tracks”.
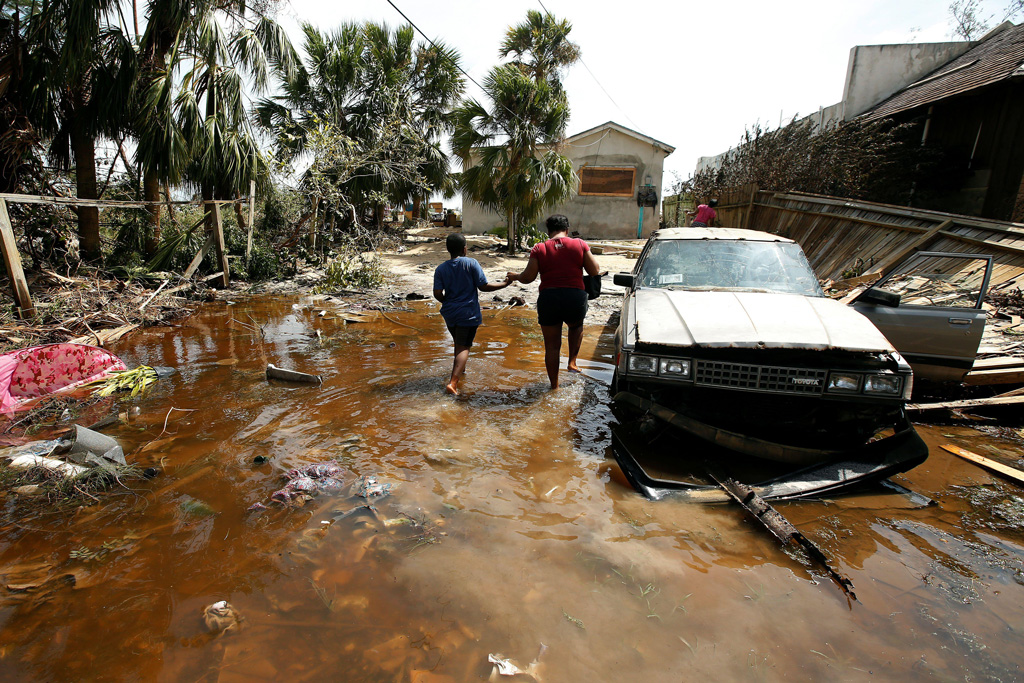
Article by Simon Evans, Josh Gabbatiss, Zeke Hausfather, Robert McSweeney, Ayesha Tandon, and Giuliana Viglione.