
Analysis: Major update to ocean-heat record could shrink 1.5C carbon budget
Zeke Hausfather
06.27.19Zeke Hausfather
27.06.2019 | 3:20pmThe UK’s Met Office recently released “HadSST4”, the largest update since 2011 to its widely used sea surface temperature (SST) record.
The new version provides more accurate estimates of SSTs in the period during and after the second world war, as well as over the past decade. It suggests that the world’s oceans have warmed by around 0.1C more than previously thought since pre-industrial times.
Carbon Brief estimates that the revisions to the Hadley SST record would reduce the global “carbon budget” remaining to limit warming to 1.5C by between 24% and 33%, depending on how the budget is calculated. A smaller budget would mean humanity has fewer carbon emissions it can still emit before committing the world to 1.5C of global warming.
At the current rate of emissions, this would mean the 1.5C budget would be used up in 6-10 years – rather than 9-13 – potentially making the target even harder to achieve.
However, a number of scientists caution not to read too much into revisions to the carbon budget. As Dr Joeri Rogelj of Imperial College London tells Carbon Brief: “A key question for decision-makers and planners is not whether these updated SSTs are giving a slightly different number from before, but whether this fundamentally changes the assessment of risk for what was called 1.5C at the time of the Paris Agreement.”
A revision to the historical temperature record does not necessarily increase the magnitude of future climate impacts, as many impact studies examine changes relative to current conditions.
Nevertheless, if the 1.5C target is interpreted as total warming since pre-industrial – rather than 0.5C warming from today – these SST revisions have a substantial impact on the remaining carbon budget.
A long-term ocean temperature record
Until the past few decades, there was little perceived need for precise, long-term temperature records. Temperature measurements were primarily intended for meteorological observations, as century-scale climate change was simply not a concern.
As technology advanced, the methods used to measure SSTs changed, from wooden buckets thrown over the side of ships to canvas buckets, engine-room intake valves, hull sensors and – most recently – to moored and drifting buoys.
Each of these changes introduced uncertainty into the temperature record, as differences in readings between different types of measurement techniques matter a lot when trying to detect less than a degree of warming in the oceans over a century.
To build a long-term temperature record of the Earth, groups of researchers around the world take different approaches to identify and remove problems due to past changes in measurement methods. The dataset most commonly used by climate researchers for SSTs is HadSST, produced by the UK’s Met Office Hadley Centre. Recently, a new version of the dataset – HadSST4 – was released, representing the first major update since HadSST3 was released in 2011.
Largest update to ocean temperatures since 2011
The new version of the dataset has introduced a number of major changes, with particularly large impacts on global SSTs during the period around and after the second world war, during the mid-1970s, and over the past two decades. These have the net effect of increasing global SSTs by around 0.1C in recent decades compared to the HadSST3 dataset.
The figure below shows the old HadSST3 (blue), the new HadSST4 (red) and the record if raw data is used with no corrections for changes in measurement methods (black dotted line). The bottom portion of the figure shows the difference between HadSST4 and HadSST3. Where the blue line is above zero, this means that HadSST4 is showing more warming than HadSST3.
(Top) Comparison of annual temperature anomalies from HadSST3 (blue), HadSST4 (red) and uncorrected records (black dashed). Uncertainties for HadSST4 are shown by the grey band. (Bottom) Difference between HadSST4 and HadSST3. Chart by Carbon Brief using Highcharts.The largest corrections to the record occur prior to 1950. Wooden buckets used in the mid-1800s cooled due to evaporation as they were hoisted up the side of ships, resulting in readings that were slightly too cool. This phenomenon became worse as wooden buckets were replaced by canvas buckets. If corrections are not made for these bucket measurements, the record would show substantially greater warming since 1850.
In the late 1930s, ships began to switch to taking water temperatures in ship “engine room intakes” (ERI). These ERI measurements tended to be warmer, both because there is no evaporative cooling involved and because engine rooms are warmer than the water the ship is passing through. The lead up to the second world war saw a large increase in ERI measurements and a corresponding drop in bucket measurements, though this partially reversed after the war was over.
Between 1950 and 1970 there was a large, but poorly documented shift toward insulated buckets and additional ERI measurements. As part of the development of HadSST4, a number of measurements during this period were reassessed and determined to come from ERIs rather than buckets. By comparing measurements from ERIs with other SST readings, HadSST4 provides improved estimates of the bias introduced by ERI measurements. These improved estimates are responsible for the bulk of the difference between HadSST3 and HadSST4 in the postwar period.
After 1970, increasing use of dedicated hull-mounted sensors helped reduce the warm bias in the record. And after 1990, buoys – which sit directly in the water and tend to have more accurate readings than ship-based measurements – began to make up a larger portion of SST measurements.
HadSST4 makes a number of adjustments over the past two decades that serve to bring ship measurements in-line with more-accurate buoy measurements, correcting an issue that Carbon Brief has previously highlighted. The HadSST4 researchers compare their new record to independent SST estimates from satellites and Argo floats, and find good agreement in the modern period.
The figure below shows the new HadSST4 record (black line) compared to a record from Argo floats (top, purple), satellite radiometer data (middle, red) and a record comprised of only more-reliable buoy measurements (bottom, blue).
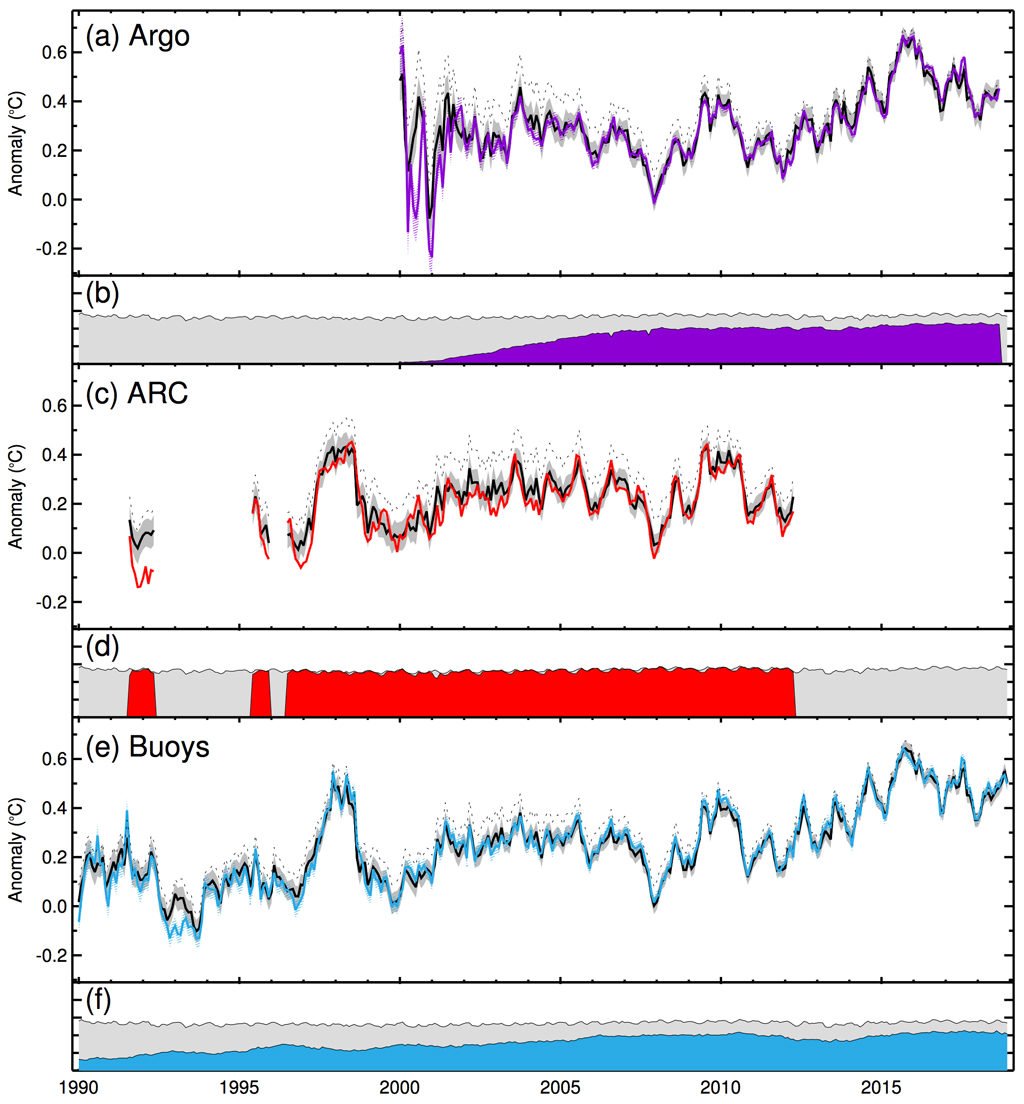
(a,c, e) Comparison HadSST4 measurements (black line) to data from Argo floats, satellite radiometer (ARC) data, and buoys, controlling for differences in spatial coverage between each series and HadSST4. (b, d, f) Percent of the oceans with HadSST4 coverage (grey) and Agro/ARC/Buoy coverage (purple, red, blue). Source: Kennedy et al. (2019).
Closer to 1.5C
The corrections introduced in HadSST4 bump up ocean temperatures by around 0.1C during the past few decades.
This is a substantial adjustment to the ocean temperature record, increasing the warming of the Earth’s oceans relative to the pre-industrial (1850-1900) period by around 13%. Because oceans make up two thirds of the Earth’s surface, this has a correspondingly large impact on global surface (oceans plus land) temperature records.
While the new HadSST4 dataset has yet to be incorporated into the overall HadCRUT surface temperature record, it is used by the Cowtan and Way temperature record. Cowtan and Way uses the same data as HadCRUT, but provides better estimates of temperatures in regions, such as the Arctic, where data is more limited. This results in a higher estimate of historical warming than the HadCRUT4 dataset.
The figure below shows warming relative to the 1850-1880 pre-industrial period in the new version of the Cowtan and Way global surface temperature dataset using HadSST4 (light blue), the prior version with HadSST3 (dark blue), and the latest version of HadCRUT using HadSST3 (yellow).
Temperature change since preindustrial (1850-1880) from HadCRUT4 (which uses HadSST3 – in yellow), Cowtan & Way with HadSST4 (light blue), Cowtan & Way with HadSST3 (dark blue). Chart by Carbon Brief using Highcharts.Incorporating HadSST4 into the Cowtan and Way dataset increases global temperatures by around 0.06C. When HadCRUT4 updates to using HadSST4, a similar bump in temperatures is likely to occur. This may seem like a small number, but it still represents around a 6% increase in estimated global warming since the pre-industrial period. Other datasets that use HadSST3, such as Berkeley Earth, should also see an upward adjustment in recent decades when they switch to HadSST4.
Revising the amount of warming since the pre-industrial period also moves the world closer to passing the aspirational 1.5C target agreed to in the Paris Agreement – and reduces the remaining carbon budget.
Shrinking the carbon budget
Last year, the Intergovernmental Panel on Climate Change (IPCC) published a special report on 1.5C (“SR15”). This provided two different estimates of the remaining carbon budget left to have at least a 66% chance of avoiding 1.5C warming this century.
One budget is based on combining surface air temperature over land with SSTs in the oceans, while the other tries to estimate surface air temperatures for the entire world. These differ as the air over the ocean is expected to warm faster than SSTs. There is still an active ongoing scientific debate about which of these two budgets is more appropriate to use for the 1.5C target.
The figure below shows the SR15 estimate for both types of 1.5C carbon budgets, taking into account emissions in 2018. The left side shows the remaining global emissions – in gigatonnes of CO2 (GtCO2) – while the right side shows revised estimates, if the additional warming from HadSST4 is taken into account.
Left-hand chart shows global carbon budgets from January 2019 for a 66% chance of avoiding 1.5C warming, updated SR15 estimates assuming 2018 CO2 emissions of 42 gigatonnes CO2 (GtCO2). Right-hand chart shows new estimates incorporating HadSST4 revisions, assuming a global average temperature increase of 0.06C since pre-industrial times based on the effect of using HadSST4 in the Cowtan and Way dataset over the past decade, and using the median transient climate response to cumulative carbon emissions (TCRE) estimate of 1.65C/1000 PgC from the IPCC special report on 1.5C. Chart by Carbon Brief using Highcharts.This analysis by Carbon Brief suggests that changes in HadSST4 will likely reduce the 1.5C carbon budget by between 24% and 33%, depending on how the budget is calculated. This means that instead of having 9-13 years of current emissions before 1.5C is exceeded, the budget only has 6-10 years left.
The HadSST4 update may effectively remove three years of emissions at the current rate from the remaining carbon budget.
This is a bit of a simplification, however, as the actual SR15 carbon budgets were based on the average of four different datasets, two of which used HadSST3 and two of which used NOAA’s ERSSTv4.
As Dr Glen Peters from CICERO in Norway tells Carbon Brief:
“All else equal, a 0.06C increase in the global average temperature would make the carbon budget to keep below 1.5C about 130bn tonnes CO2 smaller”.
However, the fact that revisions to historical temperature records reduce the remaining carbon budget is somewhat problematic; while the target itself is based on warming since pre-industrial levels, many of the impacts that scientists have estimated to occur at warming levels such as 1.5C and 2C are estimated compared to today’s conditions.
As Prof Piers Forster from the University of Leeds tells Carbon Brief:
“This change in historic temperatures can mean a big reduction in the remaining carbon budget – or no change at all. It all depends on how you interpret the Paris Agreement in terms of how 1.5C relates to the climate impacts were trying to avoid.
“Take the not-so hypothetical situation: a bunch of do-gooder climate researchers revise the temperature record and conclude we are already at 1.5C. What does your beleaguered policymaker do? Do you reinterpret the Paris Agreement as saying: ‘We need to avoid further impacts from the real and pronounced impacts we are experiencing today. We, therefore, have zero remaining carbon budget and must turn off the lights.’ Or do you say: ‘What was meant by 1.5C was really about avoiding the impacts associated with a world 0.5C warmer than today, so this is just a labelling exercise and doesn’t affect the remaining budget at all.’
“People and policymakers should rightly put impacts at the centre of our decisions. It’s about time climate scientists did the same and came up with a way of translating impacts into a standardised measure of global temperature.”
Dr Joeri Roglej shares similar concerns, telling Carbon Brief:
“A key question for decision-makers and planners is not whether these updated SSTs are giving a slightly different number from before, but whether this fundamentally changes the assessment of risk for what was called 1.5C at the time of the Paris Agreement.
We have suggested that scientists should always provide a translation to help decision-makers, because otherwise future updates run the risk of comparing apples with oranges. Policymakers for…countries that are most vulnerable and will feel the strongest impact are not obsessed by the actual number of a temperature target. They are obsessed by the climate impacts that are projected and that they try to avoid.”
These 1.5C carbon budgets are still subject to wide uncertainties in the sensitivity of the climate to additional CO2, as they target a 66% chance of avoiding 1.5C warming rather than, say, a 50% chance. Additional uncertainties arise from the trajectory of non-CO2 emissions, uncertainties in historical temperatures and in historical CO2 emissions.
Nevertheless, the upwards revision in global temperatures introduced by HadSST4 will undoubtedly make the 1.5C target more difficult to achieve, at least as long as the target remains defined relative to pre-industrial temperatures rather than current temperatures.
-
Analysis: Major update to ocean-heat record could shrink 1.5C carbon budget
-
Analysis: Major update to ocean-heat record could mean smaller 1.5C carbon budget