Explainer: How data adjustments affect global temperature records
Zeke Hausfather
07.19.17Zeke Hausfather
19.07.2017 | 1:31pmOver the past two centuries, the times of day, locations and methods of measuring temperature have all changed dramatically. For example, where once researchers lowered buckets over the side of ships to collect water for measuring, we now have a global network of automated buoys floating around the oceans measuring the water directly.
This complicates matters for scientists putting together a long-term, consistent estimate of how global temperatures are changing. Scientists must adjust the raw data to take into account all the differences in how, when and where measurements were taken.
These adjustments have long been a heated point of debate. Many climate sceptics like to argue that scientists “exaggerate” warming by lowering past temperatures and raising present ones.
Christopher Booker, a climate sceptic writing in the Sunday Telegraph in 2015, called them “the greatest scientific scandal in history”. A new report from the rightwing US thinktank, the Cato Institute, even claims that adjustments account for “nearly all the warming” in the historical record.
But analysis by Carbon Brief comparing raw global temperature records to the adjusted data finds that the truth is much more mundane: adjustments have relatively little impact on global temperatures, particularly over the past 50 years.
In fact, over the full period when measurements are available, adjustments actually have the net effect of reducing the amount of long-term warming that the world has experienced.
Raw data shows more global warming
Land and ocean temperatures are adjusted separately to correct for changes to measurement methods over time. All the original temperature readings from both land-based weather stations and ocean-going ships and buoys are publically available and can be used to create a “raw” global temperature record.
The figure below shows the global surface temperature record created from only raw temperature readings with no adjustments applied (blue line). The red line is the adjusted land and ocean temperature record produced using adjusted data from the US National Oceanic and Atmospheric Administration (NOAA), with the difference between the two in grey.
You can see that adjustments to the data have relatively little effect on global temperatures after 1950. The rate of warming between 1950 and 2016 in the adjusted data is just under 10% faster than the raw data, and only 4% faster since the start of the modern warming period in 1970.
The adjustments that have a big impact on the surface temperature record all occur before 1950. Here, past temperatures are adjusted up – significantly reducing the warming over the past century. Over the full 1880-2016 period, the adjusted data actually warms more than 20% slower than the raw data. The large adjustments before 1950 are due almost entirely to changes in the way ships measured temperatures (more on that later).
Adjustments to land temperatures
So, looking at data adjustments more closely, why and how are land-based temperature measurements adjusted?
A single weather station will likely see many changes over the decades that it is in use. Few stations remain in exactly the same place over very long periods, with most stations experiencing at least one move to a new location. Most stations have also changed the way they measure temperatures, transitioning from liquid-in-glass thermometers to electronic instruments. Stations have often changed the time of day they measure temperatures, and growing cities and urban areas can introduce artificial warming in some stations. Very local factors, such as trees growing over stations or poor station siting, can also cause problems.
To correct for differences in a temperature record caused by these changes, known as inhomogeneities, scientists employ an approach known as statistical homogenization. They compare each station to all of its nearby neighbours and look for changes that are local to one station, but not found at any others in the area. Over long periods of time, climate changes are very rarely local, so localised changes not seen at surrounding stations are most likely due to something such as a station move or instrument change.
For example, if one station is warming over the course of a decade, while all the surrounding stations are cooling, that station would be flagged as “inhomogenous” and its record would be corrected to bring it back in line with its neighbours.
Disruptions of station records associated with station moves, time of observation changes, and even urbanisation tend to only affect one station in a region at a time, and can be easily picked up by neighbour comparisons.
The figure below shows the net effect of all the adjustments to land stations to the global land temperature record. Adjustments increase the overall land temperature warming by 16% between 1880 and 2016. Most of this is concentrated in the earlier part of the temperature record. Since 1970, adjustments only increase warming by 3%.
Adjustments to land temperatures do have larger effects in some particular regions – such as in the US and Africa – but these tend to average out when looking at the global land surface record.
Global adjusted and raw land temperatures. Anomalies plotted with respect to a 1961-1990 baseline. Chart by Carbon Brief using Highcharts.Scientists have gone to great lengths to test the methods they use to adjust land stations to ensure that they are accurately detecting and correcting problems without introducing spurious warming or cooling. This includes benchmarking studies – testing their approach on data with different types of errors added to it.
They have also set up a climate reference network in the US of perfectly sited stations with high-accuracy sensors. Comparing the raw and adjusted stations to this reference network, scientists have shown that the adjustments significantly improve the accuracy of the data.
While much has been made about adjustments to individual land stations that increase warming, these are often extreme cases cherry-picked to make a point. When adjustments to all stations are considered, just as many reduce warming as increase warming, as shown in the figure below from NOAA.
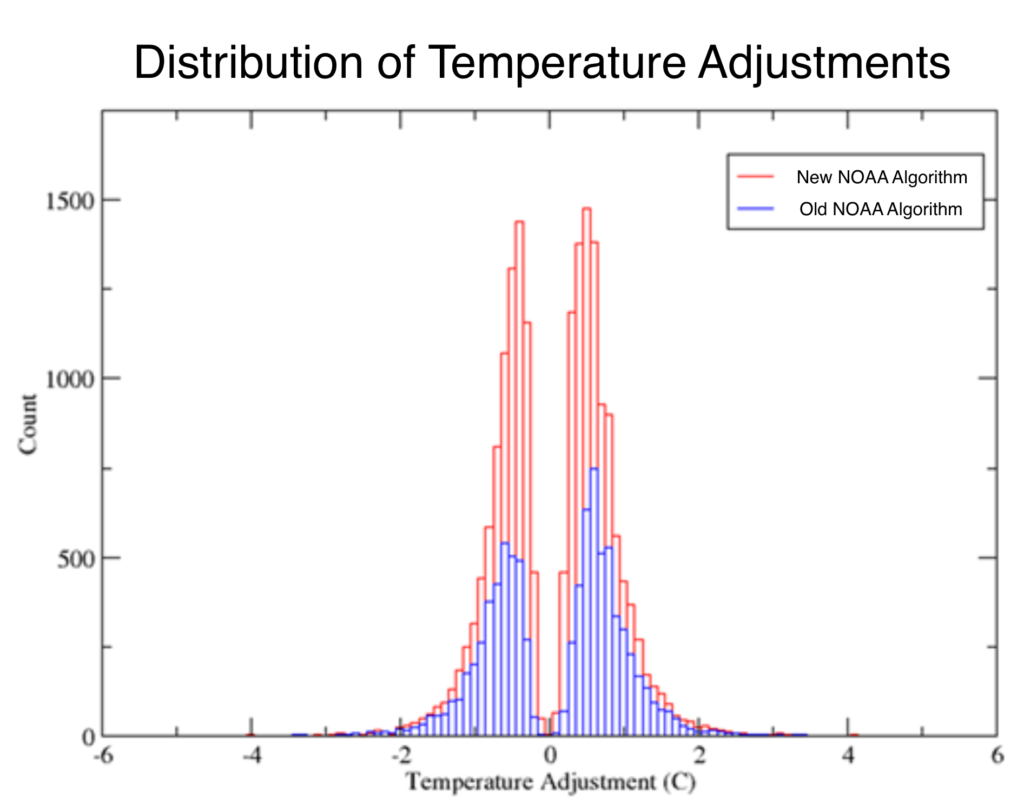
Histogram of NOAA adjustments to land temperature stations outside the US in an old (blue) and new (red) version of their adjustment algorithm. Details and additional US figures can be found on the NOAA website.
Here, roughly half of all corrections reduce the temperature and half increase it. For example, one station in Darwin, Australia has been adjusted to show more warming to account for a station move and shelter change in the 1940s. Yet the adjustment of another station – this time a station in Tokyo, Japan – has reduced the warming it shows to correct for the urban heat island effect of an expanding city.
Scientists have also worked to improve the number of land temperature records available to use by collecting and digitising old temperature records from around the world. New efforts such as the International Surface Temperature Initiative (ISTI) and the Berkeley Earth Surface Temperature Project have worked to increase the number of historical land stations available by around 500%, compared to prior station collections, and provided better coverage of the Earth’s regions, as shown in the figure below.
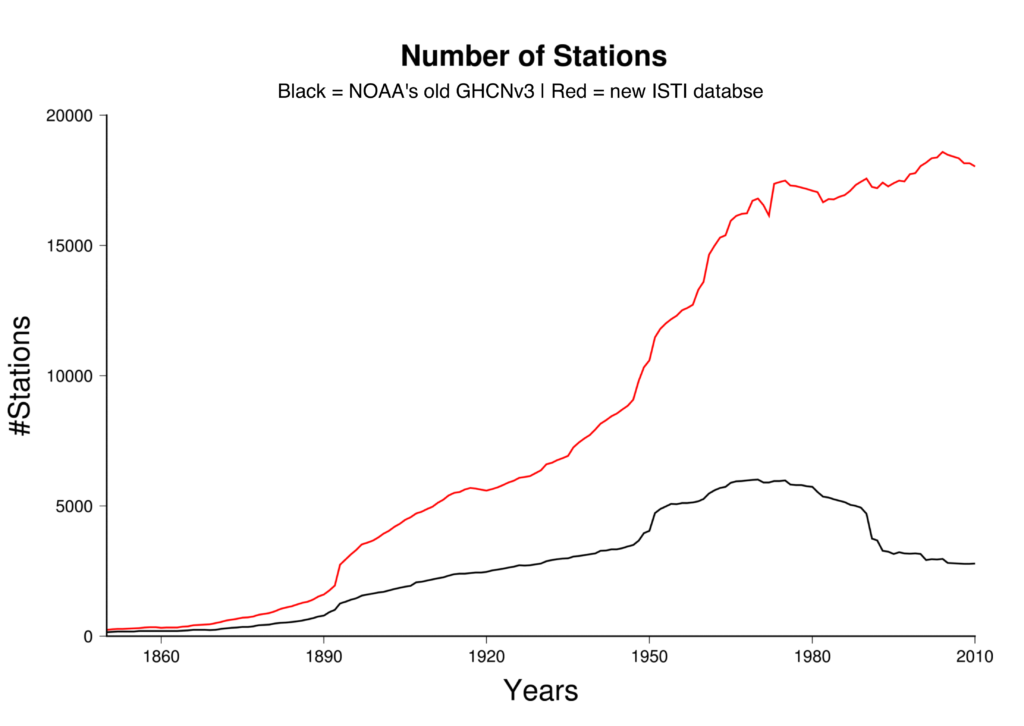
Number of land stations available in the old NOAA station collection (black) and the new International Surface Temperature Initiative collection (red). Figure from ISTI.
Adjustments to ocean temperatures
Improvements to temperature measurements aren’t limited to the land – perhaps even more significant advances have come in how temperatures are measured in our oceans.
The biggest adjustment by far is the switch from bucket-based measurements to engine intakes in ships in the 1930s and 1940s. This is the “only one that matters” globally, says Maynooth University researcher Dr Peter Thorne, who has worked with NOAA to develop their ocean temperature record.
Prior to 1940, most ships measured temperatures by throwing a bucket overboard into the water, pulling it up onto the deck by rope, and sticking a thermometer in the bucket to measure the temperature of the water. The problem is that air temperatures are often much warmer or colder than ocean temperatures. As the bucket is slowly pulled up onto deck, the water will heat up or cool down.
During the 1930s and 1940s, most ships switched to measuring temperatures through engine room intakes. Ships pull seawater in through the hull to cool the engine and the temperature of the water was taken as it came in. This resulted in temperature readings quite a bit different than when using buckets, since – despite the fact that engine rooms are warm – the water had little time to warm up or cool down before being measured.
The raw and adjusted ocean temperature records are shown in the figure below, with the bucket adjustments quite prominent at around 0.3C.
Global adjusted and raw sea surface temperatures. Anomalies plotted with respect to a 1961-1990 baseline. Chart by Carbon Brief using Highcharts.The large pre-1940 bucket adjustments greatly reduce the long-term warming in the record, resulting in 36% less warming since 1880 than in the raw temperature data. In recent years, adjustments to ocean temperatures slightly increase the rate of warming by around 4%.
Since 1990, the way that oceans temperatures are measured has changed once again. While about 90% of measurements came from ships 20 years ago, today almost 80% come from buoys floating in the ocean. These buoys are in direct contact with the water and end up reading temperatures slightly lower than measurements taken in engine room intakes.
To correct for a cool bias introduced by adding cooler buoy data to warmer ship data, temperatures are adjusted slightly upwards for recent years. This fact proved quite controversial with the publication of a paper by Tom Karl and colleagues in 2015, but has since been validated by other studies. The net effect of these buoy-related adjustments, however, is relatively small.
Records from many different groups
It’s also worth noting that adjustments to temperature records are not decided by one single group of scientists. Rather, multiple different research teams have independently created their own land and ocean temperature records.
While much of the underlying raw data is the same, each takes a somewhat different approach to adjustments and how to deal with areas of the earth with missing data. The resulting global temperature records from five different groups, along with the raw data, are shown in the figure below.
Global mean surface temperatures from NASA, NOAA, Hadley/UEA, Berkeley Earth, and Cowtan and Way. Anomalies plotted with respect to a 1961-1990 baseline. Chart by Carbon Brief using Highcharts.NOAA and NASA share the same adjustment approach for land and oceans, though NASA applies an additional correction for urban heat islands that gives stations in cities less weight. The record jointly produced by the UK Met Office Hadley Centre and the University of East Anglia’s Climatic Research Unit has its own approach of relying mostly on national meteorological offices to adjust the data within their own countries. It also has its own separate ocean temperature record with its own adjustment approach. The temperature record by researchers Cowtan and Way simply use Hadley data with a different approach for areas with missing data, such as the polar regions.
The Berkeley Earth Surface Temperature project, which was founded as an independent non-governmental group to independently assess surface temperature records, has its own unique approach for adjusting land records. This detects problems at local stations and cuts the station record at the point where the problem is found. Everything after that point is considered to be a new station. For sea surface temperatures, Berkeley uses Hadley’s adjusted ocean record.
Changing versions of temperature datasets
Those sceptical of temperature adjustments have often tried to show their impact by comparing older and newer versions of the same temperature record. The problem with this approach is that it risks conflating changes in data availability, methodology and adjustments.
However, even if different versions of prior records are compared, the changes over time between records are generally relatively small. The charts below show different versions of the NASA and Hadley/UEA datasets published over the past 30 years.
5-year running mean comparisons of past and current versions of the Hadley/UEA record (top) and NASA record (bottom). Anomalies plotted with respect to a 1961-1990 baseline. Chart by Carbon Brief using Highcharts.Subsequent updates to datasets after the mid-1990s are actually quite small and mostly reflect factors such as increased station data availability in the Arctic and recent adjustments such as the ship-buoy transition corrections. It’s only when you compare them to global temperature estimates from the 1980s that larger differences emerge.
This is because early 1980s estimates of global temperatures had much less data to work with. Scientists had yet to undertake the painstaking work of collecting and digitising much of the world’s temperature records from paper logbooks.
In 1981, for example, NASA relied on only a few hundred land stations almost entirely in the Northern Hemisphere to estimate global temperatures. Their temperature record did not even use any sea surface temperature data until the 1990s. Today, scientists have collected records from more than 32,000 land stations and more than 1.2m observations of sea surface temperatures per year.
Both the number of stations included and the methodology used by global surface temperature datasets have changed over time. Rather than compare different versions of existing datasets, it is much simpler to analyse all the raw temperature records available today and compare them to the adjusted data. This lets scientists isolate just the effect of the adjustments.
Conclusion
With almost 200 years of raw data to work with, adjustments are a necessary part of the methodology for scientists constructing long-term global temperature records. But most of these adjustments are small and they have relatively little impact on temperature records over the past few decades.
The most significant account for the shift from buckets to ship intakes in ocean temperature records in the 1930s and 1940s, and these changes are well-understood by scientists. And, contrary to popular belief, adjustments actually reduce, rather than increase, the amount of warming experienced globally over the past century.
Methodological footnote
The global, land and ocean temperature records from raw and adjusted data shown in the article were constructed as follows:
Land: Both raw and adjusted land temperature data was obtained from the Global Historical Climatological Network Monthly Version 4. Stations records were converted into anomalies with respect to a 1961-1990 baseline period. Stations with fewer than 10 years overlap with the baseline period were discarded. Stations were assigned to 5×5 latitude/longitude grid cells. Anomalies for each month were averaged within each grid cell. A global land temperature estimate was calculated by an area-weighted average of grid cells for each month.
Ocean: Raw ocean temperature records from ships and buoys are available from ICOADS. For this analysis, an unadjusted gridded product provided by HadSST3 was used. Adjusted ocean temperature records were taken from the ERSSTv4 gridded product.
Global: Global land/ocean temperatures were estimated by weighted combination of land and ocean temperature, with weights of 0.71 for ocean and 0.29 for land representing their relative portion of the Earth’s surface.
Note: The author of this article was a member of the team that produced the Berkeley Earth Surface Temperature project. In addition, he is the lead author on the paper mentioned assessing the Karl et al 2015 buoy corrections and the paper on US climate reference network comparisons.