Guest post: China’s CO2 emissions grew slower than expected in 2018
Multiple Authors
03.05.19Multiple Authors
05.03.2019 | 8:00amChina’s National Bureau of Statistics (NBS) released its annual ”statistical communique” for 2018 on 28 February, with a trove of initial data, including industrial output, energy use and other economic, social and environmental indicators.
This data implies that China’s CO2 emissions grew by 2.3% in 2018, as CO2 emissions per unit of GDP fell by 4.0% while GDP grew by 6.6%. This rise is slower than the 4.7% we projected in the Global Carbon Budget 2018, though it is within our uncertainty range of +2.0% to +7.4%

Combining this data with updated statistics for the US, the EU and India, we get a revised estimate for global fossil fuel CO2 emissions growth in 2018 of +2.0% (+1.2% to +3.3%). Again, this is slower than we projected in November, when we saw global emissions growing +2.7% (+1.8% to +3.7%).
In this guest post, we will discuss why Chinese emissions grew in 2018, their evolution over the past decade and continued data challenges that give reason for caution. We also update our estimate of worldwide fossil fuel CO2 emissions in 2018 and speculate on how they might change in 2019.
China’s emissions grow again
China’s CO2 emissions grew faster in 2018 than the 1.7% growth in 2017, according to both our original estimate and the newly revised figures. This also marks the second year that Chinese emissions grew, after a pause or slight decrease between 2014 and 2016.
The stronger growth in 2018 indicates that 2017 was not a blip. However, there are some concerns about the consistency of the new Chinese statistics, which we will come back to later. The figure below shows how China’s CO2 emissions are dominated by coal (brown line).
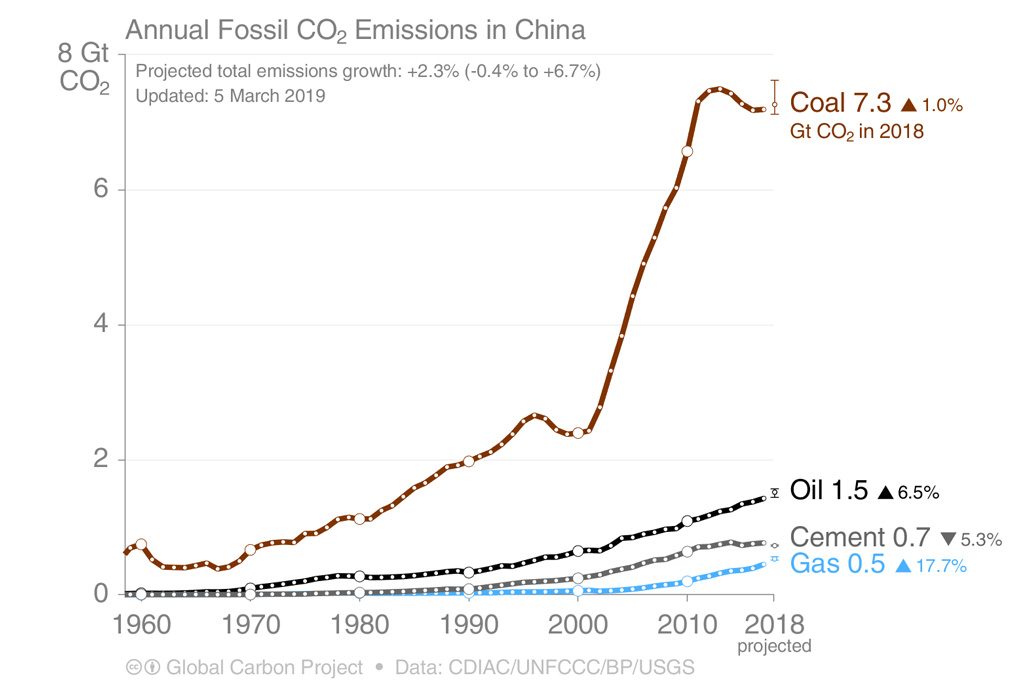
Indeed, the biggest factor in determining China’s CO2 emissions in 2018 was coal consumption, at 59% of total energy consumption and over 70% of energy-related CO2 emissions.
Like in 2017, coal consumption grew again, after having gone down from 2014 to 2016. Also like in 2017, the biggest single contribution to coal consumption growth was increased electricity production, which grew at 7.7% in 2018 and accounts for roughly half of coal consumption in China.
From 2014 to 2016, expanded renewable and nuclear power generation was able to cover slow growth in overall electricity consumption. This allowed coal-fired power generation to fall. In 2017 and 2018, however, electricity demand grew so fast that new low-carbon sources could not keep up.
Other sectors probably contributed to the growth in coal consumption, especially heavy industry. The newly released statistics do not contain direct estimates of coal consumption in each sector, but the production of some coal-intensive industrial products – notably steel – grew faster than in 2017.
Others sectors – notably cement – declined in 2018. For more on which sectors contributed the most, see a great set of analyses at Unearthed by Lauri Myllyvirta from Greenpeace, using proprietary data with a much more detailed sectoral breakdown.
China’s oil (+6.5%) and gas consumption (+17.7%) grew rapidly in 2018, continuing recent trends. Even though they account for a much smaller share of the country’s CO2 emissions than coal, this rapid growth helped push the growth in total CO2 emissions well above the rate for coal alone.
It’s the economy, stupid
The economic stimulus that started in late 2015 is likely behind much of the growth in Chinese industrial output and resulting increases in coal consumption.
However, the effects of the stimulus started to tail off through 2018. Growth in several sectors appears to have slowed suddenly towards the end of the year, which may be a factor in the reported CO2 emissions growth being so much lower than our original projection for 2018. On the other hand, inconsistencies in the statistics appears to be an even more important factor.
Let’s first look at the reasons why emissions started growing again by 2017. With China, details are often shrouded in mystery, but the underlying cause is often simple: It’s the economy, stupid. But this adage comes with Chinese characteristics, that they tend to complicate matters.
To understand recent changes in Chinese emissions, it is worth stepping back to see how the Chinese economy has operated since the mid-2000s.
China’s economy grew in leaps and bounds in the early and mid-2000s, after several economic reforms and after joining the World Trade Organization in 2001. The growth was driven by energy-intensive heavy industry and exports, with the growing energy demand mostly met by ever more coal. China’s CO2 emissions soared accordingly.
This export-driven growth almost came to a screeching halt when global demand plummeted after the global financial crisis in 2008. However, Chinese authorities maintained economic growth by loosening credit, spurring possibly the greatest infrastructure investment boom in human history. This led to continued high growth in GDP and, ultimately, CO2 emissions.
Limits to growth
But credit-driven growth has its limits. Public and corporate debt levels soared, the country eventually became riddled with empty housing developments (“ghost towns”) and underutilised infrastructure, along with growing overcapacity in all kinds of industries. Many projects seem to be more for the sake of construction activity than meeting actual demand.
By 2011-2012, GDP growth was slowing despite the government’s best efforts. Overcapacity and misallocation of capital had destroyed profitability in many industries.
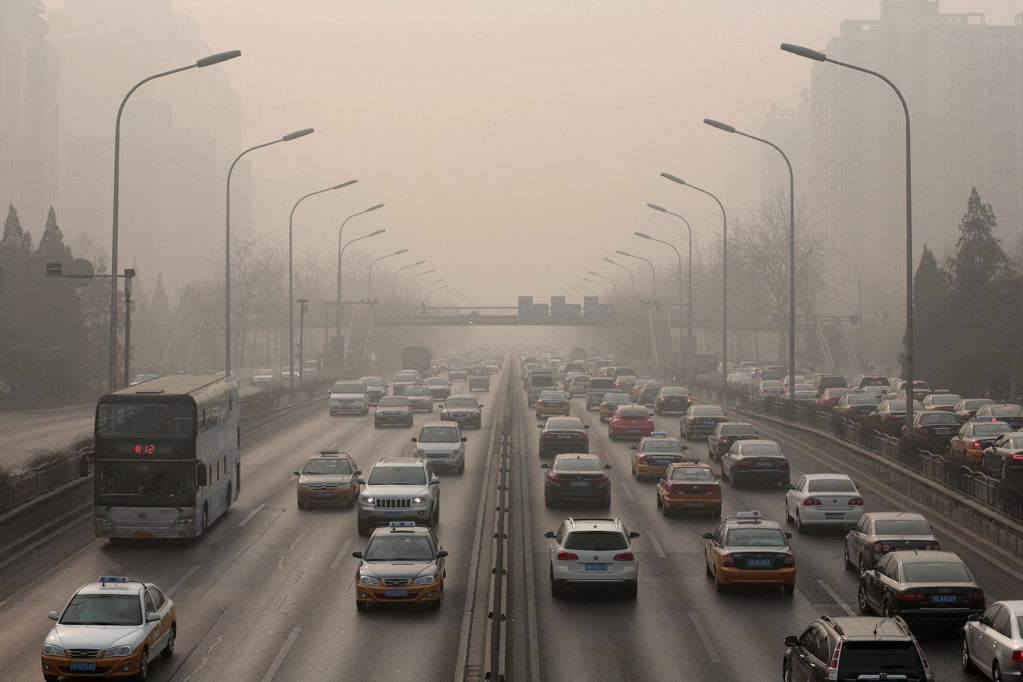
Recurring extreme air pollution episodes and water and soil contamination had created growing concerns among ordinary Chinese about the health cost of China’s growth model. It was clear to Communist Party leaders that a change of course was necessary.
President Xi Jinping and premier Li Keqiang started talking about a “new normal” and an “ecological civilisation”, emphasising lower but higher-quality growth. They drew up plans to shift the growth model from heavy industry and export to domestic consumption, innovation, advanced technologies and generally moving up in the value chain.
A flurry of measures ensued, including tightening credit, closing coal mines and capping coal production. They put stricter controls on coal power plant construction while incentivising a boom in wind and solar power.
Coal consumption subsequently fell in 2014 through to 2016 and CO2 emissions levelled off. Service industries grew apace, but many of the “old” industries employing millions of people felt serious pain. On top of that, the country suffered a stock market crash in mid-2015.
Chinese leaders appear to have got cold feet and opened the credit spigot again from late 2015 through to 2016. The investment wave this prompted may explain why coal consumption and CO2 emissions started to rebound in 2017.
In the last quarter of 2018, there was growing evidence of an economic slowdown, presumably from a combination of tighter credit and escalating trade tensions with the US.
So here we are in early 2019 with a sense of déjà vu, in the wake of another credit tightening with slumping economic growth.
Will Chinese leaders use the old script and pour credit into the system yet again, despite already high levels of corporate and local government debt? If they do, will the credit again flow to heavy industry and accelerate emissions growth further, or will they somehow manage to steer it to less energy-intensive and more long-term strategically important sectors?
It is too early to proclaim any trends yet, but new loans reached an all-time high in January 2019, suggesting that Chinese leaders might indeed be pulling the old script out the drawer for a third time. It also matters where the investment flows and at least one early count shows that approvals for new infrastructure projects also spiked in January.
Continued data challenges
Now let us return to why the reported Chinese CO2 emissions growth in the communique is so much lower than our projection in the 2018 Global Carbon Budget. The real reason is not clear, but the problem is an unexplained inconsistency in the coal statistics in the communique.
Oddities and inconsistencies in Chinese coal data have been a common theme every year since 2015 (explored here, here and here). This year, the problem is that the reported 1.0% growth in coal consumption is inexplicably much lower than the growth in coal supply.
Our initial estimates used monthly data for coal supply, because similar figures for coal demand are not publicly available. This is why we estimated a much higher 4.5% growth in coal demand in 2018.
In theory, the use of coal should equal the supply of coal, defined as domestic production plus net imports plus reductions in stocks – also called “apparent consumption”. A slight gap between these figures is normal, but more than a fraction of a percent suggests data errors or biases.
The communique reports a 4.6% growth in coal production plus imports, far above the 1% growth reported for coal consumption. This discrepancy alone explains most of the difference between our initial CO2 emissions projection (+4.7%) and the figure reported in the communique (+2.3%).
It is theoretically possible that this gap is due to a buildup of coal stocks, but inventories would have had to have grown twice as fast as they ever have in the past 20 years to absorb that difference.
Just 1% growth in coal consumption is also difficult to reconcile with electricity and industrial output data. Power generation accounts for half of all coal use in China and thermal electricity generation – 90% of which is coal-powered – grew at around 6.6% in 2018.
Steel production and a few other coal-consuming sectors also grew in 2018, so 1% growth in coal consumption seems too small to meet the reported growth in electricity generation.
There is no apparent explanation for these discrepancies. Some people have suggested that China’s statistics bureau is manipulating the data to make coal consumption growth look smoother than it actually is, although there is no direct evidence for this.
Whatever the case, the discrepancy over coal means that overall CO2 growth could be as high as around 4% – compared to 2.3% reported in the communique – even before accounting for other sources of uncertainty that we usually include in our analyses. Those factors push the uncertainty range even wider, to -0.4% to +6.7%.
The data in the communique is preliminary and the picture may change when revised statistics are published in a year’s time. Until then, it is clear that the Chinese CO2 emissions roller coaster headed uphill in 2018, but less clear how steeply.
New estimate for global CO2 emissions in 2018
Finally, a few words on our latest estimate for global emissions in 2018 in light of the new Chinese data, given the country accounts for over a quarter of global emissions.
Using monthly data for the world’s next three largest emitters the US, EU and India, as well as GDP data for all other countries, we projected last November that 2018 fossil fuel CO2 emissions globally would rise 2.7%, with an uncertainty range of +1.8% to +3.7%.
Our updated estimate is now slightly lower, at +2.0%, with a range of +1.2% to +3.3%. This is shown in the figure below, along with estimates for each of the four largest emitters.
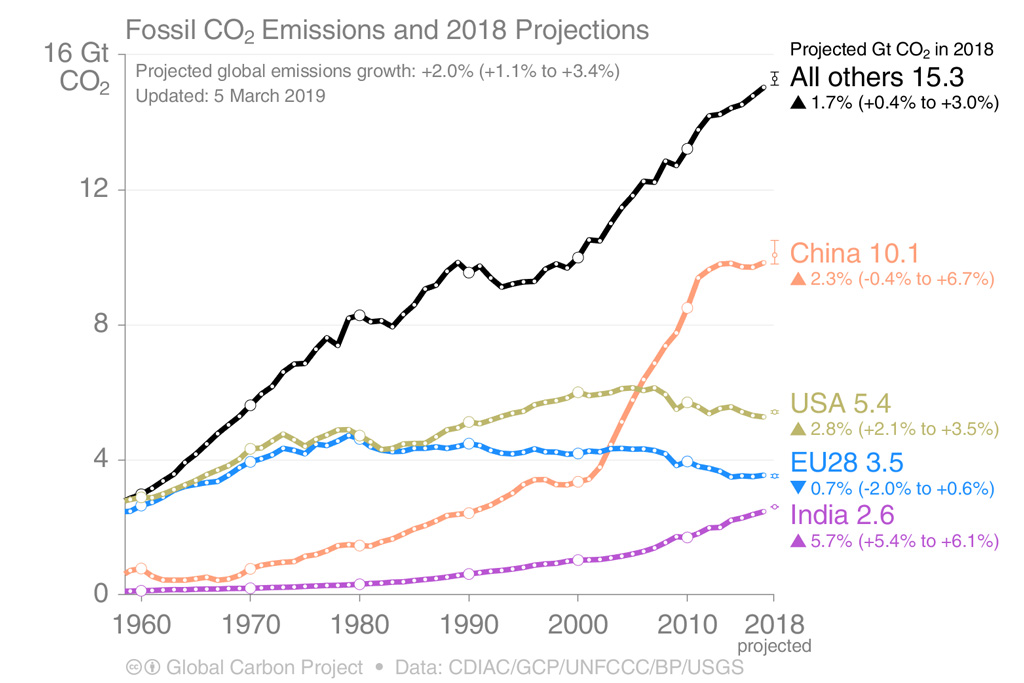
Most revisions compared to our earlier estimates are well within the expected uncertainty range for projections based on preliminary monthly data, although that for China is close to the edge.
The first full-year estimates based on annual data for 2018 will be possible in mid-June, when BP releases its Statistical Review of World Energy. Meanwhile, the following table shows how our estimates of fossil fuel CO2 emissions have changed since November.
| November 2018 estimate | March 2019 estimate | |
|---|---|---|
| Global | +2.7% (+1.8% to +3.7%) | +2.0% (+1.2% to +3.3%) |
| China | +4.7% (+2.0% to +7.4%) | +2.3% (-0.4% to +6.7%) |
| USA | +2.5% (+0.5% to +4.5%) | +2.8% (+2.1% to +3.5%) |
| EU28 | -0.7% (-2.6% to +1.3%) | -0.7% (-2.0% to +0.6%) |
| India | +6.3% (+4.3% to +8.3%) | +5.7% (+5.4% to +6.1%) |
| Other countries | +1.8% (+0.5% to +3.0%) | +1.7% (+0.4% to +3.0%) |
Where are emissions going in 2019?
Looking ahead, it is already possible to make a crude initial estimate of emissions in 2019. This suggests that global CO2 emissions could rise by about 1.6% this year.
What will CO₂ emissions do in 2019?
IMF estimates GDP to grow 3.5% in 2019, & that implies:
* 1.6% CO₂ growth if CO₂/GDP improves as in the last decade,
* <0% CO₂ grow requires CO₂/GDP to have one of largest recorded declines(figure: growth rates for GDP, CO₂, CO₂/GDP) pic.twitter.com/Y7No86ZFNz
— Glen Peters (@Peters_Glen) February 4, 2019
This would be slower than the increase in 2017 and 2018, but would nevertheless be going in the wrong direction relative to global climate goals.
This crude estimate for 2019 assumes that GDP will expand by 3.5%, as expected by the International Monetary Fund, and that the carbon intensity of the global economy will improve at the average rate seen over the past 10 years. As monthly energy data starts to become available, this estimate will be superseded with more accurate projections in the second half of the year.