
Guest post: Investigating climate change’s ‘humidity paradox’

Dr Kate Willett
12.01.20Dr Kate Willett
01.12.2020 | 11:00amWater vapour is fundamental to life on Earth. As well as being a greenhouse gas, water vapour is the basis for clouds and rain. Therefore, it sustains plants, forests and our ability to grow food.
A lack of water vapour in the air can influence the intensity and frequency of wildfires. An abundance combined with high temperatures can cause heat stress in people and animals.
It is, therefore, crucial that scientists understand how humidity – how much water vapour there is in the air – is changing, and could change, as global temperatures rise.
In a new dataset and accompanying paper, my co-authors and I explore how different aspects of humidity are changing in contrasting ways over the world’s oceans.
What is humidity?
In the simplest terms, humidity is a measure of how much water there is suspended in the air. However, it can be classified in more than one way, with climate scientists and meteorologists typically using two principal definitions.
The first is specific humidity. Also known as the “moisture content”, this is a measure of how much water vapour there is in relation to the total mass of water vapour and air combined. It is measured in grams of water vapour per kilogram of moist air.
The second is relative humidity. This is a measure – expressed as a percentage – of how “saturated” the air is. In other words, how much water vapour the air contains compared to the maximum it could contain.
Observations of humidity across the world indicate that the specific humidity – or the amount of water vapour – has increased. Yet, at the same time, the relative humidity – or saturation – over many regions has declined.
Humidity paradox
The key reasons for this apparent paradox are two-fold: the Earth is warming and warmer air can hold more water vapour.
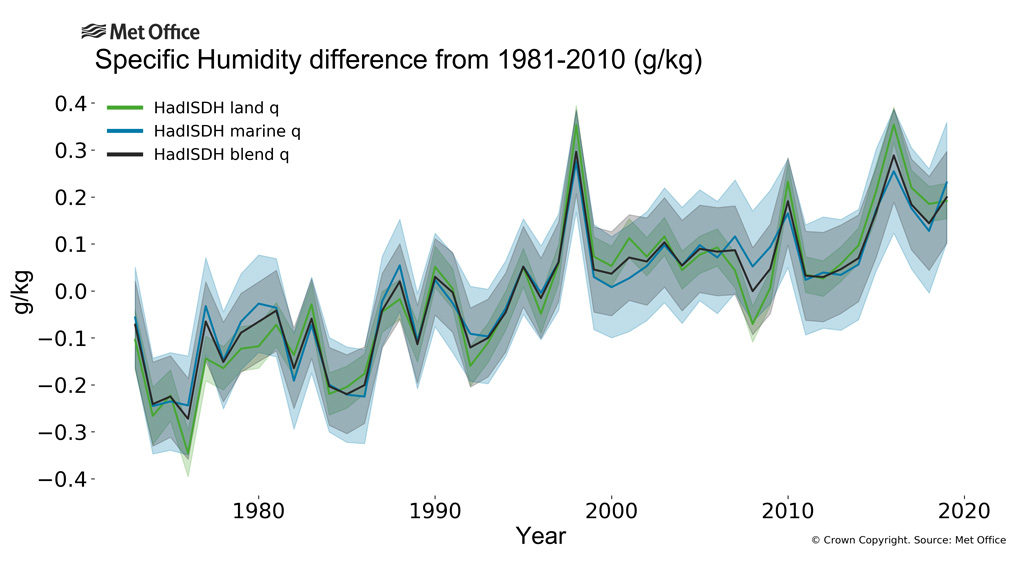
The atmosphere, land and oceans are all warming. First, this means that more water is being evaporated from the Earth’s surface. Second, more water can – and is – being held in the air as a gas. As the chart below shows, the increase in specific humidity is occurring over both the land (green line) and the oceans (blue).
According to the Clausius-Clapeyron equation, the air can generally hold around 7% more moisture for every 1C of temperature rise. Therefore, for relative humidity to stay the same under 1C of warming, the moisture content in the air also needs to increase by 7%.
In theory, if there are no limiting factors, then this is the rate of increase we would expect to see. However, the real world does have limiting factors – and so relative humidity is decreasing.
The Earth’s land surface has been warming faster than the oceans over the past few decades. But, while the oceans contain an inexhaustible supply of water to be evaporated, the same is not the case for land.
In fact, we know that most of the water vapour over land actually originates from evaporation over oceans. This moist air is moved around the globe thanks to the atmospheric circulation and some then flows over land.
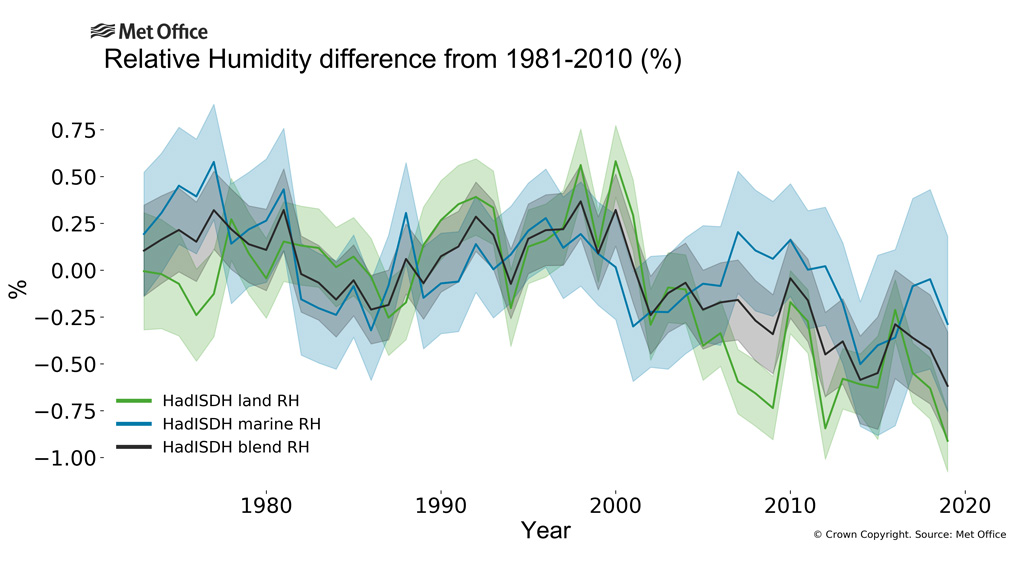
The slower warming of the oceans means that there has not been enough moisture evaporated into – and then held in – the air above the oceans to keep pace with the rising temperatures over land. This means that the air is not as saturated as it was and – as the chart below shows – relative humidity has decreased.
Relative humidity is not decreasing everywhere
While average relative humidity has declined across the world, there are some areas – such as India and some high-latitude regions – where it appears to be increasing.
It is also worth noting that there may also be other things going on that have led to regional changes in relative humidity.
First, heat is moved around the globe by atmospheric winds and ocean currents, with changes in their pattern and strength in turn affecting the atmospheric humidity levels. Second, we know that the increase in carbon dioxide (CO2) in the atmosphere, as well as changes in temperature and moisture, affect how much moisture plants release.
And, third, there have been major changes to land use over time with deforestation, urbanisation and a move to intensive and irrigated agriculture, which all affect local moisture levels. For example, research shows that the water added during irrigation can contribute to heat stress in India, even though it reduces the temperature locally.
What about ocean humidity?
Focusing on the world’s oceans, observations indicate that – as expected – specific humidity has increased in the air over oceans. This has been shown in a new global dataset that my colleagues and I have recently published in the journal Earth System Science Data.
Interestingly, this new dataset shows that relative humidity has actually decreased over many regions of the oceans. This is enough to make the global ocean average relative humidity decrease.
This decrease is difficult to explain given our current physical understanding of humidity and evaporation. For example, the expectation from climate models is that ocean relative humidity should remain fairly constant or increase slightly.
However, we also know that there are data quality issues with observations of relative humidity over the oceans, so the uncertainty around this declining trend is large. So does the data reflect what is really happening?
In some regions, this decrease is consistent with declining relative humidity over land nearby. And reanalysis data – which provides estimates based on a combination of direct measurements and a weather model – also show a decrease on average, although the year-to-year pattern is a bit different. In short, we need to investigate this further.
Wider implications
Changes in humidity have substantial knock-on impacts at both the global and local level.
Increasing water vapour at the surface means more water vapour will eventually make its way up through the atmosphere where its role as a greenhouse gas becomes important.
Higher levels of moisture in the air also means more rainfall – especially in heavy rainfall events. Extreme events, such as hurricanes, can already be devastating to society and the environment, so increasing their rainfall makes these even more dangerous. In addition, higher humidity can also raise the risk of heat stress on very warm days.
The implications of a decrease in relative humidity are less obvious. Decreasing saturation will affect something called the vapour pressure deficit. This is basically a measure of how much extra water vapour the atmosphere could hold at that temperature. When the vapour pressure deficit is high, plants may need to close their stomata to avoid too much moisture loss. In these dry conditions, wildfires can start more easily and spread more easily.
The decrease in relative humidity over land is really interesting. We do not see the same decrease in historical reconstructions from climate models, although we do see increasing temperature and specific humidity. This means that future impacts related to saturation and water vapour levels are a bit more uncertain, especially over those regions showing strong changes in relative humidity.
Global dataset
Humidity has been measured for decades using psychrometers, although electronic sensors tend to be used more recently. Like all meteorological observations, there are various sources of error and bias that have to be accounted for so that we can be sure we are looking at climate signals rather than observing system features.
Over the last few years I have led the development of the Met Office Hadley Centre’s HadISDH dataset of surface humidity over land and ocean. This has been a collaboration between the Met Office, the National Physical Laboratory, Maynooth University, the NOAA National Centers for Environmental Information, the Climatic Research Unit at the University of East Anglia, and the National Oceanography Centre.
The dataset is designed to be used for studying large scale trends and variability, assessing the validity of climate models and understanding climate change.
It provides monthly average figures spanning January 1973 to December 2019 on a global grid. The dataset, which will be updated every January, provides seven variables, including the specific humidity, relative humidity and the simultaneously measured air temperature. For a closer look, the data is downloadable from the Met Office website and is now on the Met Office Climate Dashboard.
The dataset uses observations of temperature and humidity from ships over oceans and weather stations over land. The coverage over the globe is reasonable from the 1970s onwards, although the Southern Hemisphere is poorly covered, especially over the oceans.
However, rather worryingly, the Voluntary Observing Ships (VOS) that we depend on for direct measurements have declined significantly since a peak of around 7,700 in the 1980s to only 4,000 currently.
As surface humidity is not something that can be easily measured by satellites or drifting buoys, there is a real risk to our continued ability to monitor this very important variable.
Willett, K. M. et al. (2020) Development of the HadISDH.marine humidity climate monitoring dataset, Earth System Science Data, doi:10.5194/essd-12-2853-2020
-
Guest post: Investigating climate change’s ‘humidity paradox’
-
Guest post: The contrasting impacts of climate change on humidity