State of the climate: 2020 on course to be warmest year on record
Zeke Hausfather
10.23.20Zeke Hausfather
23.10.2020 | 7:00amWhile this year will be memorable for many reasons, it is now more likely than not that 2020 will also be the warmest year for the Earth’s surface since reliable records began in the mid-1800s.
This is all the more remarkable because it will lack any major El Niño event – a factor that has contributed to most prior record warm years.
However, with three months remaining, there is still some uncertainty. There is a chance that a growing La Niña in the tropical Pacific may drive cooler temperatures leading to a second-place finish – at least in some of the global temperature records produced by different groups of researchers around the world.
The first nine months of the year saw record concentrations of major greenhouse gases – CO2, methane, and nitrous oxide – in the atmosphere. Arctic sea ice extent was at record low levels for much of the summer and the summer minimum clocked in as the second lowest on record after 2012.
While climate records are a useful benchmark to highlight the warming of the planet, the change in temperatures, sea ice and other climate factors over time are much more important than if any single year sets a new record.
There has been a clear warming trend over the past 50 years, along with hints in some datasets of potential acceleration in recent years. Similarly, both sea ice extent and volume are clearly declining over time.
Surface temperatures show record warmth
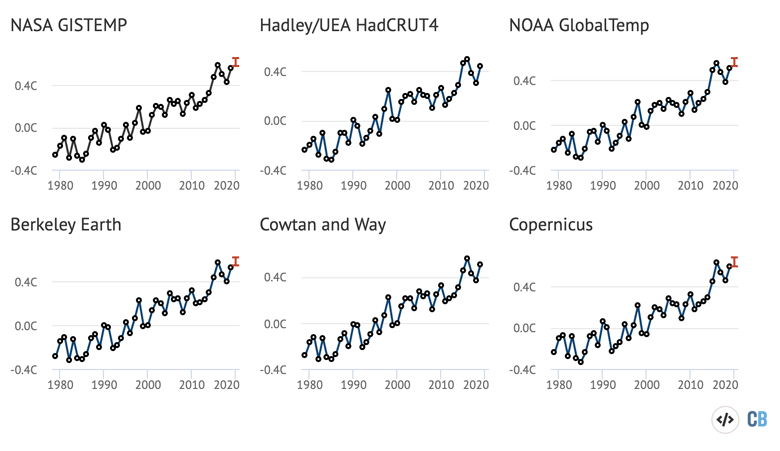
The first nine months of 2020 were remarkably warm. Carbon Brief has analysed records from six different research groups that report global surface temperature records: NASA; NOAA; Met Office Hadley Centre/UEA; Berkeley Earth; Cowtan and Way; and Copernicus/ECMWF.
The figure below shows the temperature anomalies – changes relative to the 1981-2010 average temperature – for each year since 1970, along with the average over the first nine months of 2020. (Note: at the time of writing, September data was not yet available for the Hadley/UEA or Cowtan and Way temperature records.)
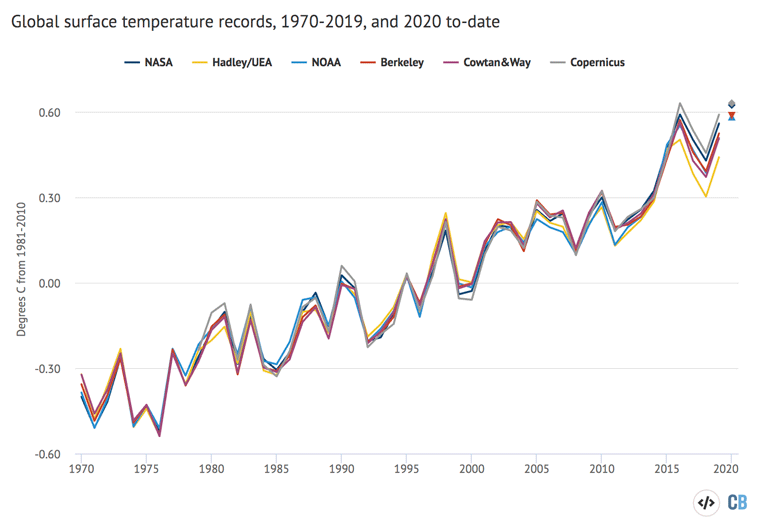
Surface temperature records have shown around 0.9C warming since the year 1970, a warming rate of about 0.18C per decade. During 2020 many of the months have set new temperature records, though the results vary a bit across datasets due to different observations used, adjustments for changes in measurement techniques over time, and methods to fill in gaps between measurements.
The table below shows the ranking of months – with “1st” indicating the warmest temperature on record for that month. Months that were the warmest or tied for the warmest on record are highlighted in green.
| NASA GISTEMP | Hadley/UEA HadCRUT4 | NOAA GlobalTemp | Berkeley Earth | Cowtan&Way | Copernicus/ECMWF | |
|---|---|---|---|---|---|---|
| Jan | 2nd | 1st | 1st | 2nd | 2nd | 1st |
| Feb | 2nd | 2nd | 2nd | 2nd | 2nd | 2nd |
| Mar | 2nd | 2nd | 2nd | 4th | 2nd | 4th |
| Apr | 1st | 2nd | 2nd | 1st | 1st | 2nd |
| May | 1st | 1st | 1st | 1st | 1st | |
| June | 1st* | 4th | 3rd | 1st | 2nd | |
| July | 2nd | 4th | 3rd | 1st | 3rd | |
| Aug | 3rd | 2nd | 2nd | 3rd | 4th | |
| Sep | 1st | 1st | 1st | 1st |
Six of the nine months in 2020 – January, April, May, June, July and September – saw record temperatures in at least one of the global surface temperature datasets. All months of the year saw either the second warmest or warmest in at least one dataset and no dataset has any months below the fourth warmest on record.
The figure below shows how temperatures so far in 2020 (red line) compare to prior years (grey lines) in the NASA GISTEMP dataset (using its new version 4). It shows the temperature of the year-to-date for each month of the year, from January through to the full annual average.
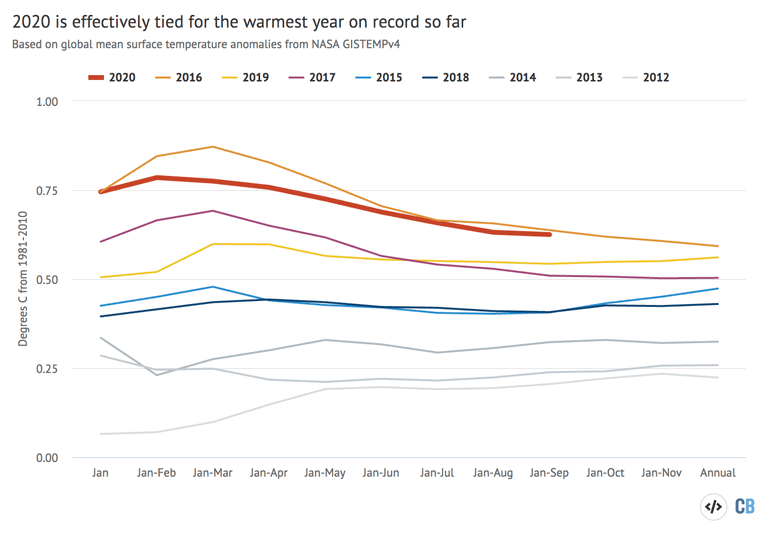
While 2016’s warmth was buoyed by a super El Niño event that faded later in the year, 2020 has been remarkable in that its exceptional early year warmth happened during El Niño-neutral conditions.
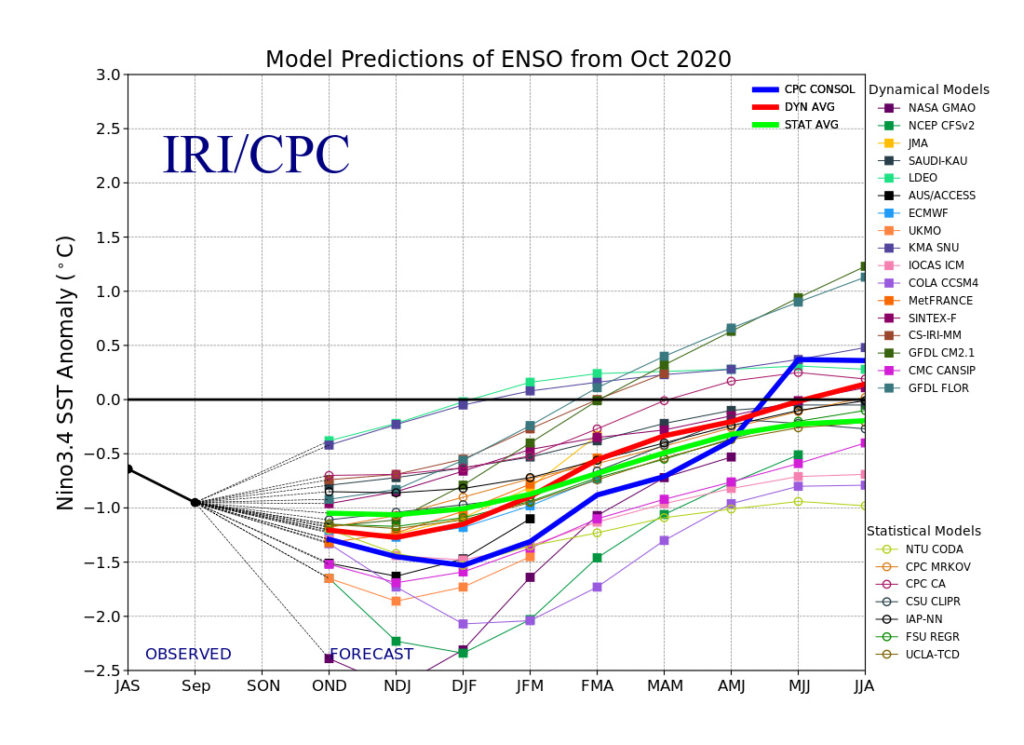
It is likely that a growing La Niña event in the tropical Pacific will modestly depress temperatures in the next few months, but its main effect will be felt in 2021, as global temperatures tend to lag behind those in the El Niño region of the Pacific by around three months.
While predicting the course of La Niña and El Niño events is challenging, it does make it likely that 2021 will be at least modestly cooler than 2020.
The figure below, which shows a range of ENSO forecast models produced by different scientific groups, with the average for each type of models shown by thick red, blue and green lines. Positive values above 0.5C reflect El Niño conditions, while negative values below -0.5 reflect La Niña conditions.
Updating 2020 temperature predictions
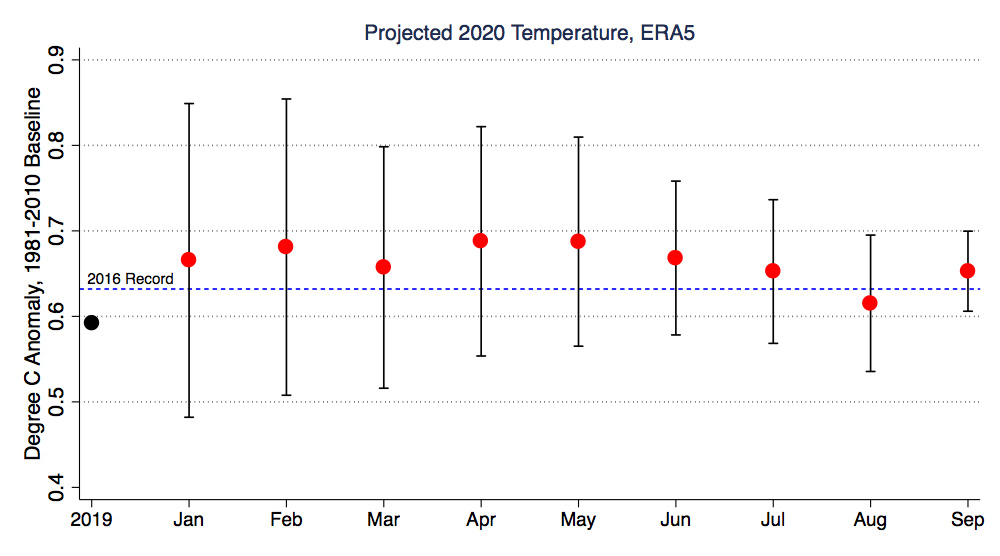
Using the data from the first nine months of the year, plus both past and forecast future ENSO conditions, Carbon Brief has produced a prediction of where 2020 temperatures will most likely land for each different surface temperature record.
The results are shown in the figure below. Annual temperatures between 1979 and 2019 are shown in black for each record, while the likely range (95% confidence interval) of the 2020 annual temperature based on the first six months of the year is shown by the red bar (see methodological note at the end for details).
The probability of where 2020 will fall on the leaderboard of warmest years based temperatures so far this year is shown in the table below.
| NASA GISTEMP | Hadley/UEA HadCRUT4 | NOAA GlobalTemp | Berkeley Earth | Cowtan&Way | Copernicus/ECMWF | |
|---|---|---|---|---|---|---|
| 1st | 83% | 61% | 52% | 55% | ||
| 2nd | 17% | 39% | 48% | 43% | ||
| 3rd | 1% | 0% | 0% | 2% | ||
| 4th | 0% | 0% | 0% | 0% |
In the three months since Carbon Brief’s last state-of-the-climate quarterly report, the likelihood that 2020 will be the warmest year on record has fallen in the NASA and Copernicus datasets, but has risen in the NOAA and Berkeley datasets. NOAA in particular went from 2020 only having around a 43% chance of setting a new record to having a 61% chance (NOAA’s own model gives their dataset a slightly higher 65% chance).
Similarly, there is now only an extremely small chance that 2020 will not be either the warmest or second warmest (after 2016) year on record across all the datasets currently reporting.
With each month of additional data the uncertainty in the expected 2020 annual temperature shrinks, as there are fewer remaining months to change the average. The figure below illustrates this phenomenon, showing both the best estimate (red) and uncertainty range (black whiskers) for 2020 annual temperatures have changed over the course of the year as each additional month of data has become available.
Current temperature in-line with model projections
Climate models provide physics-based estimates of future warming given different assumptions about future emissions, greenhouse gas concentrations and other climate-influencing factors.
The figure below shows the range of individual models forecasts featured in the Intergovernmental Panel on Climate Change’s (IPCC) fifth assessment report – known collectively as the CMIP5 models – between 1970 and 2020, with grey shading and the average projection across all the models shown in black. Individual observational temperature records are represented by coloured lines.
In these models, estimates of temperatures prior to 2005 are a “hindcast” using known past climate influences, while temperatures projected after 2005 are a “forecast” based on an estimate of how things might change.
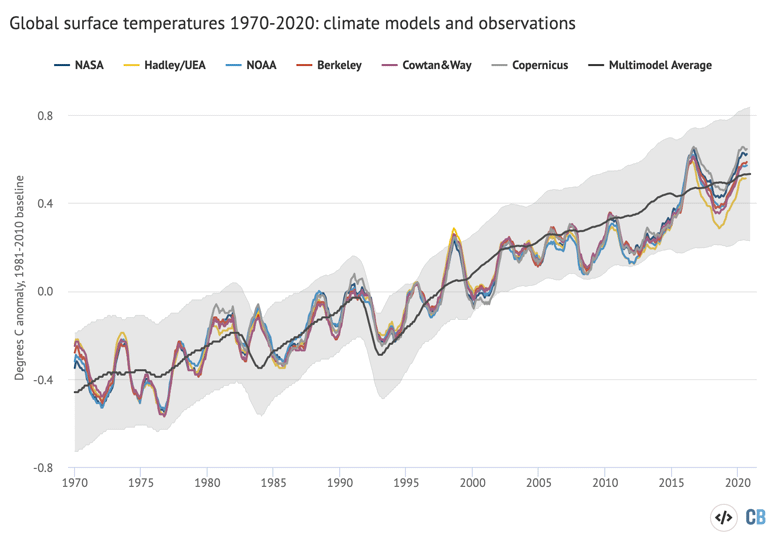
While global temperatures were running a bit below the pace of warming projected by climate models between 2005 and 2014, the last few years have been pretty close to the model average. This is particularly true for globally complete temperature records, such as NASA, Berkeley Earth and the Copernicus/ECMWF reanalysis, which include temperature estimates for the whole Arctic. In recent months, temperatures have been a bit above the model average.
Greenhouse gas concentrations reach record highs
Greenhouse gas concentrations reached a new high in 2020, driven by human emissions from fossil fuels, land use and agriculture.
Three greenhouse gases – CO2, methane (CH4) and nitrous oxide (N2O) – are responsible for the bulk of additional heat trapped by human activities. CO2 is by far the largest factor, accounting for roughly 50% of the increase in “radiative forcing” since the year 1750. Methane accounts for 29%, while N2O accounts for around 5%. The remaining 16% comes from other factors including carbon monoxide, black carbon and halocarbons, such as CFCs.
Human emissions of greenhouse gases have increased atmospheric concentrations of CO2, methane and nitrous oxide to their highest levels in at least a few million years – if not longer.
The figure below shows concentrations of these greenhouse gases – in parts per million (ppm) for CO2 and parts per billion (ppb) for methane and nitrous oxide – from the early 1980s through June 2020 (the most recent data currently available).
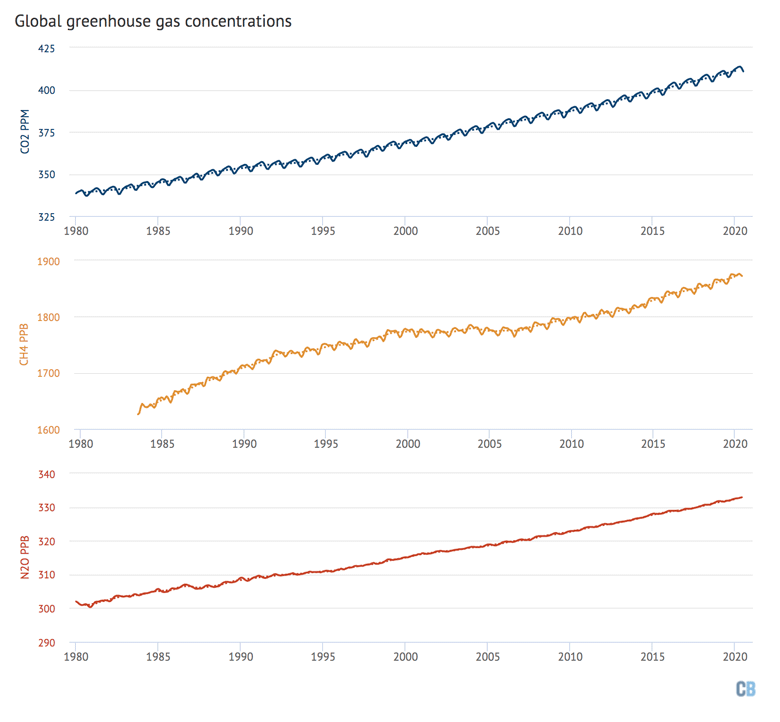
The atmospheric concentration of CH4 began to increase again in 2006 after a plateau from 1999. It further sped up since 2014, with roughly linear growth of 8ppb each year since. Unlike CO2 and N2O, CH4 has a relatively short atmospheric lifetime and does not accumulate in the atmosphere in the long term. This means that – to a first approximation – the level of CH4 in the atmosphere is directly proportional to the level of emissions over the past decade. If emissions remain flat, atmospheric CH4 will be flat, while increasing emissions will show up as increased atmospheric CH4. If CO2 and N2O emissions remain flat, on the other hand, atmospheric concentrations would continue to increase.
While there are some complications around changes in the ability of the atmosphere to remove CH4 over time (through interactions with the OH molecule), the rise in methane concentrations in recent years strongly suggests that global emissions of CH4 have also been increasing.
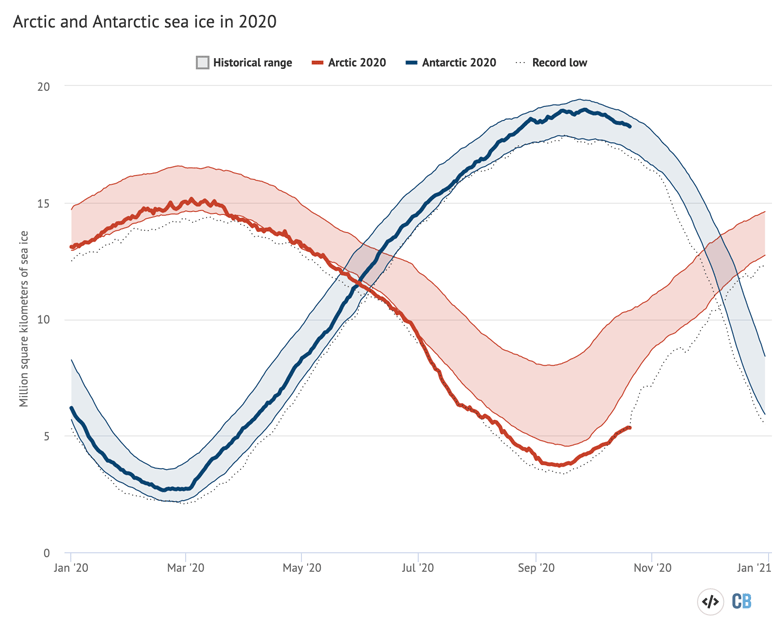
Arctic sea ice sees second-lowest summer minimum
Arctic sea ice extent was at extremely low levels for much of the summer of 2020, setting new records every day during the month of July. Such records refer to the era of polar-observing satellites, which began in the late 1970s.
The summer minimum – which typically occurs in late September – was the second lowest on record. The sea ice recovery has also been unusually slow in the Arctic this year, with sea ice in mid-October at record low levels for this time of year.
Antarctic sea ice extent was close to the long-term average over the first 10 months of 2020.
The figure below shows both Arctic and Antarctic sea ice extent in 2020 (solid red and blue lines), the historical range in the record between 1979 and 2010 (shaded areas) and the record lows (dotted black line). Unlike global temperature records, sea ice data is collected and updated on a daily basis, allowing sea ice extent to be viewed through to the present.
The figure below shows a clear and steady decline in Arctic sea ice since the late 1970s, with darker colours (earlier years) at the top and lighter colors (more recent years) much lower.
The decline in summer sea ice has been particularly stark. This year there was only half as much sea ice during the September minimum in 2020 than there was in the late 1970s and early 1980s.
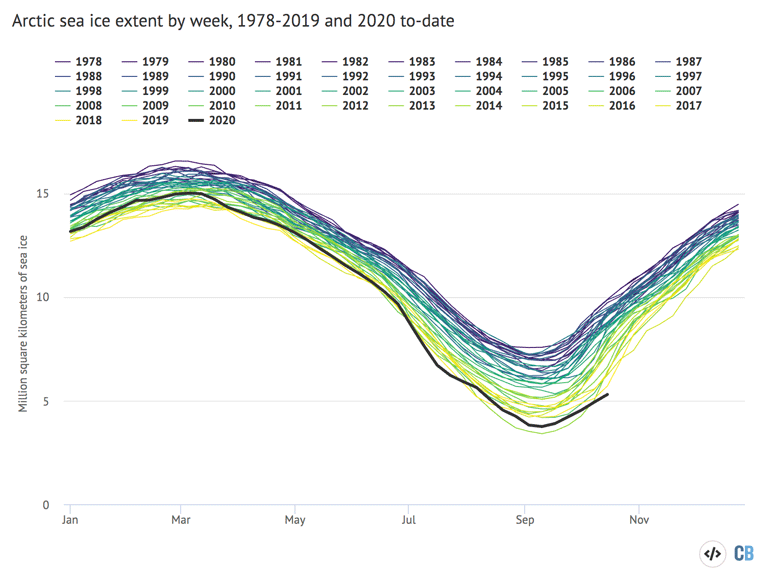
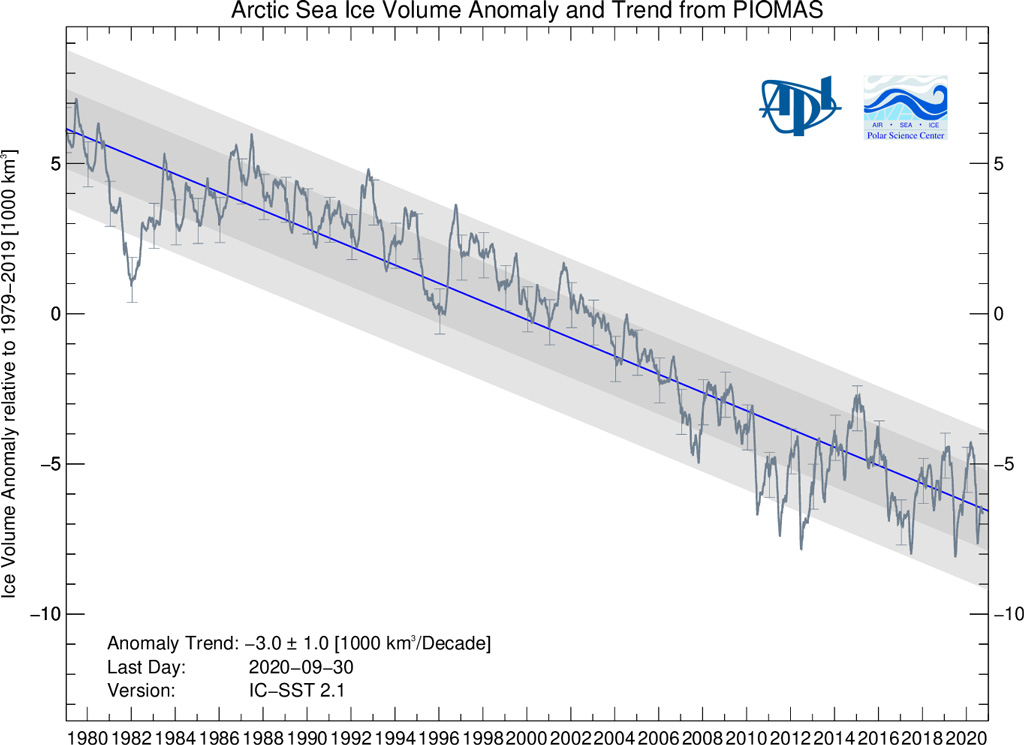
However, sea ice extent only tells part of the story. In addition to declining ice extent, the sea ice that remains tends to be younger and thinner than ice that used to cover the region.
The figure below, using data from the Pan-Arctic Ice Ocean Modelling and Assimilation System (PIOMAS), shows the Arctic sea ice thickness for every year between 1979 and 2020. Sea ice volume was the fourth lowest on record in 2020, and there has been a clear downward trend in sea ice volume over the past few decades.
Methodological note
A statistical multivariate regression model was used to estimate the range of likely 2020 annual temperatures for each group that provides a temperature record. This model used the average temperature over first nine months of the year, the latest monthly temperature value (September 2020), the average ENSO 3.4 region value during the first nine months of the year and the average predicted ENSO 3.4 value during the last three months of the year to estimate the annual temperatures. The model was trained on the relationship between these variables and annual temperatures over the period from 1950 through 2019 (or 1979 through 2019 for the Copernicus/ECMWF reanalysis dataset). The model then uses this fit to predict both the most likely 2020 annual value for each group, as well as the 95% confidence interval. The predicted ENSO 3.4 region values for the last six months of 2020 are taken from the NMME model mean forecast.
The percent likelihood of different year ranks for 2020 is estimated by using the output of the regression model, assuming a normal distribution of results. This allows us to estimate what percent of possible 2020 annual values fall above and below the temperatures of prior years for each group.
-
State of the climate: 2020 on course to be warmest year on record
-
State of the climate: 2020 more likely than not to be warmest year on record