Scientists concerned by ‘record high’ global methane emissions
Robert McSweeney
07.14.20Robert McSweeney
14.07.2020 | 11:01pmWorldwide emissions of methane have hit the “highest levels on record”, according to an international team of scientists.
The finding comes from the latest update to the Global Methane Budget, an international collaboration that estimates sources and sinks of methane around the world.
Their estimates for 2017 – the most recent year for which a full budget has been produced – show that annual global emissions hit almost 600m tonnes. That is around 9% higher than the 2000-06 average.
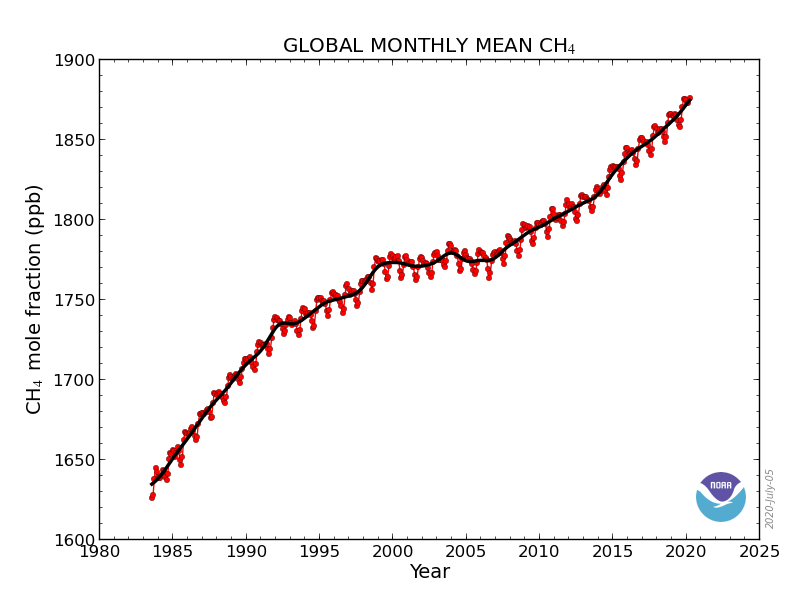
By the end of 2019, the concentration of methane in the atmosphere reached around 1875 parts per billion (ppb), the researchers say – more than two-and-a-half times pre-industrial levels.
Breaking down the different sources, the budget shows that rising emissions from “both the agriculture and waste sector and the fossil fuel sector are likely the dominant cause of this global increase”. This highlights the “need for stronger mitigation in both areas”, the researchers say.
The work also shows “no evidence to date for increasing methane release from the Arctic”. This “crucial” finding means “we are not yet being confounded by substantial feedbacks” that could make meeting the 1.5C and 2C warming limits even harder, another scientist tells Carbon Brief.
Methane budget
Methane is a potent greenhouse gas and the second biggest contributor to human-caused global warming after CO2. Per unit of mass, methane is 84-86 times stronger than CO2 (pdf) over 20 years and 28-34 times as powerful over 100 years.
The global methane budget provides a way of tracking where methane emissions are coming from, how much is taken up through “sinks”, and how much is, therefore, left in the atmosphere.
The methane budget is an initiative from the Global Carbon Project (GCP), an international research programme that aims “to develop a complete picture of the global carbon cycle”. Established in 2001, the GCP provides an annual update on global carbon emissions.
For methane “it’s a bit more complicated”, explains Dr Marielle Saunois, an assistant professor at the University of Versailles Saint Quentin in France, who leads the global methane budget. Saunois spoke to Carbon Brief at the American Geophysical Union’s Fall Meeting in December 2019 and gave further comments over email.
This complication is partly because the scientific community is still finding its feet with the methane budget, says Saunois, but also because it requires long model runs that take time. (See more in the next section.) This makes it “difficult and demanding” to ask the scientists involved to do this every year.
As a result, the methane budget is updated every two-to-three years. This is its third iteration after the inaugural budget was published in October 2013 and the second edition in December 2016.
The researchers have published their findings in a full technical paper in Earth System Science Data and an accompanying “perspective” paper in Environmental Research Letters.
Dual approaches
The global methane budget employs two different approaches to estimate sources and sinks.
The first is “bottom-up”, which focuses on methane emissions at source. This uses data on emissions that are submitted by individual countries in national greenhouse gas inventories to the United Nations. These inventories cover human-caused sources, such as fossil-fuel exploitation, livestock, rice cultivation and landfills.
These estimates are added together with model simulations of other sources of methane, such as wetlands, wildfires and termites. Satellite data on the global area burned by fires, for example, is combined with models that “take into account the type of vegetation burnt, the surface burnt and the duration of the fire, as well as fire type (smoldering versus flaming)”, explains Saunois.
The second approach is called “top-down”. This starts from observations of methane concentrations at a global scale and works backwards using model simulations to estimate where they originated.
Neither approach is flawless and the two methods “don’t match perfectly”, says Saunois. But there are benefits from the dual approach. While the top-down method “is a more reliable estimate for the global total” of methane emissions, says Saunois, the bottom-up estimates come into their own for identifying emissions in specific regions and sectors.
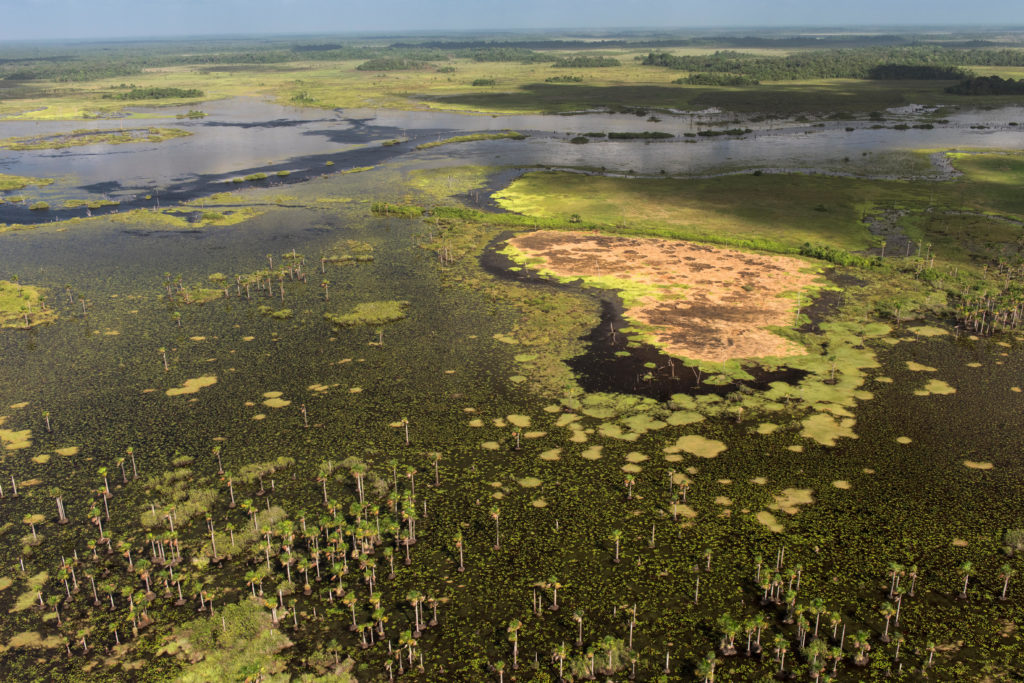
For example, wetlands and freshwater emissions are particularly tricky to estimate, meaning “there is quite a discrepancy” between top-down and bottom-up numbers, says Saunois. This is particularly because the sources overlap, she adds, and, therefore, can be counted under more than one category.
The graphic below, produced as part of the project, shows the complete global methane budget for 2017 using the top-down approach. The coloured arrows indicate the sources and sinks that are human-caused (orange), natural (green) or some combination of the two (hatched).
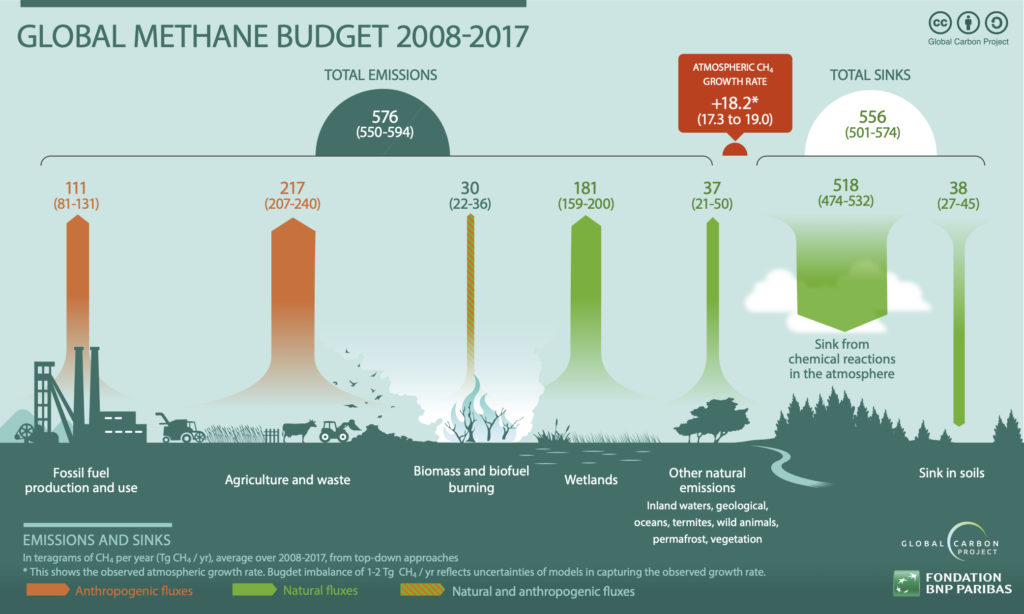
Overall, top-down estimates suggest that the world emitted 596m tonnes of methane in 2017. This is 50m tonnes, or 9%, higher than the average recorded over 2000-06.
There is an approximate 60-40 split between human-caused and natural sources of methane emissions, the paper says, but “anthropogenic sources are estimated to contribute almost all of the additional methane emitted to the atmosphere for 2017”. The paper adds:
“Agriculture and waste contributed 60% of this increase and fossil fuels the remaining 40%, with a slight decrease estimated for biomass and biofuel burning.”
Methane sinks have also increased, the paper notes – from around 546bn tonnes in 2000-06 to 571bn in 2017. Methane stays in the atmosphere for an average of nine years and it is typically destroyed through chemical reactions that produce CO2 and water. A relatively small portion is also consumed by bacteria in soils.
Sectors and regions
Three regions – Africa and the Middle East, China, and South Asia and Oceania – saw the largest increase in methane emissions, the researchers say. Each saw emissions jump by 10-15m tonnes between the 2000-06 average and 2017.
The next largest was an increase of 5.0-6.7m tonnes in North America, the budget shows, which was mostly driven by an increase of 4.4-5.1m tonnes in the US.
In contrast, Europe saw a small decline in emissions of around 1.6-4.3m tonnes – mostly because of fewer emissions from agriculture.
This bucks the trend seen elsewhere, with increases in agricultural emissions the predominant cause for higher total emissions in Africa and South Asia and Oceania.
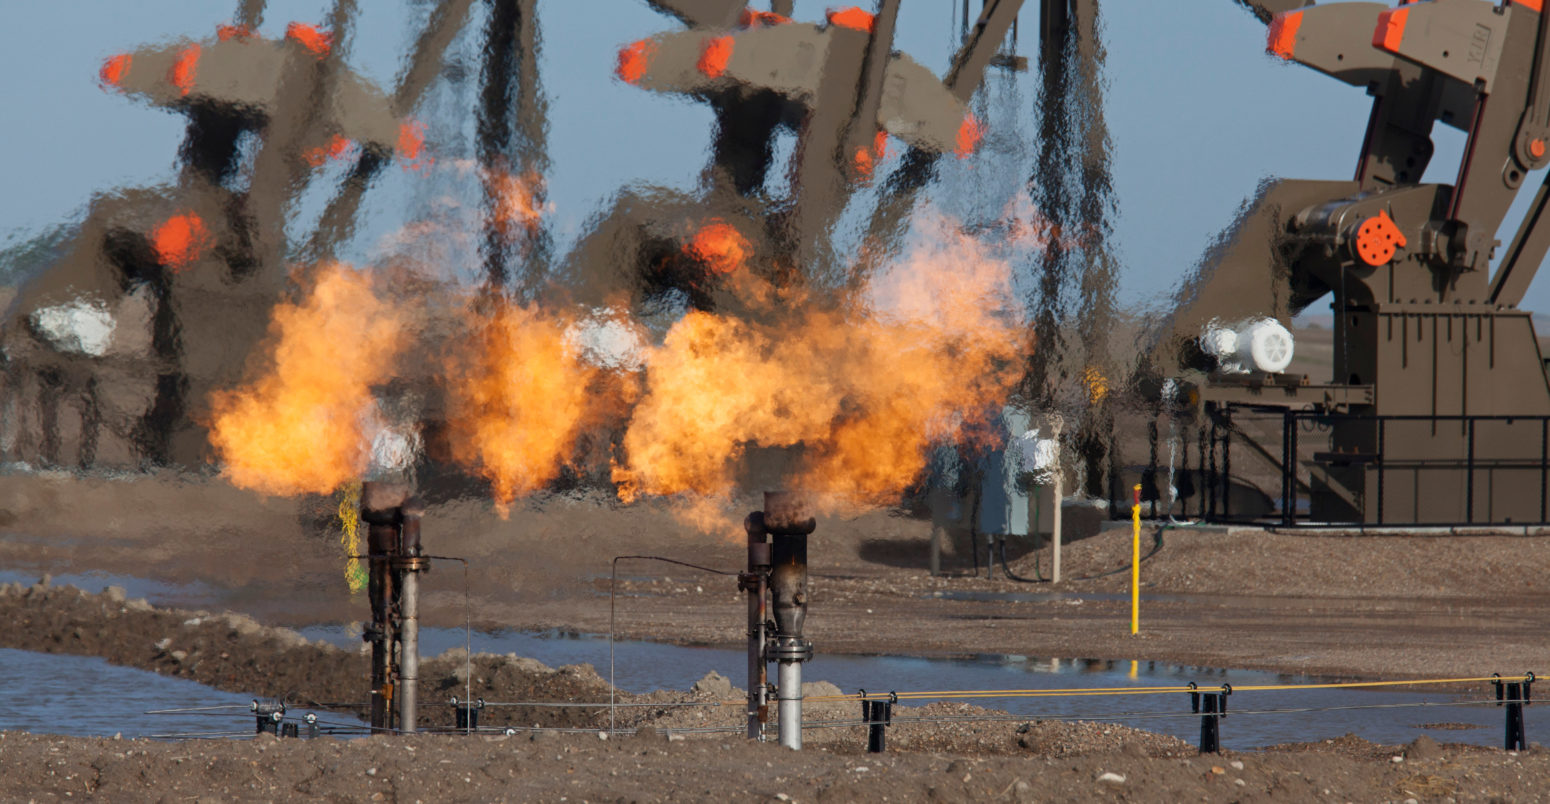
For fossil fuels, the largest increase in methane emissions – 5-12bn tonnes – was recorded in China, with North America, Africa, and South Asia and Oceania seeing increases of 4-6m tonnes. Fossil fuel-related methane emissions in the US increased 3.4-4.0m tonnes.
(Recent research has shown that methane emissions from fossil fuels have been “severely underestimated”.)
The figure below shows total methane emissions for 2017 by region, source and category. The darkness of the orange shading indicates the size of emissions from each region, while the overlying pie charts show the breakdown of emissions by category. The additional pie charts to the right of the map show the emissions by latitude.
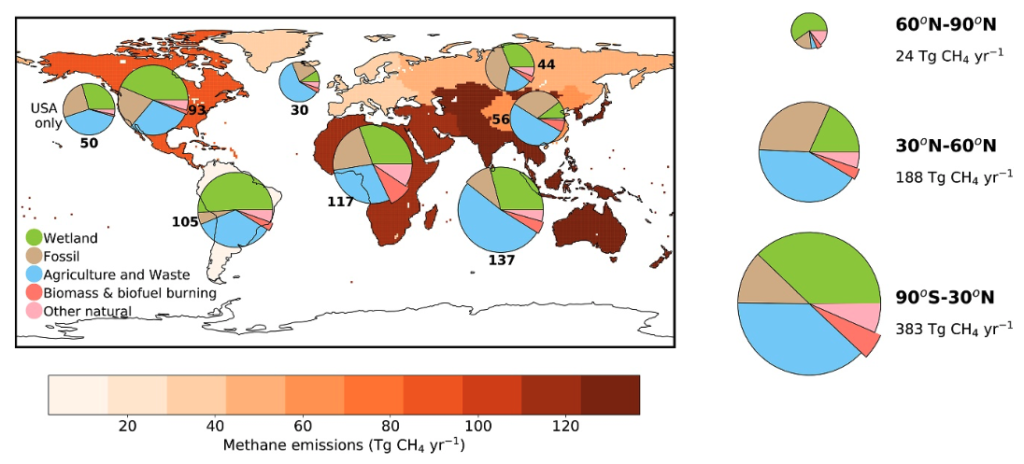
Overall, tropical regions and the southern hemisphere contributed approximately 64% to global methane emissions, while the midlatitudes of the northern hemisphere contributed 32% and the high latitudes just 4%.
The map highlights the regional differences in sources, explains Saunois:
“Typically, you would find most wetland emissions in the tropics and in the high latitudes, and more anthropogenic emissions in China, North America, Europe and the Middle East because of the production of fossil fuels.”
Feedbacks
With the increase in methane emissions recorded in 2017 primarily coming from the tropics and temperate regions, the researchers find “no evidence to date for increasing methane release from the Arctic”.
This finding is “crucial” and also maybe “surprising”, says Dr Chris Jones, a research fellow in Earth system and mitigation science at the Met Office Hadley Centre. Jones, who was not involved in the budget, tells Carbon Brief:
“This is reassuring as it shows us that some of the postulated Earth system feedbacks involving high-latitude wetlands, or permafrost or hydrates, are not yet leading to a detectable increase in methane.”
Permafrost – perennially frozen rock and soils – is found across vast swaths of the northern hemisphere’s high latitudes. This ground holds billions of tonnes of carbon, which could be released – as CO2 and/or methane – as the region warms and the soil thaws. This is an example of a “positive feedback” where more greenhouse gases are released as global temperatures rise, thus reinforcing the warming.
Research by Jones and colleagues has suggested that greater emissions of CO2 and methane from wetlands and thawing permafrost as the climate warms could cut the carbon budget for the Paris Agreement temperature limits by around five years.
The widespread thawing of permafrost has also been mooted as a potential “tipping point” in the Earth system in response to warming. (Carbon Brief has a recent guest article on the topic.)
While “it remains crucial that the world renews its efforts to pursue the Paris Agreement climate targets”, these latest findings shows that “we are not yet being confounded by substantial feedbacks which would make the task harder yet”, says Jones.
In addition, the “hugely important” methane budget update is “a great source of data” for climate modellers aiming to represent feedbacks between climate change and the methane cycle in Earth system models, Jones adds.
Record high
The increasing emissions from agriculture, waste and fossil fuels highlight “the need for stronger mitigation”, the perspective paper says.
Record high methane emissions mean levels of methane in the atmosphere are rising, too. Measurements by the US National Oceanic and Atmospheric Administration (NOAA) show atmospheric methane increased by 8.5ppb and 10.7ppb in 2018 and 2019, respectively. There are two of the largest annual increases of the 21st century.
These concentrations are tracking among the higher emissions scenarios used in projections for the Intergovernmental Panel on Climate Change (IPCC), notes Saunois, falling “below the RCP8.5 pathway, but above the RCP6.0”.
This is “of concern”, the authors say in the technical paper, as these pathways correspond “to temperature increases above 3C by the end of this century”. They add:
“This trajectory implies that large reductions of methane emissions are needed to meet the 1.5-2C target of the Paris Agreement.”
Saunois, M. et al. (2020) The global methane budget, Earth System Science Data, doi:10.5194/essd-12-1-2020
Jackson, R. B. et al. (2020) Increasing anthropogenic methane emissions arise equally from agricultural and fossil fuel sources, Environmental Research Letters, doi:10.1088/1748-9326/ab9ed2
-
Scientists concerned by ‘record high’ global methane emissions
-
Global methane emissions reach ‘record-high’ levels