
Analysis: How ‘carbon-cycle feedbacks’ could make global warming worse
Multiple Authors
04.14.20Multiple Authors
14.04.2020 | 4:49pmScientists making climate-change projections have to deal with a number of uncertainties.
The amount of global warming will depend on the magnitude of future emissions, which, in turn, depends on how society grows and develops. The rate of warming will also depend on how sensitive the climate is to increased atmospheric greenhouse gases.
Yet climate change also depends on an under-appreciated factor known as “carbon-cycle feedbacks”. Accounting for uncertainties in carbon-cycle feedbacks means that the world could warm much more – or a bit less – than is commonly thought.
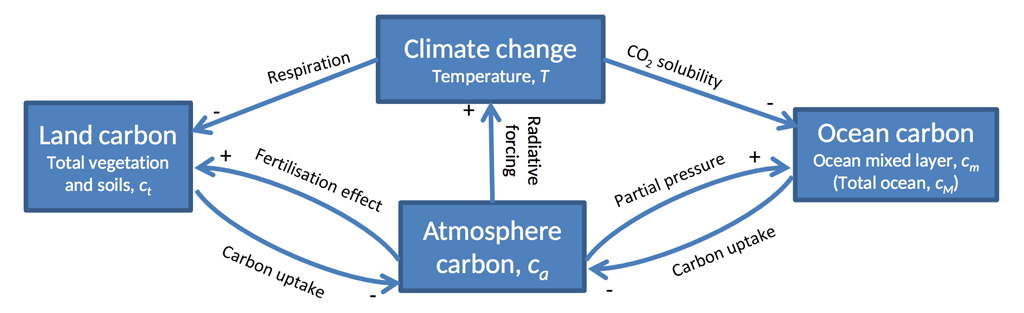
The carbon cycle is the collection of processes that sees carbon exchanged between the atmosphere, land, ocean and the organisms they contain. “Feedbacks” refer to how these processes could change as the Earth warms and atmospheric CO2 concentrations rise.
The commonly used warming projections – those highlighted in Intergovernmental Panel on Climate Change (IPCC) assessment reports – include a single best-estimate of carbon-cycle feedbacks. But they do not account for the large uncertainties in these estimates.
These uncertainties are “one of the dominant sources” of divergence between different model projections, according to Dr Ben Booth and colleagues at the Met Office Hadley Centre.
Climate campaigners, such as Greta Thunberg, have also expressed concern that climate projections typically do not fully incorporate the potential range of carbon-cycle feedbacks.
This article explores the implications of carbon-cycle feedback uncertainties by examining a number of modelling studies conducted by scientists over the past decade. These studies give a similar central estimate of carbon-cycle feedbacks to those used in IPCC projections.
But, at the high end, the results show these feedbacks could push atmospheric concentrations of greenhouse gases much higher – meaning more warming – from the same level of emissions.
Analysis for this article shows that feedbacks could result in up to 25% more warming than in the main IPCC projections.
Importance of carbon-cycle feedback uncertainties
Today, around half of the CO2 emitted by humans remains in the atmosphere, with the remainder absorbed by the oceans and land. However, as the Earth warms this is expected to change. For example, warming reduces the amount of CO2 absorbed by surface ocean waters and the amount of carbon sequestered in soils. It can also accelerate tree death and the risk of wildfires. Thawing permafrost may release additional carbon into the atmosphere. Overall, the carbon cycle is expected to weaken as a result of climate change, leading to more emissions remaining in the atmosphere and less being absorbed by the land and oceans. All of these processes introduce uncertainty when translating future CO2 emissions into changes in atmospheric CO2 concentrations.
Changes in carbon cycle behavior as the Earth warms is an example of a climate feedback – a self-reinforcing change to the Earth’s temperature from a secondary factor. Not all of these feedbacks will necessarily act to increase temperature, however. CO2 fertilisation effects can lead to additional vegetation growth, sequestering more carbon. Nitrogen cycle changes can also enhance land uptake of carbon. Dynamic vegetation changes in response to a warming climate – which account for potential vegetation shifts as regional climate change – also have important, but uncertain effects on the carbon cycle.
Future warming scenarios developed by the climate modelling community do consider carbon-cycle feedbacks, but often use single estimates of the feedback strength from previous studies and do not include any of the uncertainties in carbon-cycle feedbacks. The reason scenarios leave out carbon-cycle feedback uncertainties is that about half of the climate modelling groups do not currently include the biogeochemical cycles needed to model carbon-cycle feedback changes. Those that do include biogeochemistry are referred to as “Earth system models”.
To be able to compare all the different climate models, scientists design experiments where all of the models run a set of specified future concentrations of greenhouse gases and other climate forcings, known as the representative concentration pathways (RCPs). These four concentration-driven experiments – RCP2.6, RCP4.5, RCP6.0, and RCP8.5 – underpinned the main climate projections in the IPCC 5th Assessment Report (AR5) published in 2013. They do not actually use carbon emissions at all and, hence, do not include any of the carbon cycle feedback uncertainties involved in translating emissions into concentrations.
(It should be noted, however, that although the RCPs are defined in terms of “concentrations”, and were used in that way in AR5, they are often referred to as “emissions scenarios” even in papers that use concentration-driven climate projections.This is not strictly accurate and has unfortunately led to some confusion over the nature of the RCPs and a lack of recognition of the uncertainties in translating emissions into concentrations).
To explore the uncertainties in translating emissions into concentrations, a separate climate model experiment – C4MIP – looked at what happens if you run Earth system models using emissions scenarios, rather than providing them with the pre-estimated greenhouse gas concentrations from the RCPs. These were also included in IPCC AR5, but less prominently than the concentration-driven projections.
For these emission-driven simulations, the modellers who had developed the RCPs provided a set of emissions scenarios aligned to the concentration pathways, based on their own models (though it is important to note that a wide range of emissions scenarios are compatible with each RCP concentration pathway).
Because modelling time is limited and not all groups have models that include the carbon cycle, only 12 different models participated for AR5 – and only the emissions conventionally associated with the very high RCP8.5 concentration pathway were used for the Earth System Model runs. Although this high-emissions scenario is not considered to reflect current policies, it illustrates the consequences of returning to a large growth in fuel use and also enables differences between models to be clearly seen.
However, as climate models have grown more sophisticated the range of carbon-cycle feedbacks they include has expanded. None of the AR5 models included permafrost thaw, for example, while a number of newer models have permafrost modules. Similarly, a lot more models now include a dynamic nitrogen cycle, which tends to reduce the magnitude of carbon-cycle feedbacks.
The fact that concentration-driven model runs rely on dated carbon-cycle feedback estimates – and ignore the uncertainty in these estimates – means that the range of possible future climate change is likely larger than is generally accepted.
Modelling carbon-cycle feedbacks
Carbon-cycle feedbacks have been primarily explored through C4MIP. As mentioned earlier, only a subset of models participated in C4MIP experiments, and only a single future emission scenario (that is conventionally associated with RCP8.5) was used.
C4MIP also represents a collection of available models – referred to as an ensemble of opportunity – rather than an experiment purposefully designed to explore uncertainties in carbon-cycle feedbacks. Each model participating in C4MIP designed their carbon cycle to provide what they thought was the most accurate estimate, rather than any purposeful or thorough exploration of all possible potential values for processes governing the carbon cycle.
Forest soil with mossy beech tree’s roots. Credit: Pablo Scapinachis Armstrong / Alamy Stock Photo
A separate attempt to explore carbon-cycle uncertainties was developed in 2017 by Booth and colleagues. Rather than comparing results from different modelling centers, they took a single climate model – a version of the Hadley Centre’s coupled model “HadCM3” with carbon-cycle processes added, called “HadCM3C” – and explored a wide range of possible parameters for the land and ocean biogeochemical processes that influence carbon-cycle feedbacks.
They further constrained their analysis to select only those variants that matched historical observations. Models were run from 1860 onward and modelled atmospheric CO2 concentrations were compared to observations through to the present day. Only the 27 (out of 57) model variants that could effectively reproduce past CO2 concentrations were used to analyze future changes.
This exploration of possible carbon-cycle parameters is called a “perturbed physics ensemble” (PPE). It allows for researchers to explore a much wider range of potential carbon-cycle feedbacks than the C4MIP approach, though with the limitation that they are all run on a single underlying model rather than a diverse range of different models. The PPE was run for two future emission scenarios: those conventionally associated with RCP2.6 and RCP8.5.
The PPE examined six different land-surface parameters, including:
- uncertainties in leaf nitrogen (and its impact on photosynthesis)
- sensitivity of stomatal opening to CO2 concentration changes
- temperature dependence of photosynthesis
- temperature dependence of soil respiration
- soil moisture controls on evaporation
- changes to vegetation distributions
The PPE runs also looked at different values for the atmospheric and ocean parameters that affect carbon-cycle feedbacks. These included the magnitude of temperature response (via changes in convection and cloud parameters), rainfall distributions, land/surface and land/sea contrasts. They result in a wider range of carbon-cycle feedback estimates than C4MIP, with a notable number of much higher-concentration estimates.
Booth and colleagues suggest that most of the uncertainty in future carbon-cycle feedbacks comes from the land carbon cycle – rather than different climate sensitivity or ocean carbon changes. Changes to the land carbon cycle as the world warms and atmospheric CO2 concentrations increase – such as changes in soil respiration and photosynthesis – can allow models that accurately match present-day conditions to end up with much higher CO2 concentrations by 2100.
The figure below shows the distributions of atmospheric CO2 concentrations in the year 2100 for the emissions scenario conventionally associated with each of the four RCPs featured in the IPCC AR5. The solid black line represents the concentration scenario associated with each RCP. The bars represent the range of atmospheric concentration across all the C4MIP and PPE runs, respectively, while each dot shows an individual run.
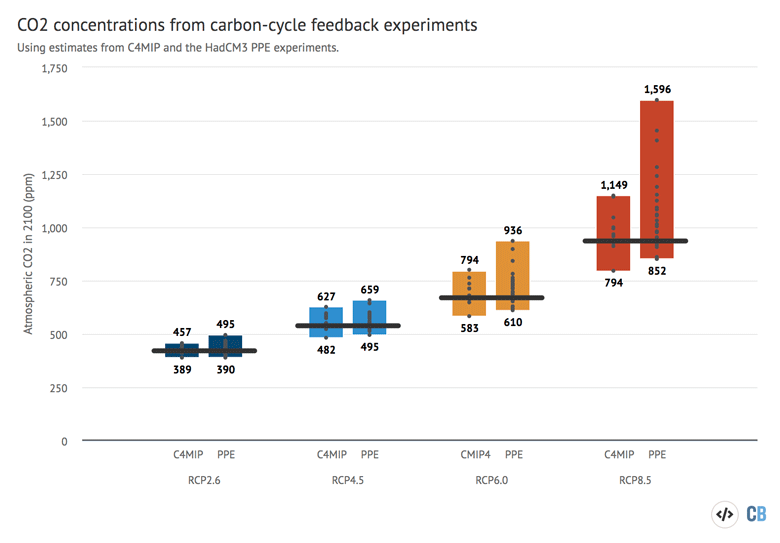
Both the C4MIP and PPE experiments suggest carbon-cycle feedbacks larger than assumed in the conventional relationships between emissions scenarios and concentration pathways for each RCP.
For example, the average atmospheric CO2 concentration arising from the emissions conventionally associated with RCP4.5 was 560 parts per million (ppm) in C4MIP and 562ppm in the PPE, compared to a value of 538ppm in the standard RCP4.5 concentration pathway itself.
Differences are larger in higher-emission scenarios than lower-emission ones. The average concentration arising from conventional RCP2.6 emissions is 3% higher in both C4MIP and the PPE. With conventional RCP4.5 emissions it is 4% higher in both sets of experiments, while with conventional RCP6.0 emissions it is 4% higher in C4MIP and 8% higher in the PPE. RCP8.5 shows the largest differences, with the average concentration 5% higher in C4MIP and 15% higher in the PPE.
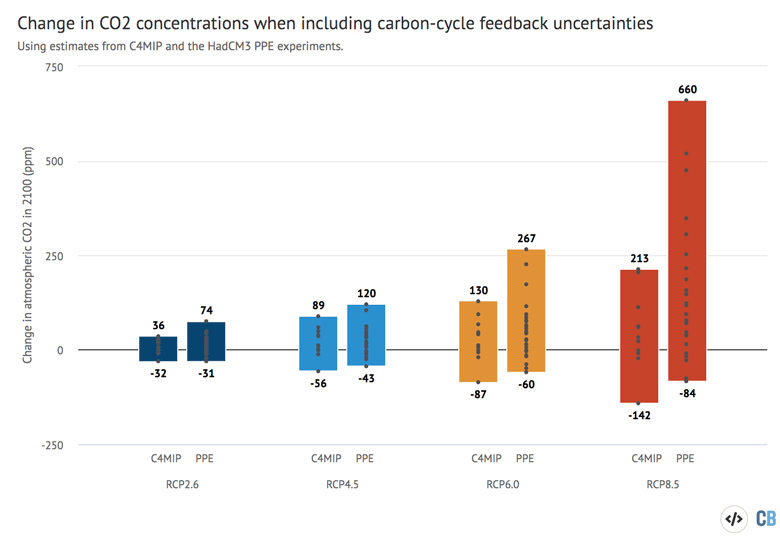
The figure below provides another way to look at the carbon-cycle feedback estimates. Instead of showing the atmospheric CO2 concentrations in 2100 under each RCP, it shows the change in CO2 concentrations in 2100 from the standard RCP concentrations.
For example, using conventional RCP8.5 emissions, CO2 concentrations could be between -142ppm below and 213ppm above the actual RCP8.5 value of 936ppm in C4MIP models and between -84ppm and 660ppm of the actual RCP8.5 value in PPE runs.
The averages obscure a lot of variability in carbon-cycle feedbacks. One of the main takeaways from this analysis is that while the inclusion of updated carbon-cycle feedback estimates may only modestly increase the average outcome, the uncertainty in carbon-cycle feedbacks dramatically increases the less-likely-but-more-extreme CO2 concentration outcomes.
While a lot of carbon-cycle feedback estimates lie close to or modestly above the standard concentration values, there are a smaller number of very large estimates, particularly in the PPE experiments, particularly in high emission scenarios.
For example, in the intermediate RCP6.0 scenario – which is reasonably consistent with currently-enacted climate policies – the standard CO2 concentration in the year 2100 is 670ppm. The average concentration produced from the conventional RCP6.0-related emissions across all the C4MIP runs is 697ppm. Across all the PPE runs its 722ppm. However, the highest-end estimate of all the concentrations including carbon-cycle feedbacks is 799ppm in C4MIP and a sizable 936ppm in the PPE – a 40% increase over the 2100 CO2 concentration in RCP6.0 as used in IPCC AR5.
This means that under the highest available carbon-cycle feedback estimate in the literature a RCP6.0-related emissions scenario could result in 2100 atmospheric CO2 concentrations equal to those in the standard RCP8.5 concentration scenario.
This is still an unlikely outcome – only one of the 39 carbon-cycle feedback estimates produced a result this high – but at the same time it is a risk that merits consideration. The highest-end estimate also involves a model with a climate sensitivity higher than found in any of the climate models featured in the IPCC AR5 (called the Coupled Model Intercomparison Project 5 – CMIP5), though not necessarily outside the range of some new CMIP6 estimates.
It is important to note that the range of carbon-cycle feedback estimates considered here may still be conservative, as many of these carbon-cycle models lack a number of feedbacks – both positive and negative – including permafrost thaw, nitrogen cycle changes and dynamic vegetation. A number of these missing feedbacks have been included in the latest generation of models – CMIP6 – which are currently being run. These experiments will provide an updated view of carbon cycle uncertainties when they are complete.
There are also other types of feedbacks that can affect emissions that are not currently included in models. For example, a 2019 paper by researchers at the University of California, Irvine looked at economic feedbacks in high-emission scenarios – in other words, how economic damages from a high warming world might slow growth and emissions. The authors suggest that “a net negative feedback from economic damages on fossil fuels may be strong enough to offset the positive feedback from terrestrial and marine ecosystems; however, these economic losses may disproportionately affect vulnerable populations and make climate mitigation more difficult”.
Implications of carbon-cycle feedbacks on future warming
Uncertainties in carbon-cycle feedbacks have the potential to result in atmospheric CO2 concentrations by 2100 that are much higher – or modestly lower – than would be expected from the standard relationship between emissions and concentrations in the RCPs.
Changes to atmospheric CO2 concentrations will translate into additional – or reduced – 2100 warming in climate models, though exactly how much depends on how sensitive each model is to changes in atmospheric CO2.
The range of 2100 warming presented in the IPCC AR5 relied on four fixed CO2 concentration scenarios (the RCPs) – each of which was based on the best-estimate of carbon-cycle feedbacks from the prior generation of climate models. However, this single best-estimate neglects the large uncertainties in carbon-cycle feedback estimates shown in the prior sections of this explainer. Including carbon-cycle uncertainty would serve to widen the range of future warming estimates.

In order to quantify the effect of carbon-cycle feedback uncertainties on future warming, we took each of the CMIP5 climate models used in the IPCC AR5 and estimated how much additional (or reduced) warming would have occurred under each of the 12 C4MIP and 27 PPE carbon cycle feedback estimates. (Details of how these calculations were made can be found in the methodology section at the end of the article.)
The figure below shows the results of our analysis. The first bar shows the standard range of warming for each RCP concentration pathway from the CMIP5 climate models featured in the IPCC AR5. The second bar shows what would happen if each of the CMIP5 models were run using the emissions conventionally associated with the RCPs and the 12 different carbon-cycle feedback estimates in C4MIP, while the third shows estimated CMIP5 values for each of the 27 PPE runs.
Each black dot represents a single model estimate – combined with each different carbon-cycle feedback estimate in the case of the second and third bars – and the relative density of black dots gives a sense of the number of models and carbon-cycle feedback estimates that could result in that amount of warming.
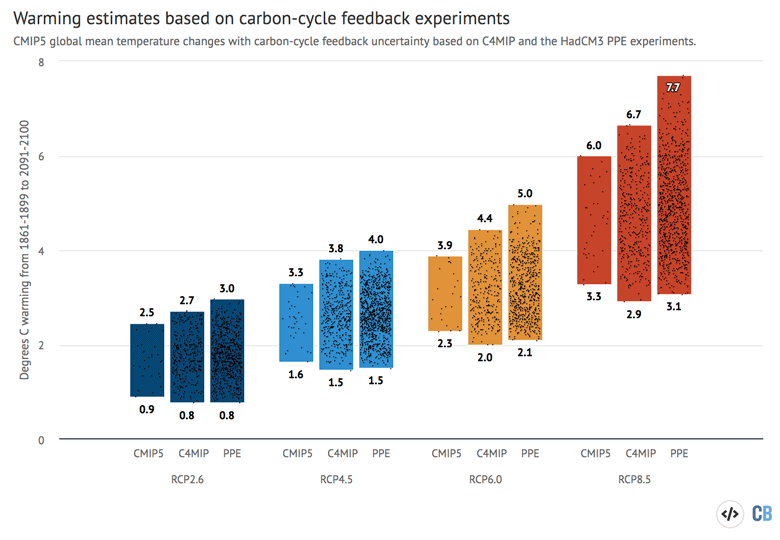
Under the standard CMIP5 model runs, the amount of warming projected in the year 2100 relative to pre-industrial temperatures ranges from a low end of 0.9C under the low RCP2.6 concentration pathway to a high of 6C under the RCP8.5 concentration pathway. When carbon-cycle feedback uncertainties are included this range increases modestly on the low end – from 0.9C to 0.8C – and much more substantially on the high end – from 6C to 7.7C.
The low-end RCP2.6 model is, unsurprisingly, the least sensitive to carbon-cycle feedback uncertainties, as overall emissions are the smallest. In RCP2.6, the average warming across all the climate models is 1.7C in CMIP5 and 1.8C when both C4MIP and PPE runs are taken into account. The range of warming across all the models increases slightly from 0.9-2.5C to 0.8-2.7C using C4MIP and 0.8-3C using the PPE runs.
In the moderate-mitigation RCP4.5 scenario, the average warming increases from 2.5C (with a range of 1.6-3.3C across all the models) in CMIP5 to 2.6C (1.5-3.8C) in C4MIP and 2.6C (1.5-4C) the PPE. The low-mitigation RCP6 scenario warming increases from 3C (2.3-3.9C) in CMIP5 to 3.1C (2-4.4C) in C4MIP and 3.2C (2.1-5C) the PPE.
Finally, the very-high RCP8.5 scenario shows the largest increases, from 4.6C (3.3 to 6C) in CMIP5 to 4.7C (2.9 to 6.7C) in C4MIP and 4.9C (3.1 to 7.7C) in the PPE.
While the average warming projected in all the RCP scenarios only changes modestly – an expected result since their standard concentration pathways already include an estimate of carbon cycle feedbacks – the inclusion of uncertainty substantially expands high-end warming estimates, particularly in high-emission scenarios.
The combination of high climate sensitivity and high carbon-cycle feedbacks could result in substantial warming, even under more moderate emissions scenarios. The intermediate RCP6.0 emissions scenario could see warming of up to 5C, for example, though this is not necessarily the most likely outcome. The central estimate remains around 3C.
This approach used to calculate the effects of carbon-cycle uncertainty on warming in CMIP5 models is somewhat imperfect. One major limitation is that the 39 different carbon-cycle feedback estimates across C4MIP and the PPE are assumed to be independent of the climate models – that is to say that each climate model could conceivably have any of the carbon-cycle feedbacks.
In reality, carbon-cycle feedbacks are driven by both changes in atmospheric CO2 and changes in temperature, so lower-sensitivity climate models would be less likely to see high carbon-cycle feedbacks, for example.
However, accounting for these interactions would have a fairly small impact on the resulting range of warming estimates, as the high-end is still determined by high-sensitivity models that would also be expected to have the largest carbon-cycle feedbacks.
Carbon-cycle feedbacks are an important and often underappreciated factor in determining future warming. While current IPCC warming projections account for an “average” carbon-cycle feedback in the RCP concentration scenarios, they do not include the large uncertainties in carbon-cycle feedback estimates. This analysis shows that when these uncertainties are taken into account, the range of possible future atmospheric CO2 concentrations and warming is considerably wider than is commonly reported.
It is even possible that carbon-cycle feedbacks could allow a more moderate emissions scenario – such as that conventionally associated with RCP6.0 – to reach concentrations found in the very-high-end RCP8.5 scenario, but only in the highest of all available carbon-cycle feedback estimates.
More broadly, this provides yet another reason for policymakers to support ambitious mitigation pathways, as the possibility of very-high warming outcomes may be underestimated in many assessments that do not currently account for carbon cycle feedback uncertainties.
Methodology
To estimate the magnitude of carbon-cycle feedback uncertainties we examined two different analyses: the Coupled Climate–Carbon Cycle Model Intercomparison Project (C4MIP) and the HadCM3C perturbed physics ensemble (PPE). C4MIP provides emissions-driven RCP8.5 runs from 12 different CMIP5 models, but other RCPs were not run due to limited computational time and budget. The PPE provides 27 different runs of the HadCM3C model for RCP2.6, the SRES A1B scenario and RCP8.5. These were selected from a larger set of 57 based on their ability to accurately replicate the relationship between historical CO2 emissions and atmospheric concentrations.
To explore the impact of carbon-cycle feedbacks on a wider range of future emissions scenarios, we use RCP8.5 runs from both C4MIP and the PPE to estimate the likely magnitude of carbon-cycle feedbacks in the other RCPs. We analysed carbon-cycle feedback values when the RCP8.5 run reached atmospheric concentrations equivalent to 2100 values in other RCPs.
For example, the CO2 concentration in RCP4.5 in 2100 is 538ppm; this is the same level that is reached in the year 2050 in RCP8.5. By looking at the range of carbon-cycle feedback estimates in the year 2050 in the RCP8.5 run, we can get an approximation of the 2100 value for RCP4.5. In the case of the RCP2.6 scenario, we used the provided RCP2.6 runs from the PPE but estimated them using RCP8.5 for C4MIP (as C4MIP only has RCP8.5 runs available). We tested this approach by comparing the RCP8.5-estimated and provided RCP2.6 runs for the PPE, and found reasonably close alignment despite the relatively near-term year – 2022 – in which RCP8.5 attains RCP2.6 2100 concentrations.
Future warming was estimated for each possible combination CMIP5 model and carbon-cycle feedback estimate for both C4MIP and the PPE. We first obtained merged historical/RCP global mean surface temperature series for 42 different CMIP5 models available in the KNMI Climate Explorer tool. We had to remove four models – CMCC-CM, CMCC-CMS, EC-EARTH and FIO-ESM – where transient climate response (TCR) values for the models were not available in either the IPCC AR5 Table 9.5 or Chen et al 2019 Table 1 (which was used to fill in some models not in Table 9.5), resulting in 38 CMIP5 models.
Next we calculated the carbon-cycle feedback differences from the standard concentration scenario in 2100 in each of the four RCPs for all of the C4MIP and PPE runs. This involved simply differencing the 2100 CO2 concentration in each run from the standard 2100 RCP concentration. These 39 carbon-cycle feedback differences (12 C4MIP models and 27 PPE runs) were then used to calculate the additional (or reduced) warming that would occur in each of the 38 CMIP5 models based on the model TCR.
Specifically, the additional forcing from CO2 was calculated using the equation:
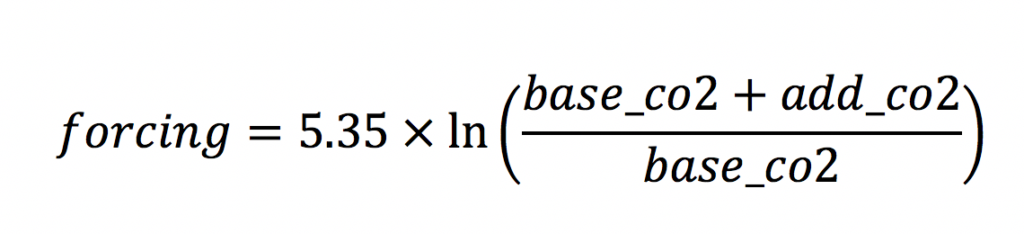
where base_co2 was the standard 2100 RCP concentration and add_co2 was the carbon cycle feedback difference.
Additional warming was calculated by:
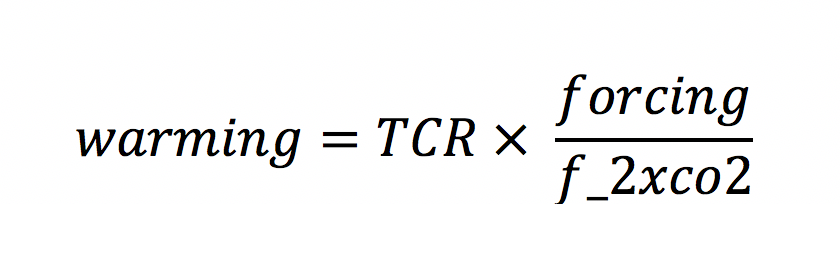
Where f_2xco2 is the forcing associated with a doubling of atmospheric CO2: 3.7 watts per meter squared.
This method has a number of limitations that should be noted. First, as mentioned previously, it assumes independence between carbon-cycle feedback estimates and CMIP5 models, which is likely not to be the case in practice. Second, the approach used to estimate missing RCPs – by using RCP8.5 values when CO2 reaches 2100 levels associated with those RCPs as a proxy – implicitly assumes that CO2 concentration is the major driver of carbon-cycle feedback magnitudes.
In practice, CO2 concentration, temperature and precipitation changes all play a role in determining the magnitude of carbon-cycle feedbacks and other approaches, such as using RCP8.5 values when temperature reaches 2100 levels associated with those RCPs, might produce moderately different results.
All of the underlying material used to produce this analysis is available in a public GitHub repository, including the Jupyter Notebook used to run the code and all of the input and output datafiles.
We are grateful to Pierre Friedlingstein and Ben Booth for providing C4MIP and HadCM3C output.
-
Analysis: How ‘carbon-cycle feedbacks’ could make global warming worse
-
Explainer: How could ‘carbon-cycle feedbacks’ influence global warming?