In-depth Q&A: The IPCC's special report on climate change and land
- How can climate change affect food security?
- How important are socioeconomic changes for future land degradation?
- How could ‘negative emissions’ affect land, food and wildlife?
- How are the issues linked and what solutions exist?
- What does the report say about sustainable development, gender and the role of indigenous communities?
- What has the reaction been?
Why did the IPCC produce this report?
The IPCC’s land report was published at the end of a week-long approval plenary held in Geneva, Switzerland. At this session, government delegates approved the 43-page “summary for policymakers” (SPM) overview report line-by-line, culminating in a marathon overnight session. Once the SPM was agreed, the IPCC also released the full technical report that runs to nearly 1,400 pages, plus supplementary materials. (Following the approval of the SPM, there are some updates that need to be made to the full report to ensure it is consistent with the revised SPM. These have not yet been made and so the individual chapters are subject to changes listed in a “trickle-back” document.) The land report was originally commissioned by the IPCC at an April 2016 meeting in Nairobi (pdf). A draft outline for the report was subsequently adopted at a meeting in Guadalajara, Mexico (pdf), in March 2017. The author team (pdf) of coordinating lead authors, lead authors and review editors – selected in July 2017 – is made up of 107 experts from 52 countries. They have been supported by dozens of contributing authors on each chapter.Speaking at a press conference this morning, IPCC chair Hoesung Lee explained what he viewed to be the “high level findings” of this report:Tomorrow the @IPCC_CH will release the #SRCCL—the Special Report on #ClimateChange and Land.
The report brings together the most knowledgeable experts and the most reliable science to explore the interlinkages between climate change and land usage.pic.twitter.com/LrIvmeo7AW — IPBES (@IPBES) August 7, 2019
“Land is where we live. Land is under growing human pressure and is part of the solution, but land can not do it all.”
The land report is the second special report that the IPCC is due to publish this year. The second – on oceans and the cryosphere – is due in September this year. The IPCC also published a special report on 1.5C of warming in October 2018. The aim of these special reports is to provide “an assessment on a specific issue”. They complement the main “assessment reports” that the IPCC publishes every five or six years. The new report is the first from the IPCC with land as a central focus, since the special report on land use, land-use change and forestry in 2000. Chapter four of the full report sets out what is included in the definition of “land”:“The terrestrial portion of the biosphere that comprises the natural resources (soil, near surface air, vegetation and other biota, and water), the ecological processes, topography, and human settlements and infrastructure that operate within that system.”
And chapter one opens by emphasising the importance of this land to human civilisation:“Neither our individual or societal identities, nor the world’s economy would exist without the multiple resources, services and livelihood systems provided by land ecosystems and biodiversity.”
The report says these contribute an annual value of $75-85tn to the global economy (in the year 2011, based on the value of the US dollar in 2007), putting it far in excess of the world’s combined GDP. As the figure below – from the SPM – illustrates, humans currently appropriate close to three-quarters of the ice-free land globally. Around 12-14% of this area has been converted for growing crops (yellow); 22% is made up of managed or planted forests (blue); and 37% is grassland adopted for grazing and other uses (green). The rectangles in orange on the right-hand side indicate the land currently unused by humans.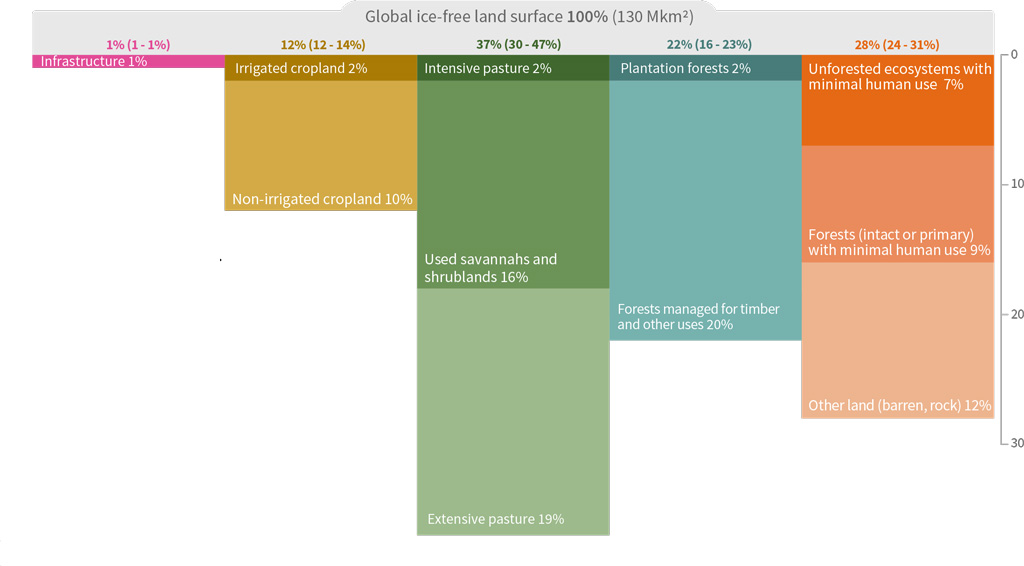
“Conversion of natural land, and land management, are significant net contributors to GHG [greenhouse gas] emissions and climate change, but land ecosystems are also a GHG sink.”
“It is not surprising, therefore” the report notes, that the land plays a prominent role in many of the national commitments to cut emissions that have been pledged under the Paris Agreement. But time to tackle rising global temperatures is short, the report warns:“Confidence is very high that the window of opportunity – the period when significant change can be made, for limiting climate change within tolerable boundaries – is rapidly narrowing.”
Because of the close links between unsustainable land use and climate change, solving one is made more difficult by the other, the report says:“Enhancing food security and reducing malnutrition, whilst also halting and reversing desertification and land degradation, are fundamental societal challenges that are increasingly aggravated by the need to both adapt to and mitigate climate change impacts without compromising the non-material benefits of land.”
This also means that tackling one can have co-benefits – and trade-offs – for the other. This is perhaps the crux of the motivation for the report. As the SPM points out:“Many land-related responses that contribute to climate change adaptation and mitigation can also combat desertification and land degradation and enhance food security.”
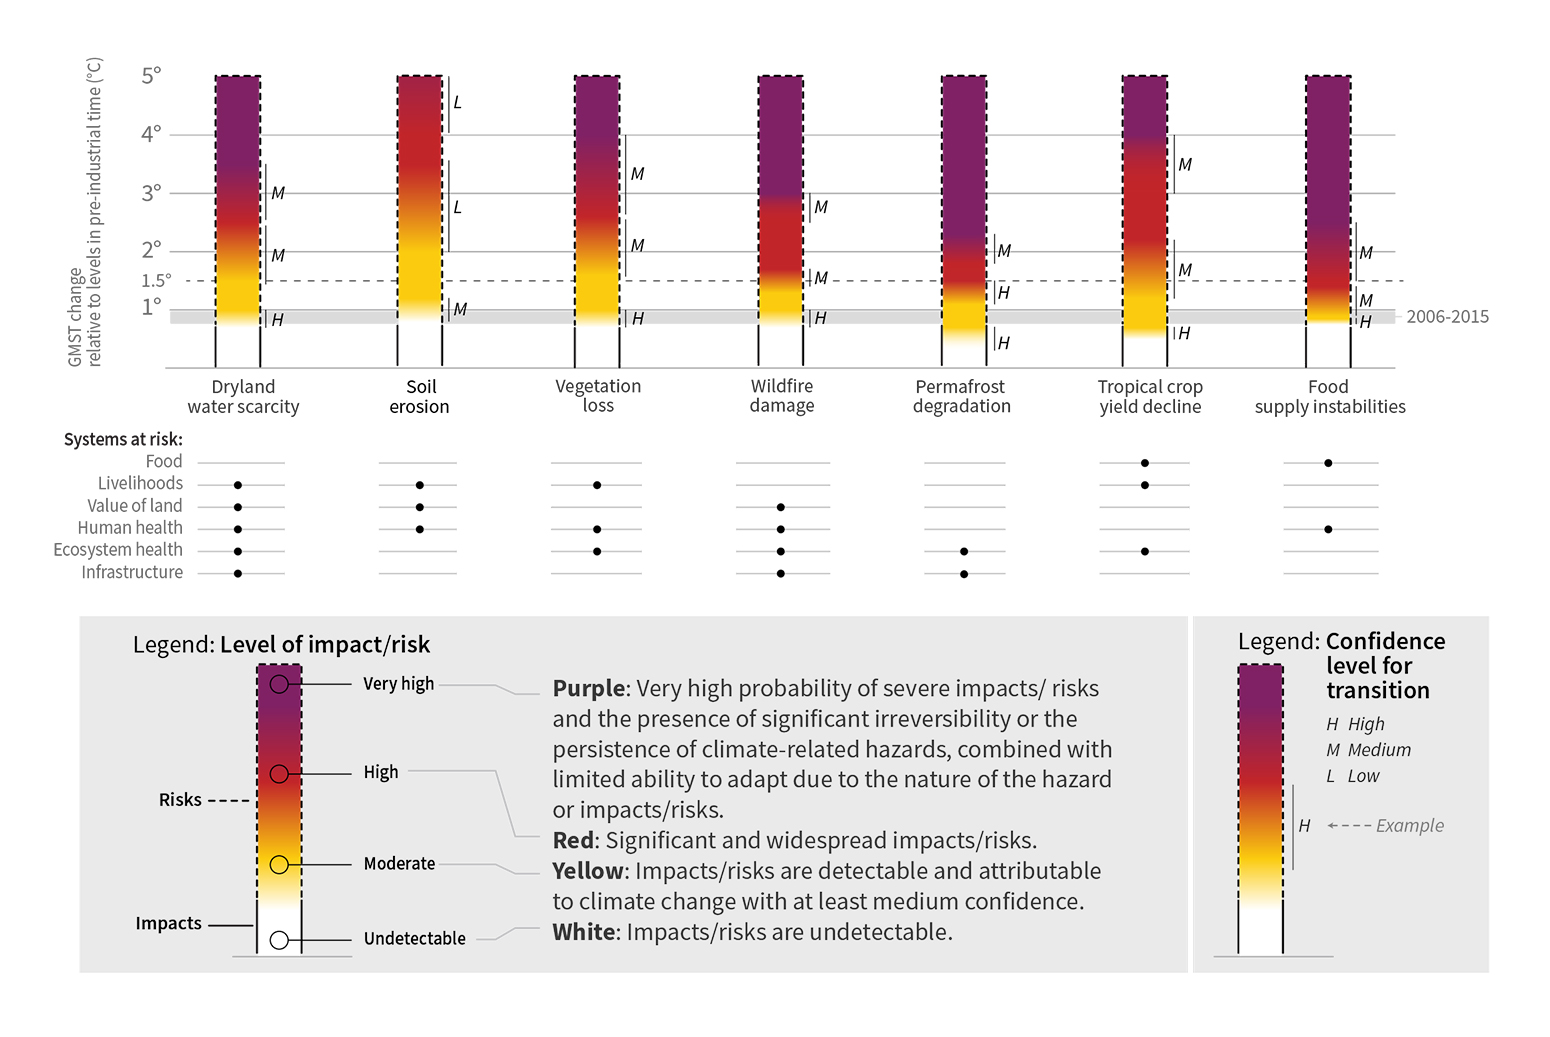
But “none of these response options are mutually exclusive”, chapter one says, which means it is working out how to combine them – in a “context-specific manner” – that is most likely to “achieve co-benefits between climate change mitigation, adaptation and other environmental challenges in a cost- effective way”. In keeping with previous IPCC publications, the land report uses “calibrated language” to communicate levels of confidence. In other words, statements within the land report are accompanied by qualitative expressions of “confidence” based on the robustness of the supporting evidence. There are five levels: very low, low, medium, high and very high. This is illustrated in the figure below from chapter one (pdf) of the report.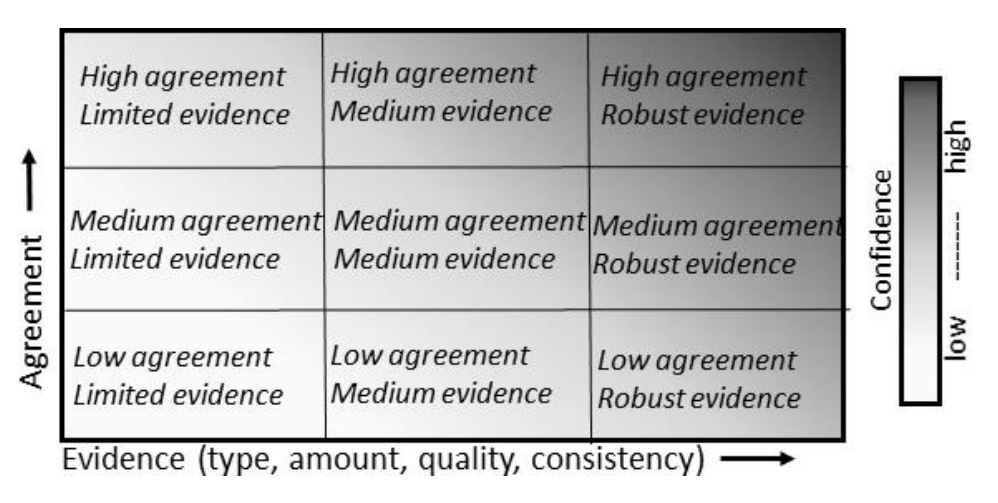
What is land degradation?
Chapter four of the new IPCC report defines land degradation as:“A negative trend in land condition, caused by direct or indirect human-induced processes including anthropogenic climate change, expressed as long-term reduction or loss of at least one of the following: biological productivity, ecological integrity, or value to humans.”
This definition encompasses temporary or permanent decline in quality of soil, vegetation, water resources or wildlife – or the deterioration of the economic productivity of the land, such as the ability to farm the land for commercial or subsistence purposes. Table 4.1 – which runs to five pages – details the major degradation processes and their connections with climate change. It includes, for example, different types of erosion – the gradual breaking down and removal of rock and soil. This is typically through some force of nature, such as wind, rain and/or waves, but can be exacerbated by activities including ploughing, grazing or deforestation. A loss of soil fertility is another form of degradation. This can be through a loss of nutrients, such as nitrogen, phosphorus and potassium, or a decline in the amount of organic matter in the soil. Other processes include: a loss or shift in vegetation type and cover, the compaction and hardening of the soil, an increase in wildfires, and a declining water table through excessive extraction of groundwater. (This definition solely focuses on degradation driven – either directly or indirectly – by humans, it doesn’t include natural processes such as volcanic eruptions and tsunamis.) The report also specifies that forest degradation is land degradation in areas that are still predominantly forest, while “deforestation refers to the conversion of forest to non-forest that involves a loss of tree cover and a change in land use”. The total amount of forest across the world declined by around 3% from 1990-2015, according to multiple lines of evidence, the reports says. However, the change in the rate of deforestation in recent years differs between estimates, it adds, with satellite data suggesting that forest loss is accelerating and on-the-ground estimates suggesting that it is slowing down. There is also little clarity surrounding the extent of land degradation in forests, says chapter four of the report. “The lack of a consistent definition of forest degradation also affects the ability to establish estimates of the rates or impacts of forest degradation. Moreover, the [scientific] literature at times confounds [mixes up] estimates of forest degradation and deforestation.” “The entire spectrum of factors” that drive land degradation range from “very short and intensive events such as individual rain storms of 10 minutes removing topsoil or initiating a gully or a landslide to century scale slow depletion of nutrients or loss of soil particles”, the report says. The long-term nature of some impacts is reflected in the fact that land degradation has “accompanied humanity at least since the widespread adoption of agriculture during Neolithic time, some 10,000 to 7,500 years ago, and the associated population increase”, the report notes. But, of course, not all human impacts on land result in degradation, the report stresses:“There are many examples of long-term sustainably managed land around the world (such as terraced agricultural systems and sustainably managed forests)…We also acknowledge that human use of land and ecosystems provides essential goods and services for society.”
Back to topHow does climate change affect land degradation?
“Land degradation is inextricably linked to several climate variables, such as temperature, precipitation, wind, and seasonality,” the report says. This means that there are many ways in which climate change and land degradation are related, it adds:“The linkages are better described as a web of causality than a set of cause-effect relationships.”
Climate change can affect the land through both gradual changes in temperature and rainfall patterns, as well as changes in the “distribution and intensity of extreme events”, the report notes. There are cases where, even when climate change exerts a direct pressure on degradation processes, “it can be a secondary driver subordinated to other overwhelming human pressures”, the report says. But it identifies three processes in which climate change is the “dominant global or regional pressure”. These are: “coastal erosion as affected by sea level rise and increased storm frequency/intensity, permafrost thawing responding to warming, and increased burning [of wildfires] responding to warming and altered precipitation regimes”. For example, the report has “very high confidence” that erosion in coastal areas as a result of sea level rise will increase worldwide. It adds:“In cyclone prone areas (such as the Caribbean, Southeast Asia, and the Bay of Bengal) the combination of sea level rise and more intense cyclones, and in some areas also land subsidence, will pose a serious risk to people and livelihoods, in some cases even exceeding limits to adaption,”
Climate change “not only exacerbates many of the well acknowledged ongoing land degradation processes” of managed landscapes, such as croplands and pasture, but it “becomes a dominant pressure that introduces novel degradation pathways in natural and semi-natural ecosystems”, the report says. Warming conditions and changing rainfall patterns will also “trigger changes in land- and crop management, such as changes in planting and harvest dates, type of crops, and type of cultivars”, the report notes, “which may alter the conditions for soil erosion”. The report also notes that “changes in extreme weather and climate have negative impacts on food security through regional reductions of crop yields”. For example, it says that on average over recent decades, around 10% of cereal production has been lost globally because of extreme weather events. And climate change is already influencing “species invasions and the degradation that they cause by enhancing the transport, colonisation, establishment, and ecological impact of the invasive species”, the report adds. When rainfall patterns change, it is expected to drive changes in vegetation cover and composition, “which may be a cause of land degradation in and of itself”, the report says, adding: “vegetation cover, for example is a key factor in determining soil loss through both water and wind erosion”. The air can generally hold around 7% more moisture for every 1C of temperature rise. This means a warmer climate has the potential for more intense rainfall events, which “increase the erosive power of rainfall (erosivity) and hence increase the likelihood of water erosion”, the report says. For example, in central India,”there has been a threefold increase in widespread extreme rain events during 1950-2015, which has influenced several land degradation processes, not least soil erosion”. One potentially lethal consequence of increased rainfall and the accompanying land degradation is an uptick in landslides. However, the report notes that while there is “strong theoretical reason” to associate extreme rainfall with these events, there is currently not a lot of evidence linking climate change and landslides.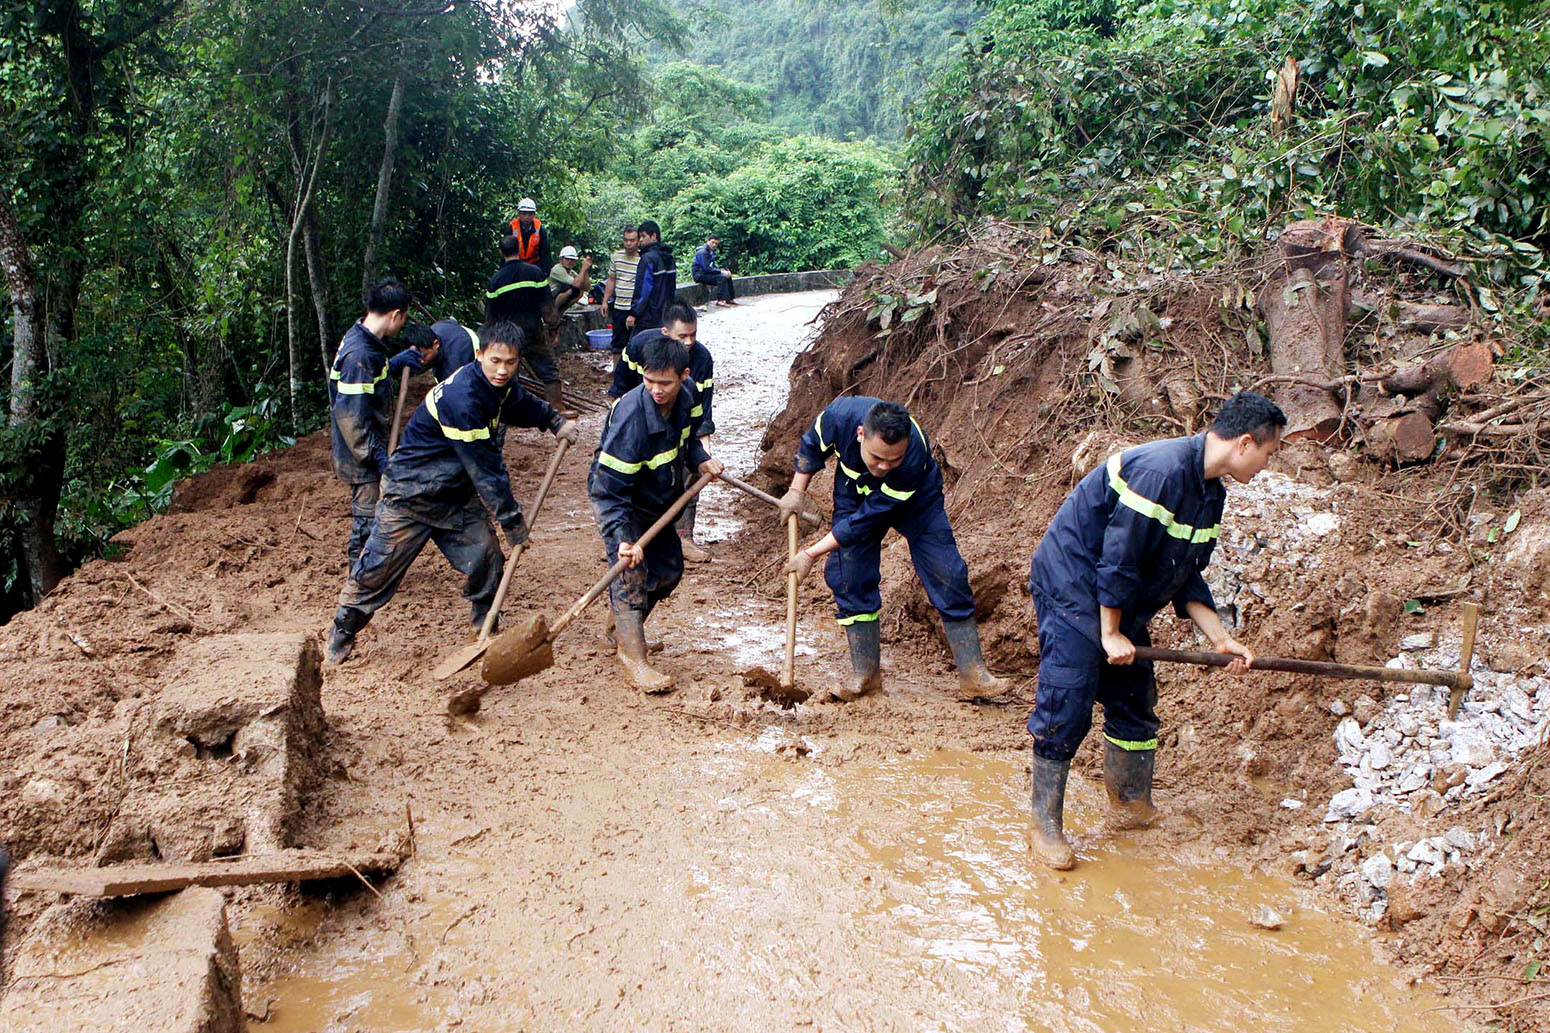
“Heatwaves are projected to increase in frequency, intensity and duration in most parts of the world and drought frequency and intensity is projected to increase in some regions that are already drought prone, predominantly in the Mediterranean, central Europe, the southern Amazon and southern Africa.”
Extreme heat events can reduce photosynthesis in trees, restrict growth rates of leaves and reduce growth of the whole tree, the report notes. Forests can become less resilient to future heat stress as extreme events occur more often, the report adds, and “widespread regional tree mortality may be triggered directly by drought and heat stress (including warm winters) and exacerbated by insect outbreak and fire”.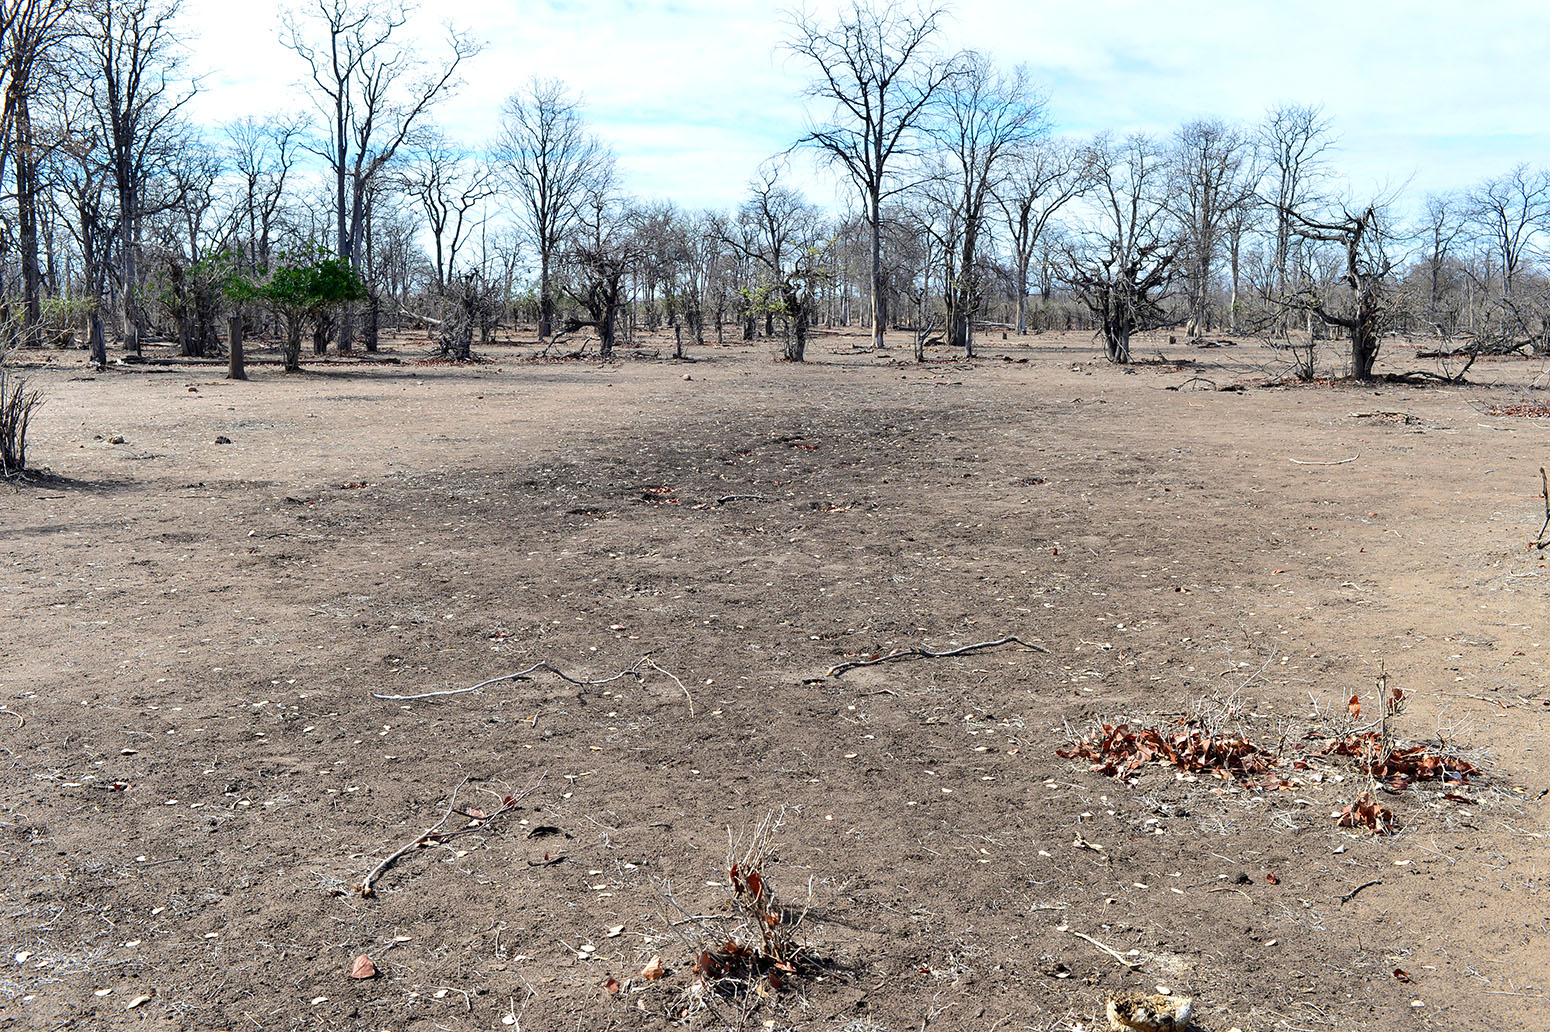
“Increasing CO2 levels in the atmosphere is a driver of land improvement even if the net effect is modulated by other factors, such as the availability of nitrogen and water.”
However, as a modelling study of the Amazon published this week indicates, the benefits for tree growth could be restricted where soil nutrients are limited. Other benefits could include longer growing seasons in high latitudes thanks to warmer shoulder seasons of spring and autumn – assuming they are not affected by summer droughts – and increasing levels of atmospheric CO2 improving how efficiently trees can use water. Despite some benefits to land as the climate changes, the report warns that “negative impacts dominate”, adding that these have already been documented and “are predicted to increase”. The report also looks at the evidence for links between land degradation and human-caused climate change – a field of research known as “attribution” that is typically applied to extreme weather events. Proving a definitive climate change-related influence on land degradation is “extremely challenging”, the report says. This is because degradation is a “complex phenomenon often affected by multiple factors”, related to climate, ecology, land type, and management practices. “There is not much research on attributing land degradation explicitly to climate change,” the report notes, “but there is more on climate change as a threat multiplier for land degradation”. The most important direct links between climate change and land degradation are the result of increasing temperatures, changing rainfall patterns, and intensification of rainfall, the report says. Scientists have shown that each of those links is being affected by human-cause greenhouse gases. Carbon Brief, for example, has previously explained how humans emissions and activities have caused around 100% of the warming observed since 1950. And the IPCC’s special report on 1.5C concluded that human-induced global warming has already caused an increase in the frequency, intensity and/or amount of heavy precipitation events at the global scale. Moreover, “the intensification of the hydrological cycle as a result of human-induced climate change is well established”, the land report says. The report concludes that there is “high confidence” and “robust evidence” that “rainfall changes attributed to human-induced climate change have already intensified drivers of land degradation, but attributing land degradation to climate change is challenging because of the importance of land management.” In addition, the report says: “[S]ince climate change exacerbates most degradation processes it is clear that unless land management is improved, climate change will result in increasing land degradation.” Back to topHow does the land contribute to climate change?
The land plays a key role in storing greenhouse gases. From 2008-17, the land absorbed 30% of the world’s greenhouse gas emissions, according to the report. The land takes in CO2 from the atmosphere when trees and other types of vegetation carry out photosynthesis – the process needed for plant growth. In this process, plants use CO2 to build new materials such as shoots, roots and leaves. This means that, as long as plants are alive, they can act as long-term “sinks” of CO2. Scientists estimate that up to 45% of carbon stored in the land is held by the world’s forests. Another major way that the land holds carbon is through its soils, which typically gain carbon through plant material, crop residues and animal manure. The top metre of the world’s soils is thought to contain three times as much carbon as the entire atmosphere. The report says that the ability of the land to absorb greenhouse gases is currently being aided by “increasing atmospheric CO2 concentration [and] a prolonged growing season in cool environments”. To read more about these issues, please see: “How does climate change affect land degradation?” Though the land acts as a major store of carbon, it can also be a greenhouse gas emitter. The leading cause of greenhouse gas release from the land comes from human activity on its surface. The report finds that around 23% of global greenhouse gas emissions released from 2007-16 came from agriculture, deforestation, peatland degradation and other types of land use. The major driver of CO2 release is deforestation and other types of vegetation loss, according to the report, whereas the major driver of methane and nitrous oxide emissions is agriculture. The chart below, taken from the SPM, gives a picture of how emissions of all three greenhouse gases have changed since 1961. The chart shows (1) CO2 emissions from forestry and other land-use change, (2) methane emissions from livestock and (3) nitrous oxide emissions from agriculture.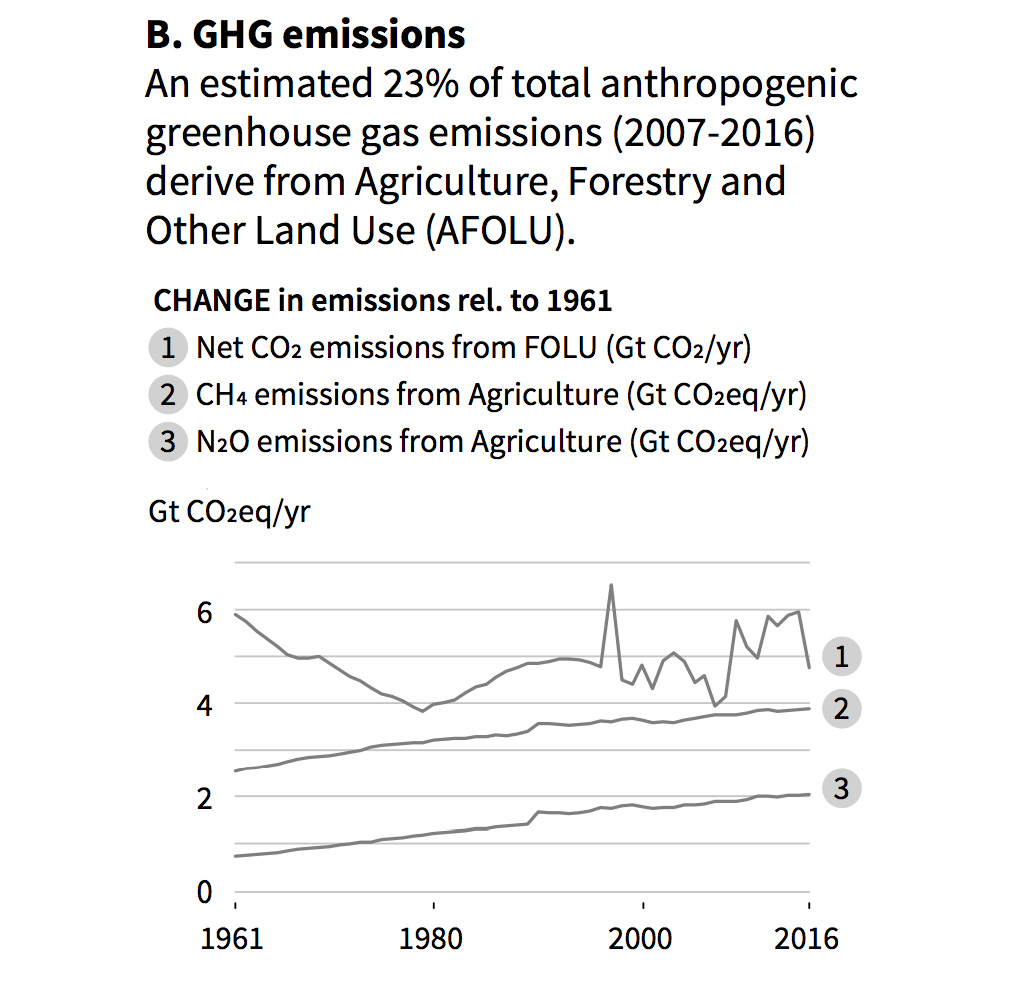
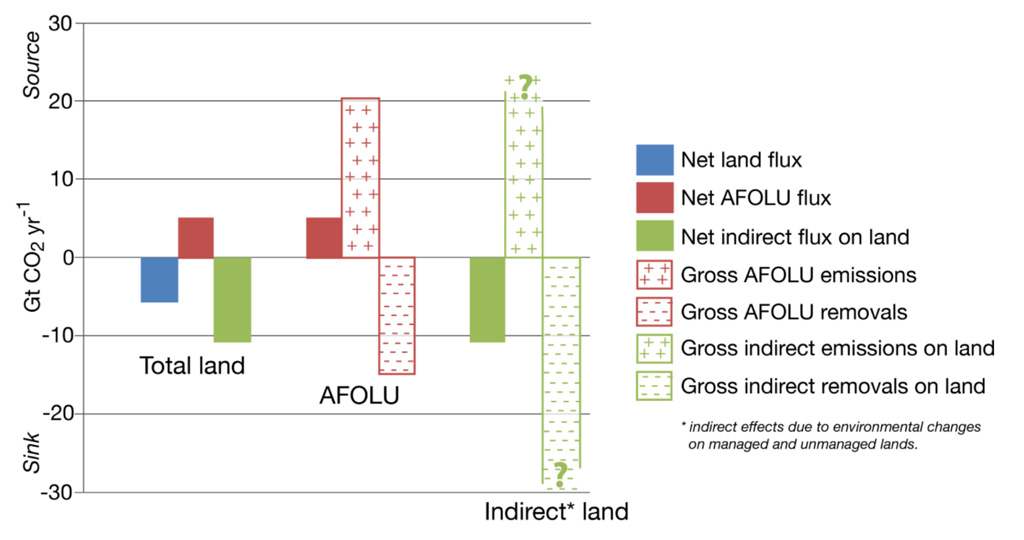
“Peatland management and restoration alters the exchange of methane with the atmosphere. Management of peat soils typically converts them from methane sources to sinks.”
Nitrous oxide emissions from agriculture have almost doubled since the 1960s, the report says. Nitrous oxide is a short-lived but potent greenhouse gas; one tonne of nitrous oxide is equivalent to 265 tonnes of CO2 over a 100-year time period. Nearly two-thirds of the world’s nitrous oxide emissions come from agriculture, the report says. Most of these emissions come from the application of nitrogen fertiliser, the report says. Fertiliser application on crops has increased nine-fold worldwide since 1961, it adds. Back to topWhat does the report say about desertification?
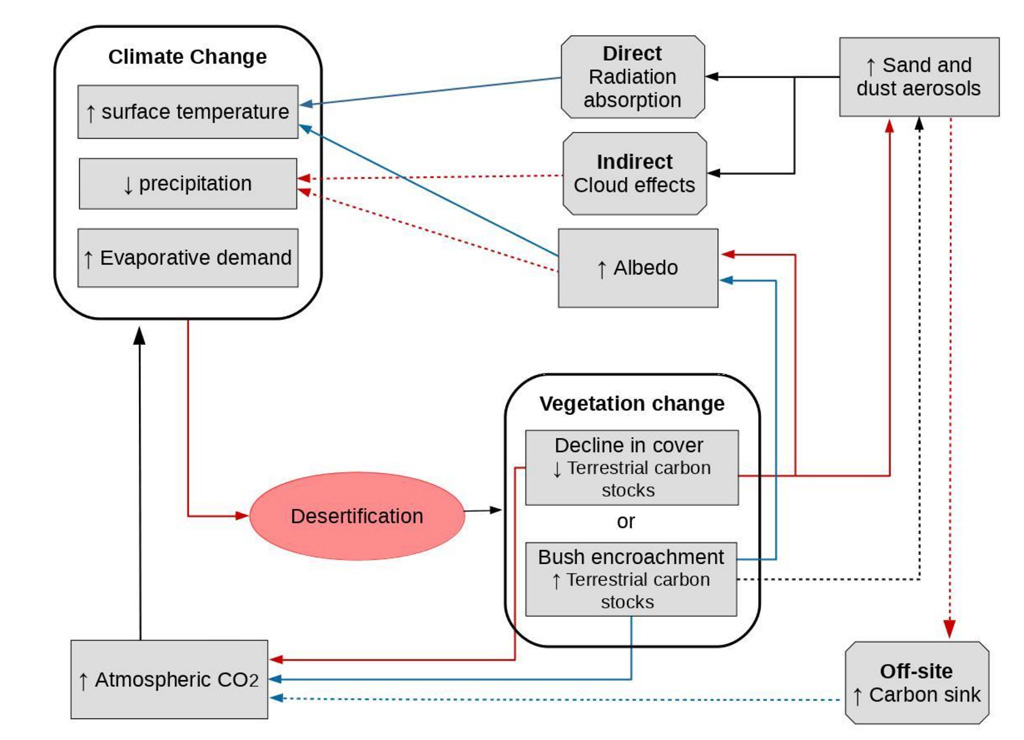
The IPCC land report defines desertification as “land degradation in arid, semi-arid, and dry sub-humid areas, collectively known as drylands, resulting from many factors, including human activities and climatic variations”. Therefore, despite its name, desertification is not “equated to desert expansion”, the report notes, but “represents all forms and levels of land degradation occurring in drylands”. The term “drylands” encompasses parts of the world that are defined as dry sub-humid, semi-arid, arid or hyper-arid – indicated by the yellow, orange and red shading in the IPCC map below. (For a detailed primer on desertification, Carbon Brief published an explainer earlier this week.)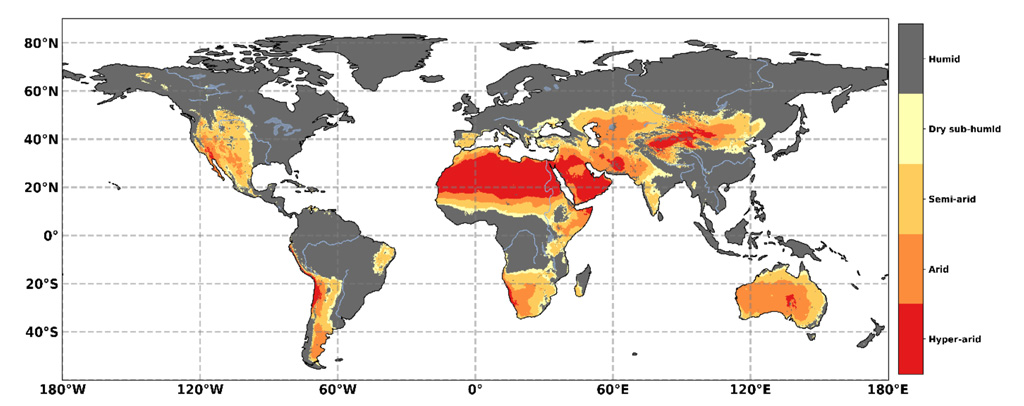
What are the wider impacts of climate change-driven land degradation?
Research suggests land degradation is already having an impact on the livelihoods of people around the world, particularly those living in vulnerable and poverty-stricken regions. However, in chapter four the authors are clear that it is difficult to identify the fingerprints of climate change in these processes:“Unravelling the impacts of climate-related land degradation on poverty and livelihoods is highly challenging. This complexity is due to the interplay of multiple social, political, cultural, and economic factors, such as markets, technology, inequality, population growth, each of which interact and shape the ways in which social-ecological systems respond.”
When examining these issues, the report says it has been difficult to isolate climate as a factor from other drivers of land degradation. Most studies in this area have examined livelihoods of small-scale farmers, and while there is widespread speculation about “potential links” between poverty and climate change due to changes in soil and rainfall, the evidence is currently lacking, it says. Furthermore, while one study estimated that more than two-fifths of the world’s poor live in degraded areas, the report says there is “low confidence” in such figures and notes a need for more research in this area. However, the report also states that climate change is “frequently noted as a risk multiplier” for both land degradation and poverty. In addition, it acknowledges that in many of the poorest parts of the world, poverty, land degradation and vulnerability to extreme events linked to climate change all go hand-in-hand. The SPM notes there are “synergies” between poverty eradication and efforts to tackle climate change, desertification, land degradation and food security. More contentious is the link between climate-related land degradation and migration and conflict. When people are pushed into poverty or have their livelihoods stripped as a result of changes in their environment, one adaptation option is to move to another area – this can be internally or across borders. In theory, this can then add to existing stresses in the new location. Research indicates, for example, that climate-related disasters can be a contributing factor to violent conflict. While the authors note there is still a need for more evidence about the links between climate-induced migration and conflict due to land degradation, the SPM states:“Changes in climate can amplify environmentally induced migration both within countries and across borders, reflecting multiple drivers of mobility and available adaptation measures. Extreme weather and climate or slow-onset events may lead to increased displacement, disrupted food chains, threatened livelihoods, and contribute to exacerbated stresses for conflict.”
The main report cites a handful of examples of such processes. For example, in both Guatemala and Kenya, declining soil quality has been widely cited as a driver behind migrants heading farther afield to generate income. Meanwhile, conflicts in both Rwanda and Sudan have been linked by some scholars to land degradation, whereas others have found climate change is a “weak predictor” for armed conflict. As such, the report finds that the evidence from this area is largely inconclusive:“Studies addressing possible linkages between climate change – a key driver of land degradation – and the risks of conflict have yielded contradictory results and it remains largely unclear whether land degradation resulting from climate change leads to conflict or cooperation.”
Back to topHow can climate change affect food security?
Another major focus point in the report is the ways in which climate change can affect food. Climate change has “already affected food security” in many world regions, the SPM says. Warming is affecting food availability by having a direct impact on crop production, says chapter five of the report:“Observed climate change is already affecting food security through increasing temperatures, changing precipitation patterns, and greater frequency of some extreme events. Increasing temperatures are affecting agricultural productivity in higher latitudes, raising yields of some crops (maize, cotton, wheat, sugar beets), while yields of others (maize, wheat, barley) are declining in lower-latitude regions.”
The current impact of climate change on crop yields varies from region to region, the report notes. In Asia, some parts, including northern China, have seen rice yield increases as a result of regional warming and other factors, such as agricultural innovation, the report says. Crop yield studies focusing on India, meanwhile, have found that warming cut wheat yields by 5.2% from 1981 to 2009, the report says.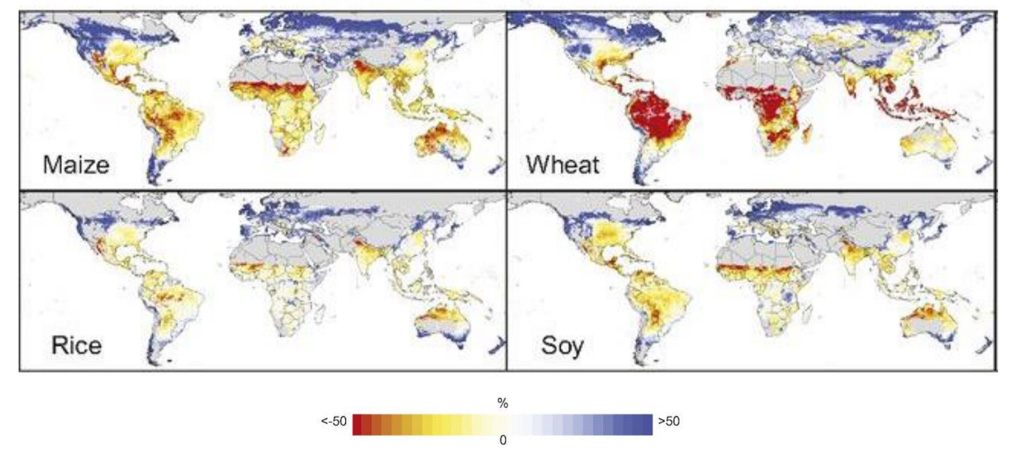
“There is some evidence that exposure will, on average, increase, although there are a few examples where changing stresses may limit the range of a vector [disease carrier].”
Future climate change could also affect livestock production, the report notes. Desertification could affect rangelands where cattle are reared, the report says, while increases in heatwaves could have a “direct impact on animal morbidity, mortality and distress”. Changes to food availability could in turn have an impact on food access and stability via changes to food prices, the report says. Cereal prices could increase by 1-29% by 2050 as a result of climate change, the SPM says, “leading to higher food prices and increased risk of food insecurity and hunger”. Higher food prices particularly threaten the world’s poor, the report notes:“Decreased yields can impact nutrient intake of the poor by decreasing supplies of highly nutritious crops and by promoting adaptive behaviours that may substitute crops that are resilient but less nutritious…In the developed world, poverty is more typically associated with calorifically-dense but nutrient-poor diets, obesity, overweight, and other related diseases.”

How important are socioeconomic changes for future land degradation?
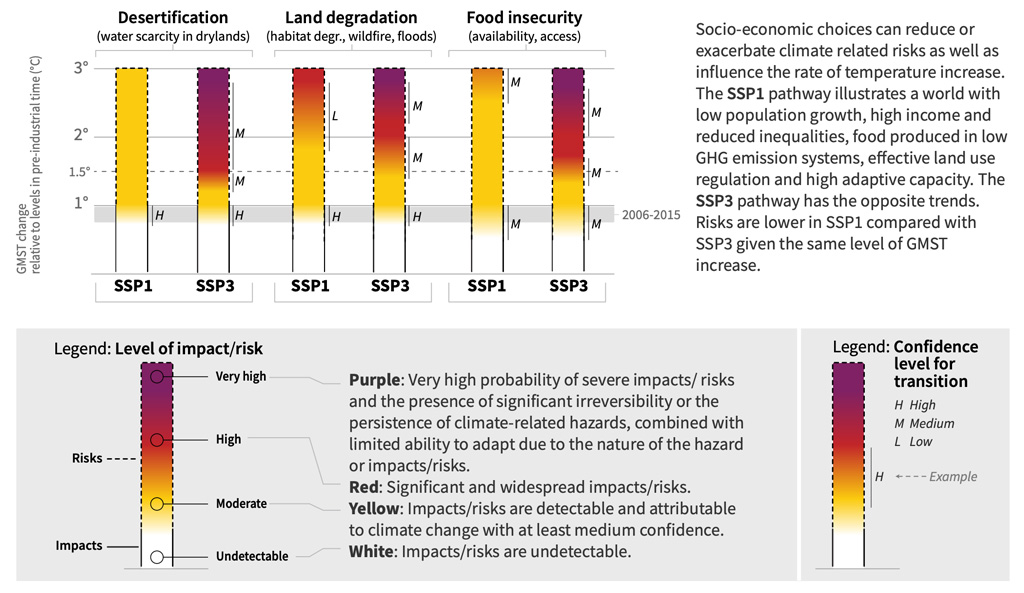
The report emphasises the role that socioeconomic changes around the world will have in determining the planet’s future, noting that projections often show these shifts having a larger impact on land use patterns than climate change itself. The harm generated by the changing climate will not only result from rising temperatures, but also on how humanity’s consumption patterns, land management and populations shift alongside it, the report says. This is outlined concisely in the SPM:“Pathways with higher demand for food, feed, and water, more resource intensive consumption and production, and more limited technological improvements in agriculture yields result in higher risks from water scarcity in drylands, land degradation, and food insecurity.”
The “pathways” it refers to are a standard set of “shared socioeconomic pathways” (SSPs), which are used across the IPCC’s reports to give a sense of how changes in global society, demographics and economics will interact with climate change. While there are five SSPs in total, the land report mainly focuses on the first three, with each one offering significantly different outcomes. A Carbon Brief explainer from last year outlines what each of these scenarios means in more detail. SSP1 is characterised by low population growth, with just seven billion people on the planet by the end of the century. High incomes, reduced overall inequalities and effective land use regulations are also features of this scenario, as well as less meat consumption and food waste. Based on a continuation of past trends in consumption and technological progress, SSP2 results in medium population growth, hitting nine billion by 2100. SSP3 meanwhile sees population nearly double that of SSP1, at 13 billion in 2100. This pathway is characterised by low incomes, resource-intensive consumption patterns, barriers to trade and a slow rate of technological change. Which of these socioeconomic pathways is followed – and the changes in population, consumption patterns and other factors that result – has a large impact on the way land will be used in future, the report says. The figure below shows how much more (positive numbers) or less (negative numbers) of the Earth’s surface would be devoted to forest (blue line and shaded area), bioenergy crops (purple), “natural land” (red), cropland (yellow) or pasture (green) through the 21st century, compared with the levels in 2010. From left to right, each chart shows how land use will change in scenarios limiting warming to 1.5C by the end of the century. The left-most chart shows this for SSP1, with SSP2 in the centre and SSP5 on the right (this is a resource-intensive, fossil-fuel dependent pathway).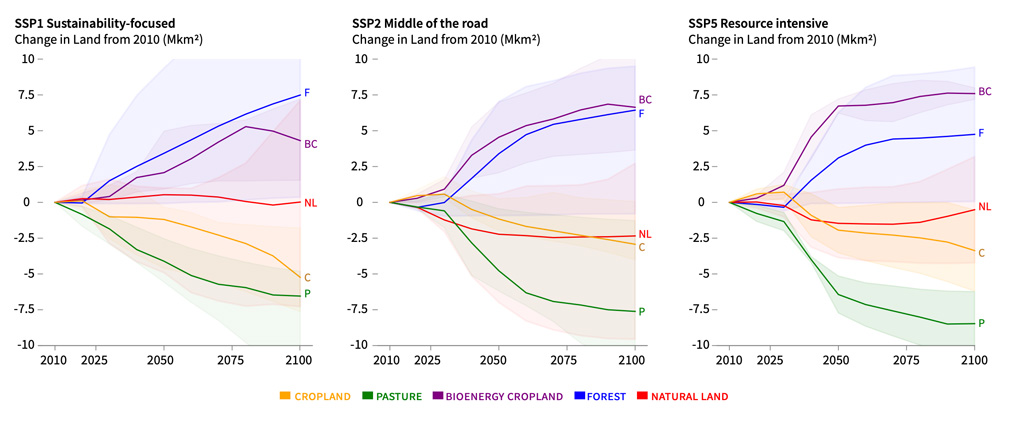
How could ‘negative emissions’ affect land, food and wildlife?
A major finding of the IPCC’s landmark 1.5C report was that some degree of “negative emissions” will be needed to keep global warming within “safe limits”. “Negative emissions” are a group of methods that aim to remove CO2 from the atmosphere and store it in the land or ocean. They range from the natural-sounding – planting trees, for example – to the technologically advanced, such as using machines to suck CO2 from the air (known as direct air capture, or DAC). If pursued at scale, most of these techniques would require varying amounts of land – potentially reducing the land left for wildlife and food production. The land report emphasises that there is no one “silver bullet” when it comes to negative emissions and that, if just one technique were deployed on a vast scale, it could “increase risks for desertification, land degradation, food security and sustainable development”. Many of the modelled pathways for limiting global warming to 1.5C rely heavily on a technique called “bioenergy with carbon capture and storage” (BECCS). (Some research has suggested the 1.5C target can be achieved without BECCS, but only under stretching assumptions for change elsewhere.) This technique involves growing crops, using them to produce energy and then capturing the resulting CO2 emissions before storing them in the ground or sea. A small number of pilot projects carry out BECCS – but the technique has not yet been proven to work at scale. How much BECCS is used in the future will depend on a range of complex social and technical factors, the report says. (To read more about the world’s possible future socioeconomic pathways, please see: “How important are socioeconomic changes for future land degradation?”) However, if BECCS is pursued at the level “necessary to remove CO2 from the atmosphere at the scale of several billion tonnes of CO2 per year”, it could “increase pressure on land” and cause “land degradation”, the report says. Widespread tree planting – also known as “afforestation” – could also come with risks, the SPM says. Large-scale afforestation could “increase demand for land conversion” and raise risks of degradation, the report says.
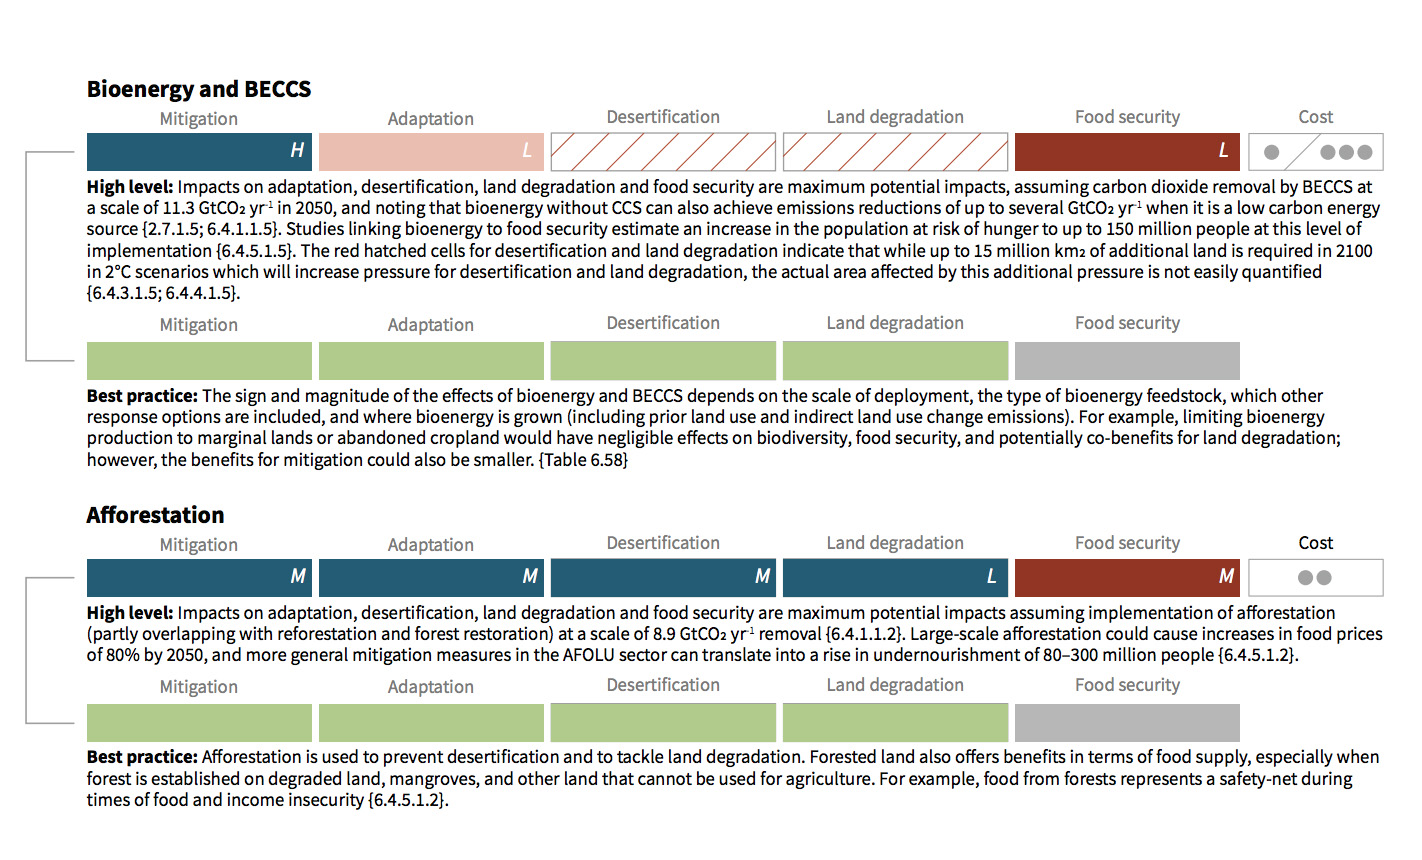
“Applied on a limited share of total land, land-based mitigation measures that displace other land uses have fewer adverse side-effects and can have positive co-benefits for adaptation, desertification, land degradation or food security.”
For both techniques, it is not just the scale of land used that will be important, but also the way in which they are carried out, says Dr Jo House, lead author of chapter two of the land report and a lead researcher of environmental change from the University of Bristol. She tells a press conference for UK journalists:“Many of these options can be sustainable depending on the way that we do them. And, if they are done in an integrated sustainable way they could have many co-benefits. However, if they are done on very, very large areas of land and with monocultures, and on areas of land that are already sensitive to desertification, that could have greater impacts.
“The more area of land that is taken, the more risks there are for food security. But it’s not just about the scale, it is also about the way in which we do things. That’s the really important message: we could do things well or we could do things in a way that increases risks.”
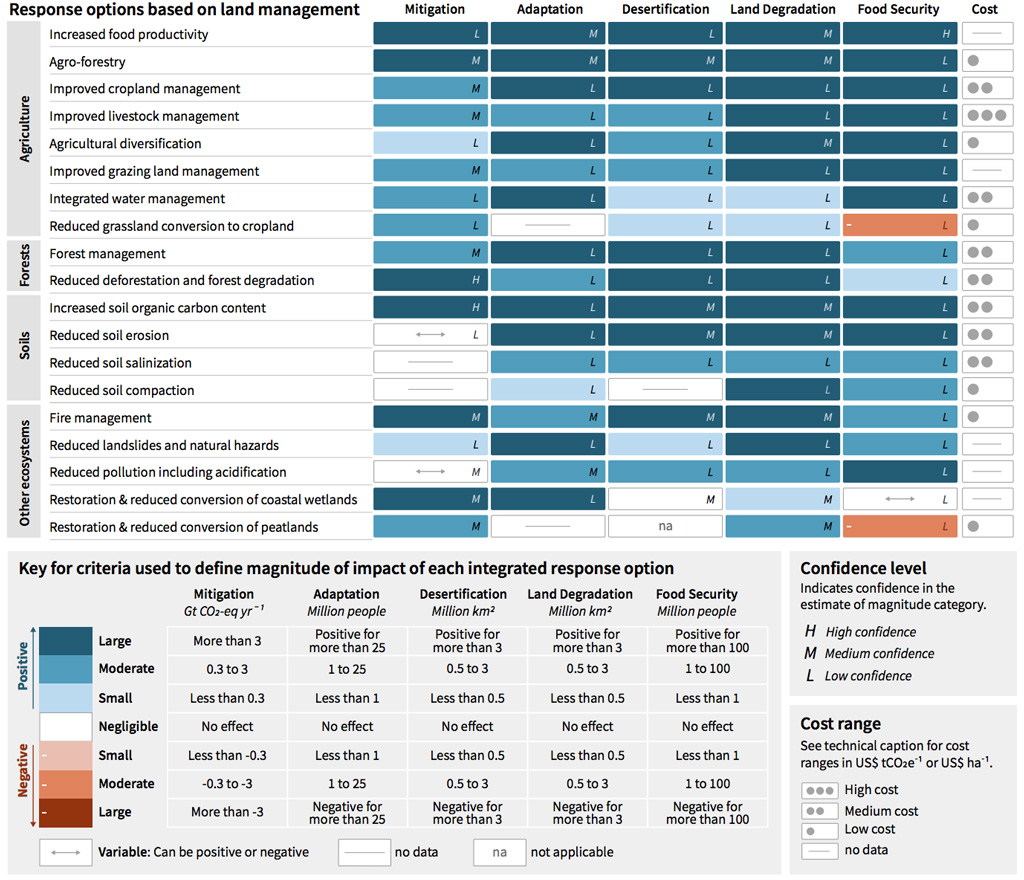
There are also several techniques that could, according to the report, remove large quantities of CO2 from the atmosphere while enhancing food security and protecting against degradation. These include reducing current levels of deforestation and forest degradation and boosting the carbon stores of soils. Many options exist within agriculture to remove large quantities of CO2 while providing co-benefits for the land, the graphic shows. Such techniques, including increasing food productivity, agro-forestry and improving the management of crops and livestock, are mentioned in more detail below under: “How are the issues linked and what solutions exist?” The report emphasises that pursuing an “integrated approach” – involving many different land-based negative emissions techniques, could deliver large CO2 removal while minimising risks to people and wildlife. However, many options for CO2 removal still face large “economic, technological, institutional, socio-cultural, environmental and geophysical barriers”, the report says. If delays to deployment continue, the overall ability of land-based negative emissions to remove CO2 from the atmosphere could start to decrease, says chapter six:“The potential for some land management options decreases as climate change increases; for example, climate alters the sink capacity for soil and vegetation carbon sequestration, reducing the potential for increased soil organic carbon.”
Back to topHow are the issues linked and what solutions exist?
As the report makes clear, climate change, desertification, land degradation and food insecurity are all overlapping challenges that also tie into wider concerns such as water availability and biodiversity. Chapter six of the report draws together the various strands, and considers ways to deal with all of these challenges together. The feasibility of each option is assessed, as well as its vulnerability to future climate change. Strategies to address these issues range from cutting food waste to planting more trees, but each one comes with its own complications, the report notes, often including adverse side-effects that must be taken into consideration. There are also significant regional differences, and the authors note that many of the responses will take time to be effective. It also considers how such “integrated response options” would affect the UN’s sustainable development goals (SDGs) and the concept of nature’s contributions to people (NCP) laid out by the Intergovernmental Platform on Biodiversity and Ecosystem Services (IPBES). In total, the report considers 40 specific responses to the issues. Eight of these options yielded medium to large benefits for all of the land challenges being considered: increased food productivity; improved forest management; reduced deforestation; increased soil organic carbon content; enhanced mineral weathering; dietary changes; reduced post-harvest losses; and reduced food waste. The authors found that “most response options” can be implemented without competing for available land, including improvements to crop management and increasing the carbon content of soils. Others, such as dietary changes and cuts to food waste will actively free up land.
“Some options such as soil carbon management are potentially applicable across a broad range of land use types, whereas the efficacy of land management practices relating to organic soils, peatlands and wetlands, and those linked to freshwater resources, depends on specific agro-ecological conditions.”
Land degradation neutrality [see Carbon Brief’s recent piece on desertification for more on this], is a target with huge benefits but also a major challenge, and one the report says depends on the “integration of multiple responses across local, regional and national scales, multiple sectors including agriculture, pasture, forest and water”. The report concludes that a “suite of coherent climate and land policies” would both advance the goal of the Paris Agreement and the land-related targets of the SDGs, noting that the earlier serious action is taken, the better. However, it also points out that some strategies, such as BECCS, are a long way from being realised on a large scale, while others face significant “policy lags”:“Even some actions that initially seemed like ‘easy wins’ have been challenging to implement, with stalled policies for REDD+ providing clear examples of how response options need sufficient funding, institutional support, local buy-in, and clear metrics for success, among other necessary enabling conditions.”
Back to topWhat does the report say about sustainable development, gender and the role of indigenous communities?
In a similar vein to the 1.5C report, the land report has a heavy emphasis on the links between addressing climate change and ensuring sustainable development. The final chapter of the report (chapter seven) is devoted to how land-based decisions for tackling climate change tie-in with sustainable development. Climate change and land use particularly threaten the world’s poor, the report notes. Future policies for tackling climate change involving the land will need to be carefully designed in order to minimise risks for those living in poverty, the SPM says:“Due to the complexity of challenges and the diversity of actors involved in addressing land challenges, a mix of policies, rather than single policy approaches, can deliver improved results in addressing the complex challenges of sustainable land management and climate change.”
This language mirrors that of the chapter six of the report, which looks at the possible impacts of land-based “negative emissions”. This chapter says that pursuing just one negative emissions technique on a very large scale could come with significant risks for people and wildlife. It also notes some options for large-scale land-based CO2 removal, including bioenergy or BECCS, could come with trade-offs for several of the UN’s sustainable development goals. Among goals that could be negatively affected is goal 15, which aims to “protect, restore and promote sustainable use of terrestrial ecosystems, sustainably manage forests, combat desertification, and halt and reverse land degradation and halt biodiversity loss”. However, several other land-based negative emissions techniques could remove CO2 while providing co-benefits for this goal, the report says. These include avoiding further deforestation, increasing food productivity and boosting the carbon stores of soils. (For more information, see: “How could ‘negative emissions’ impact land, food and wildlife?”) Economic policies for tackling change, too, could be designed in such a way as to minimise the risks to the world’s poor, the SPM says:“Elements of such policy mixes may include weather and health insurance, social protection and adaptive safety nets, contingent finance and reserve funds, universal access to early warning systems combined with effective contingency plans.”
The report notes the importance of attaining greater levels of gender equity in sustainable land-based solutions for tackling climate change. A box on gender on page 87 of chapter seven reads:“Gender is a key axis of social inequality that intersects with other systems of power and marginalisation – including ‘race’, culture, class/socioeconomic status, location, sexuality, and age – to cause unequal experiences of climate change vulnerability and adaptive capacity.”

“Based on indigenous and local knowledge, climate change is affecting food security in drylands, particularly those in Africa, and high mountain regions of Asia and South America.”
Greater involvement of indigenous people in the solutions needed to tackle these impacts is vital, says Victoria Tauli-Corpuz, UN special rapporteur on the rights of indigenous peoples. During a press conference held before the report’s release, she said:“No one knows the conflicts playing out among food, fuel and forests better than indigenous peoples and local communities. We’re often in the crosshairs of conflicts over land, especially forests. As experts, often guided by hundreds of years of knowledge, we are uniquely suited to manage, protect and restore the world’s forests.”
Back to topWhat has the reaction been?
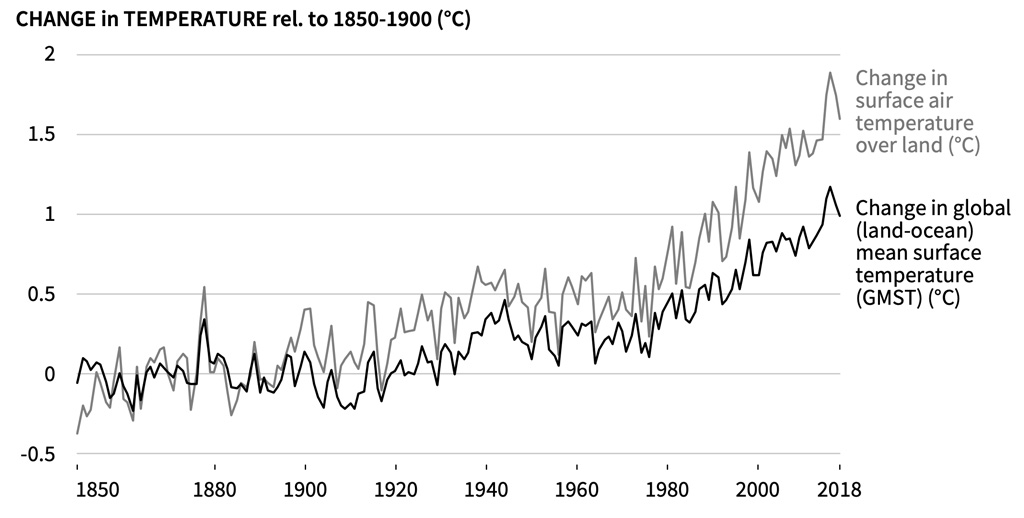
There has been extensive global media coverage of the report. (See Carbon Brief’s media summary in today’s daily briefing newsletter.) Much of the initial news reports focused on the overlapping nature of risks that the report identified. The Guardian says the report warns that “the climate crisis is damaging the ability of the land to sustain humanity, with cascading risks becoming increasingly severe as global temperatures rise”. The Associated Press says the “report examines how global warming and land interact in a vicious cycle. Human-caused climate change is dramatically degrading the land, while the way people use the land is making global warming worse”. A second Guardian article warns the impacts of climate change on land “threaten civilisation”. Food and diets also featured prominently in the coverage. Mother Jones’s coverage says “climate change is taking a bigger toll on our food, water and land than we realised”, while the Straits Times says the world can “feed itself [and] fight climate change if it adopts the right recipe for farming”. Similarly, a New York Times headline says that “climate change threatens the world’s food supply”. BBC News says that according to the report, a shift to “a plant-based diet can help fight climate change”. The Times headline reads: “Eat less meat to save the Earth, urges UN,” with the accompanying article noting that cutting food waste and eating less meat could reduce climate change by saving large areas of land from being “degraded by farming”. Elsewhere, NPR begins its coverage of the IPCC findings by saying: “Humans must drastically alter food production in order to prevent the most catastrophic effects of global warming.” Reuters reports that “farming and eating need to change to curb global warming”, according to the IPCC, with the Washington Post and the Hill taking a similar line. The Financial Times bucks the trend by running its coverage under the headline: “Climate report warns of rising air over land temperatures,” noting that the air over land is warming roughly twice as fast as the global average. With the initial wave of media coverage, numerous NGOs have released statements in response to the IPCC report. It “sends a clear message that the way we currently use land is contributing to climate change, while also undermining its ability to support people and nature”, says Stephen Cornelius, chief advisor on climate change and IPCC lead at WWF:“We need to see an urgent transformation in our land use. Priorities include protecting and restoring natural ecosystems and moving to sustainable food production and consumption.”
The report “shows that ramping up action in line with the goal to keep temperature rise to 1.5C is crucial to avoid massive disruption to our food chains”, says Wendel Trio, director of Climate Action Network (CAN) Europe:“Already now many farmers in Europe lose their production and revenue due to frequent droughts, floods, heat waves and wildfires. Some of them cannot adapt anymore.”
A number of NGOs pick up on what the report says about using the land to absorb and store greater amounts of carbon. Martin Harper, RSPB director of conservation, says:“Nature-based solutions offer the opportunity to not only restore the natural riches of the world but to also slam the brakes on climate change.”
A particular focus for NGOs is the need to balance competing demands for land. As Christian Aid’s global climate lead Dr Katherine Kramer puts it:“Today’s report is a clarion call for the need for us to manage land better for people, nature and the climate. There are many opportunities to create win-wins in the ways we use the land, but it’s vital we implement these quickly to avoid having to make bleak choices between feeding people and reducing emissions.”
Other NGOs are more frank in their assessment of what the report says about negative emissions techniques. Teresa Anderson, ActionAid’s climate policy coordinator, says:“It sends a stark warning that relying on harmful technologies such as bioenergy with carbon capture and storage, which would take up huge amounts of land, are at odds with our need to improve food security and protect our natural ecosystems.
“Rich, polluting countries cannot expect the Global South to give away swathes of farmland to clean up the climate mess.”
And Peg Putt, ecosystems coordinator at Climate Action Network, describes BECCS as an “enormous threat to ecosystems, people, and food security”, adding:“As we clearly cannot afford to lose or destroy ecosystems vital to life, the report effectively paints large scale bioenergy and BECCS as completely unacceptable and unworkable.”
Mahir Ilgaz, research and grants coordinator at 350.org, also cautions that “false solutions to the climate crisis will add even more pressure to our ailing land and biodiversity systems”. Ilgaz says:“We will need to pursue options that do not force people off their lands and do not swap biodiversity with more monocultures and industrial agriculture.”
Linde Zuidema, bioenergy campaigner at Fern, says the report “calls on governments to phase-out harmful subsidies that drive deforestation and forest degradation”. Zuidema adds:“This means the EU should phase out subsidies for bioenergy and focus instead on promoting protection and restoration of forests – which has proven to be positive for nature and people.”
In contrast, Will Gardiner – chief executive of the Drax Group, which has gradually been converting its coal-fired power station at Drax to burn wood pellets – argues that the report confirms that “BECCS is an essential technology in tackling the climate emergency the world is facing”. Some scientific institutions and their lead researchers have also put out statements in response to the report. Prof Johan Rockström, director of the Potsdam Institute for Climate Impacts Research (PIK), says:“The IPCC report on land confirms that we are facing a planetary emergency, that the window for taking decisive action is closing fast and that the costs of inaction will be catastrophic. While the report paints a bleak picture of what could come to pass, it also points a way forward, including opportunities for immediate action.”
Prof Sabine Fuss from the Mercator Research Institute on Global Commons and Climate Change warns that “if the rapid transition in agriculture, which accounts for about a fifth of all greenhouse gas emissions, does not succeed, it may result in serious land use competition”. She adds:“At that point, carbon will have to be removed from the atmosphere at large scale, for example through reforestation or cultivation of biomass for bioenergy, which could come at the expense of sufficient food supplies or conserving natural biodiversity.”
Prof Piers Forster, professor of climate change at the University of Leeds, strikes a similar tone. The report “shows that to limit temperature change below 1.5C, we need to substantially change the way we use our land”, he says:“In a nutshell we need less pasture and more trees, but really it means thinking much harder about how we use every acre of land. Land needs to grow our food, provide biodiversity and freshwater, give work to billions of people, and suck up billions of tonnes of carbon.”
And Prof Corinne Le Quéré, Royal Society professor of climate change science at the University of East Anglia and member of the UK’s Committee on Climate Change (CCC) says the “IPCC’s findings chime with our [the CCC’s] advice to government”:“The UK needs to reduce food waste, promote healthy diets, and use land sustainably, including planting more trees and restoring degraded soils. All of these steps will help to improve people’s lives whilst reducing the harmful emissions which cause climate change.”
Back to topArticle information
Update: This article was updated on 20/08/2019 to clarify that the risks presented in Figure SPM.2 are the impacts/risks from different types of land degradation in a warming climate on various societal systems, rather than risks to those forms of degradation.