
Guest post: Why low-end ‘climate sensitivity’ can now be ruled out
Multiple Authors
07.22.20Multiple Authors
22.07.2020 | 3:24pmAfter four years of labour and detailed discussions by an international team of scientists, we are able to quantify better than ever before how the world’s surface temperature responds to increasing CO2 levels.
Our findings, published in Reviews of Geophysics, narrow the likely range in “equilibrium climate sensitivity” (ECS) – a measure of how much the world can be expected to warm for a doubling of CO2 above pre-industrial levels.
Constraining ECS has remained a holy grail in climate science ever since US meteorologist Jule Charney suggested a possible range of 1.5C to 4.5C in his 1979 report. His estimate was largely based on the world’s first two global climate models, which gave different estimates of 2C and 4C when they performed a simple experiment where atmospheric CO2 levels were doubled.
Since then, despite more than 40 years of research, much improved understanding of atmospheric processes, as well as many more detailed observations, this range has stubbornly persisted.
Now, bringing together evidence from observed warming, Earth’s distant past and climate models, as well as advances in our scientific understanding of the climate, our findings suggest that the range of ECS is likely to be between 2.6C and 4.1C.
This narrowed range indicates that human society will not be able to rely on a low sensitivity to give us more time to tackle climate change. But the silver lining to this cloud is that our findings also suggest that very high ECS estimates are unlikely.
Stubbornly wide range
How sensitive the Earth’s climate is to increasing atmospheric CO2 is a fundamental question for climate science. It essentially dictates how much the Earth’s surface will warm in response to human-caused CO2 emissions.
Concentrations of CO2 in the atmosphere have increased from pre-industrial levels of 280 parts per million (ppm) to around 416ppm today. Without actions to reduce emissions, concentrations are likely to reach 560ppm – double pre-industrial levels – around the year 2060.
However, the estimated range for ECS has remained stubbornly wide. The Intergovernmental Panel on Climate Change (IPCC) fourth assessment report (AR4), published in 2007, concluded that ECS was likely – in IPCC language this means a >66% chance – between 2.0C and 4.5C. This suggested that estimates lower than 2C were unlikely and finally indicated that some progress was being made.
However, this improvement was reversed in the IPCC’s fifth assessment report (AR5) in 2013, which reverted to the canonical 1.5C to 4.5C range for its likely estimate.
Why the reversal? Since the 2000s, estimates of ECS were not just coming from climate models, they were being estimated from studies of past climate (“palaeoclimatology”), from interpretations based on historical observations of temperature change, as well as from studies of the underlying climate feedback processes.
At the time when the AR5 report was being written, the historically based estimates were coming out with best estimates of ECS around 2C. In contrast, estimates from process understanding and modelling supported the upper end of the Charney range. While the ranges overlapped, this divergence between estimates based on observed climate change on the one hand and understanding and modelling of the processes that govern climate sensitivity on the other was worrying.
Since 2013 there has been a concerted effort by scientists to understand the technical details of why estimates differ and to take the first tentative steps towards reconciling the disparate estimates from different lines of evidence.
Our new study illustrates this improved understanding of how different, independent lines of evidence relate to each other and allows them to be formally combined to place stronger constraints on ECS than in any previous overall assessment.
Likely range
Our research suggests that the likely ECS range is 2.6C to 4.1C, with a best estimate of slightly above 3C. Outside this range, we find a less-than-5% chance that ECS is below 2C and a 6-18% chance it is above 4.5C.
We also produced an estimate for “effective climate sensitivity” – a slightly different measure from ECS – of 2.6 to 3.9C. (ECS is a warming estimate once the climate has reached equilibrium after CO2 levels are doubled. This is sometimes impractical to assess and simulate because the climate can take thousands of years to truly reach equilibrium. Effective climate sensitivity is a common workaround, which typically extrapolates the warming 150 years after a doubling of CO2.)
At first glance, this may not seem like a massive improvement over the last IPCC report, but, in fact, it has important implications for the understanding of climate science and for our confidence in the projected range of 21st century warming.
The chart below shows how the likely ECS range from our study (black and grey boxes), compares with AR5 (blue) and the full range of estimates from the fifth (yellow) and sixth (orange) coupled model intercomparison projects (CMIP). (The CMIP5 model projections fed into AR5, while CMIP6 will underpin the forthcoming sixth assessment report, AR6.)
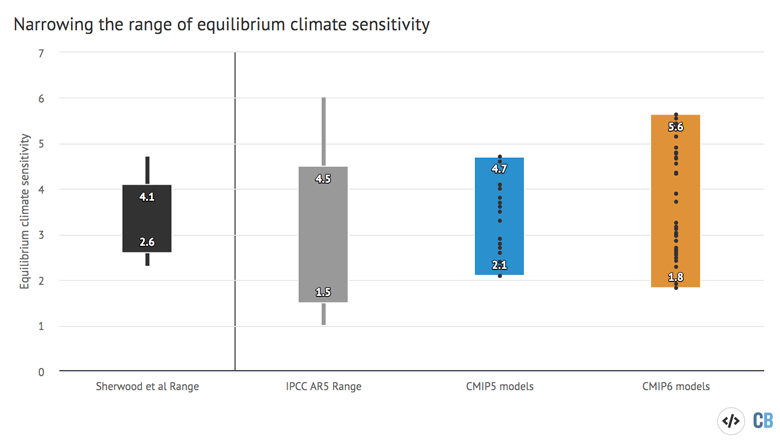
Range of ECS from the new study for both the base (black) and robust (grey, showing effective sensitivity) results, the last IPCC assessment report (AR5, blue), the last generation of climate models (CMIP5, yellow), and the new CMIP6 climate models (orange). For Sherwood et al and the AR5, the likely climate sensitivity (66% range) is shown by the thick bars while the very likely sensitivity (90% range) is shown by the thin bars. Chart by Carbon Brief using Highcharts.
Our study produces a narrower range by first determining and explaining how each line of evidence is able to place limits – or not place limits – on the likely ECS. We scrutinised three different lines of evidence: understanding of feedback processes; the historical observations of temperature change; and palaeoclimate reconstructions of past climate changes.
Second, our work formally combines all three estimates, producing a central estimate of ECS of slightly higher than 3C. It also provides additional constraints on the range of ECS: giving a 90% chance that estimates are between 2.3C and 4.7C. Leaving out any one of the lines of evidence or using a different statistical approach gives a “robust” effective sensitivity estimate of between 2.0C and 5.7C.
These constraints mean that we are now able to compare this range to estimates from climate models, which were not used as a direct line of evidence themselves. Where some climate models have a high ECS compared to our range, they would be expected to overestimate future warming levels under a given emission pathway. Likewise, if low compared to our range, they may well underestimate future warming.
Combining lines of evidence
Feedback processes are an important factor in how the Earth responds to rising CO2 levels. There are both positive feedbacks – those that reinforce warming – and negative ones – those that dampen warming. An example of a positive feedback is when warming melts ice and snow meaning that less sunlight is reflected and more is absorbed, thus causing more warming.
We examined evidence from observations, theory, detailed simulations and climate models. Our analysis showed that ECS estimates below 2C would require clouds to have a negative feedback on global warming, which we found to be very unlikely. Therefore, this evidence alone could rule out estimates of ECS lower than 1.5C.
The observed warming to date is a further line of evidence. We have already experienced around 1C of warming without yet doubling CO2 concentrations. This finding makes ECS values of less than 2C very unlikely. However, a good estimate of ECS from historical evidence is hampered by the difficulties in quantifying the cooling effect of aerosols – from air pollution and volcanoes – and the realisation that feedback processes may have operated differently over recent decades than they are expected to operate in the longer term. This makes it extremely difficult to rule out high values of ECS from historical data alone.
Palaeoclimate is the third line of evidence we examine. Climate change which occurred naturally in Earth’s distant past can also help constrain ECS if enough information is available. We found that the two most informative periods were the last glacial maximum (around 20,000 years ago) which was about 3C to 7C colder than today and a mid-Pliocene period of warmth (around 1C to 3C warmer than today), which occurred roughly three million years ago. The limits on cooling during the last glacial maximum give the best single evidence that high ECS values are unlikely.
These constraints on ECS become more robust when the lines of evidence are treated together, enabling the combined evidence to begin to rule out high and low ECS values…
Ruling out high ECS values: If the true ECS value were more than 4.5C, cloud feedbacks would need to be much more amplifying than suggested by satellite data. Future feedbacks would also need to be much more amplifying than they have been over the historical period. Furthermore, changes in the Earth’s ice sheets and the deposition of dust in the dry conditions of the last glacial maximum would need to have been severely overestimated.
Ruling out low ECS values: If the true ECS value were less than 1.5C, an unanticipated new strongly cooling cloud feedback process would need to be discovered. Also aerosols would need to have contributed a near-zero cooling effect or even a warming effect on climate over the historical period. Furthermore, the warming estimated during the mid-Pliocene would need to have been overestimated.
We considered the likelihood of all lines of evidence being wrong by performing a suite of statistical tests. Our tests also evaluated the dependence on particular pieces of evidence. These tests enabled us to settle on the final range of ECS presented in the paper, but only after a lot of maths and videoconferencing discussions.
The chart below shows the results for each line of evidence in isolation, with each box indicating the 50% likelihood range in effective climate sensitivity.
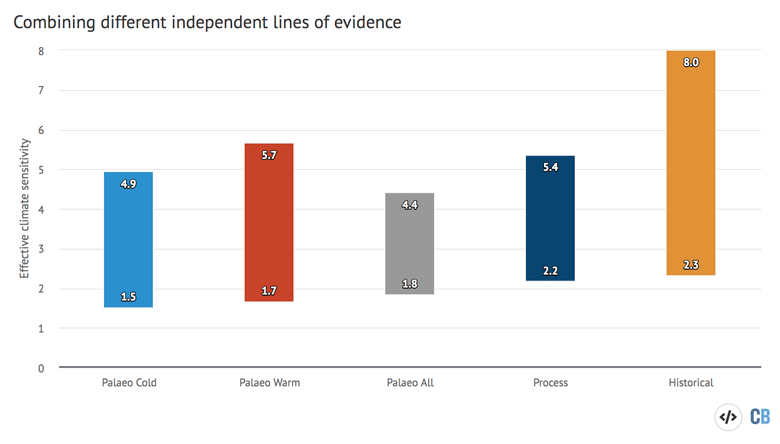
The 50% likelihood range of effective climate sensitivity calculated from each line of evidence independently. Note that the upper bound of the historical-only estimate is poorly constrained and is >8C. Chart by Carbon Brief using Highcharts, based on Figure 20 in Sherwood et al. (2020).
Comparison with models
The earlier figure in this article showed that some CMIP6 models are outside the ECS ranges given in the paper, both at the high and low ends.
Our work suggests that models with an ECS outside of our range are unlikely to be representative of the true ECS and can, therefore, be expected to either overestimate or underestimate future temperature change.
However, our study is not definitive and there is still space in the statistics for values at the high end of ECS, in particular, as this is less well constrained than our lower end. Therefore, our work cannot definitively rule out these high-end models.
Further, other studies have found that in many ways simulations with high ECS values are improved. Therefore, it remains a useful precautionary measure to include these high ECS models when assessing future risks.
Sherwood, S. et al. (2020) An assessment of Earth’s climate sensitivity using multiple lines of evidence, Reviews of Geophysics doi.org/10.1029/2019RG000678
-
Guest post: Why low-end 'climate sensitivity' can now be ruled out
-
Guest post: Narrowing the range of ‘climate sensitivity’