Guest post: Why climate change will cause more ‘strong’ Indian Ocean Dipole events

Guest authors
11.30.20Guest authors
30.11.2020 | 4:00pmIn its late spring and summer of 2019-20, Australia experienced one of its most devastating bushfire seasons on record. Now known as the “black summer”, the burning of more than 18m hectares caused billions of dollars in economic damage.
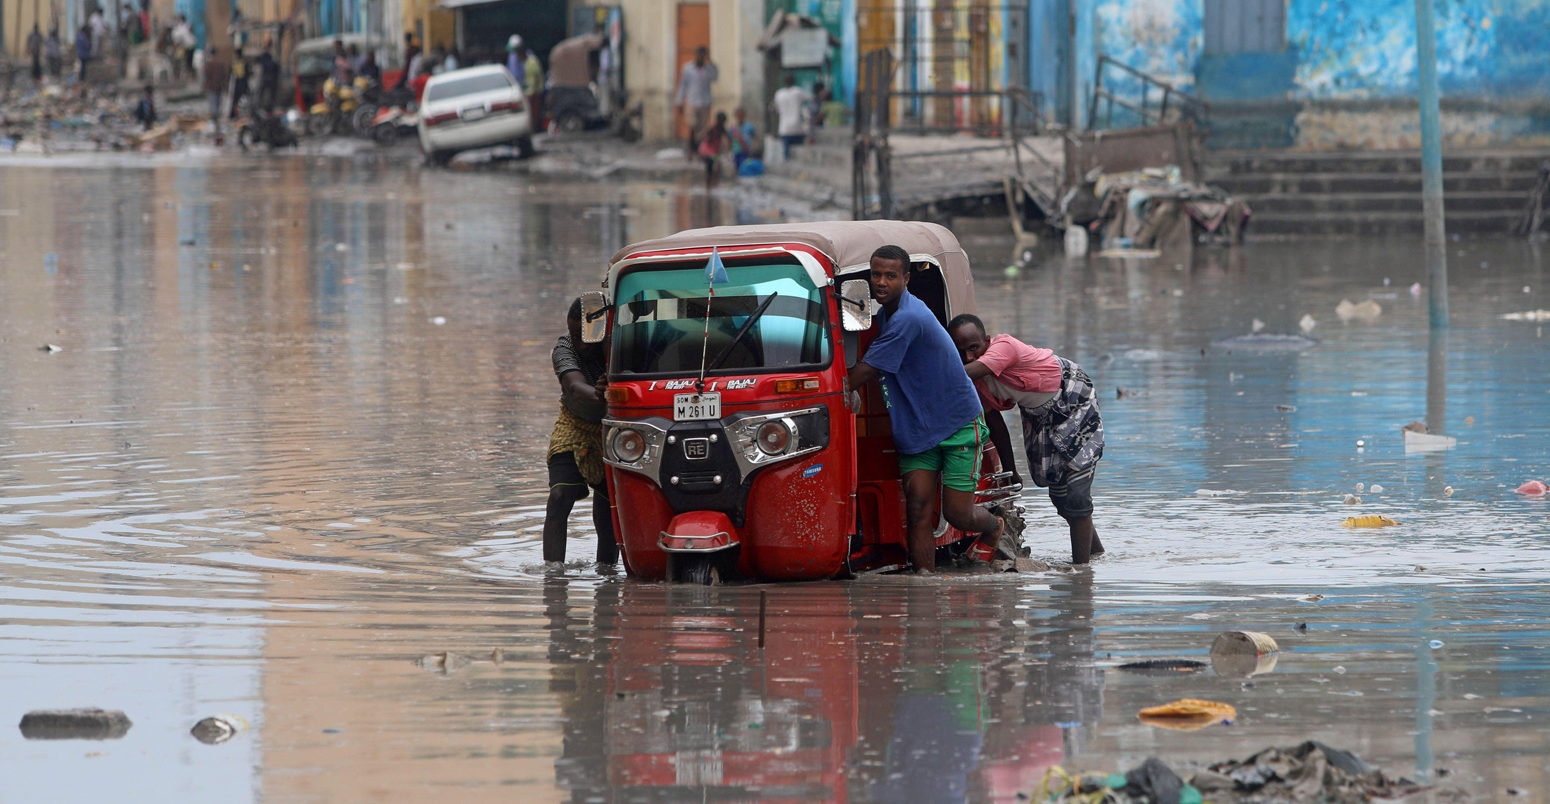
Whilst Australia was experiencing drier-than-normal conditions, East Africa and India received widespread heavy rainfall. This caused landslides, displaced hundreds of thousands of people and contributed to exponential growth in locusts. This plague affected several countries and caused tens of millions of peoples to face severe food insecurity.
The bushfires and locust plagues may appear to be unconnected at first glance, but they are both linked to a contributing factor – a climate phenomenon known as the Indian ocean dipole (IOD).
The IOD – sometimes referred to as a “neighbour” of the El Nino-Southern Oscillation – describes a periodic shift in sea surface temperatures in opposite sides of the Indian Ocean.
In a new study, published in Nature Climate Change, we show that strong “positive” IOD events – similar to the one seen in 2019 – are projected to increase in a warmer climate.
Indian ocean dipole
The IOD was first identified in a paper published in Nature in 1999. The authors described how the phenomenon had positive, neutral and negative phases, which they quantified using a “Dipole Mode Index” (DMI). This “dipole” is calculated according to the difference in sea surface temperatures (SSTs) between two “poles” located in the western and eastern Indian Ocean.
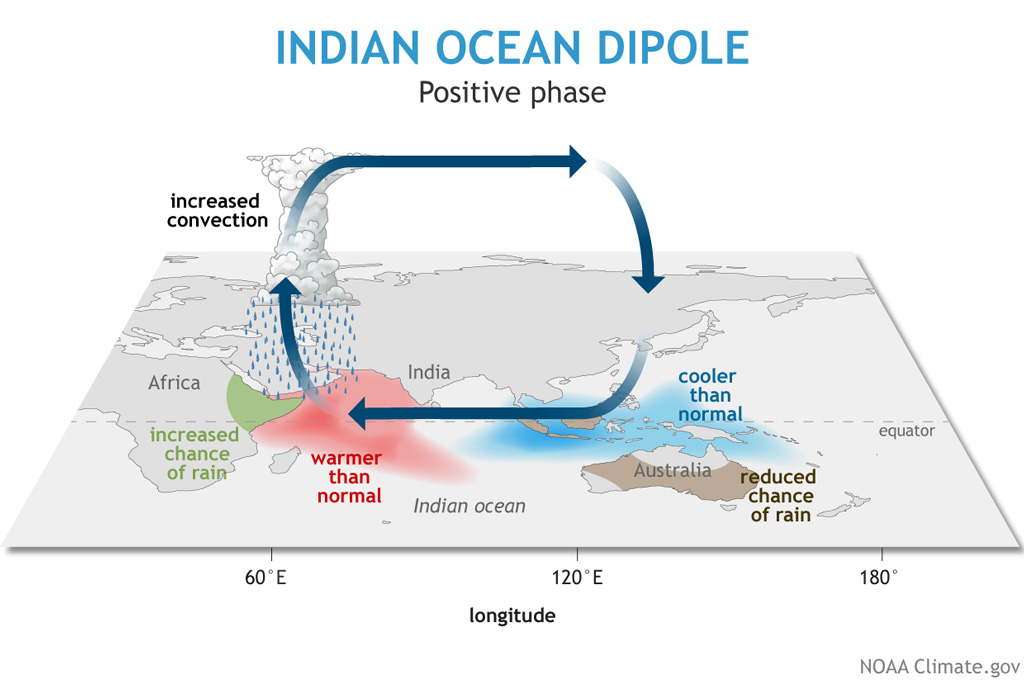
Illustrated in the graphic below, a positive IOD event is associated with unusually warm SSTs in the equatorial western Indian Ocean and unusually cold SSTs in the east. During positive IOD events, these cold SSTs lead to reduced evaporation and drier-than-normal conditions over south-eastern Australia.
At the same time, the warm SSTs in the western Indian Ocean bring increased rainfall over parts of East Africa and India.
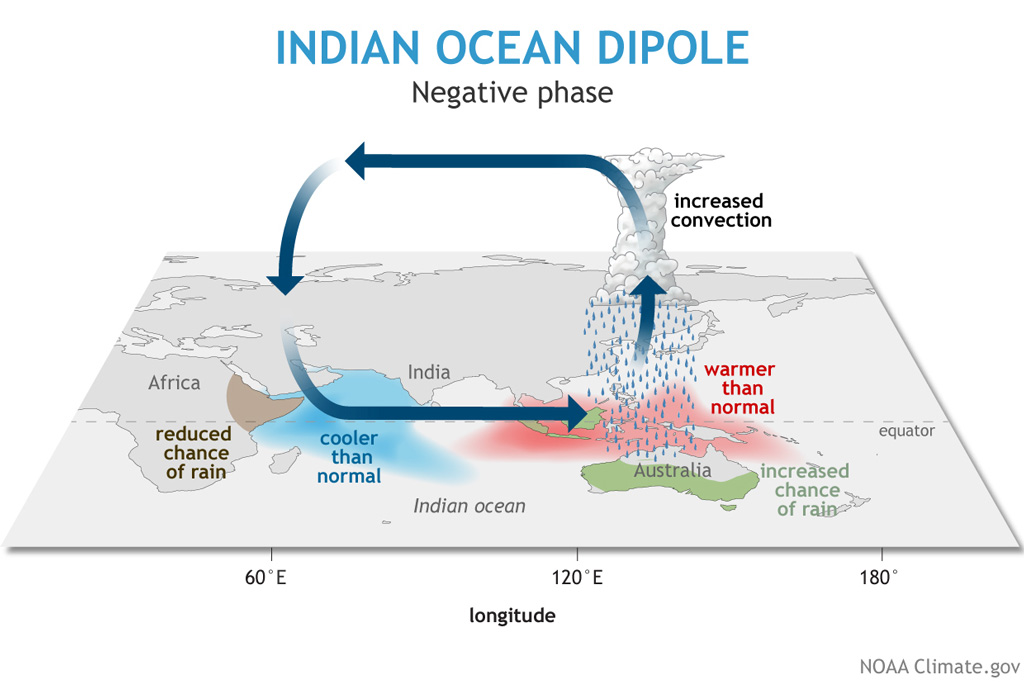
Negative IOD events – shown below – are the opposite, with cool SSTs in the west and warmer-than-normal SSTs in the east. Similarly, their impacts on the surrounding countries are reversed, with Australia experiencing wetter-than-normal conditions during southern hemisphere spring whilst East Africa and India are drier than usual.
However, negative IOD events tend to be weaker than positive events and the associated impacts are generally less severe.
New indices
While the IOD is a naturally occurring phenomenon in the Earth’s climate, that does not mean it will not be affected by human-caused warming. And considering the potential impacts of a strong event, understanding how the IOD will respond to a warmer climate is of the utmost importance.
However, this task is made more difficult because, when analysed using the conventional DMI, climate models tend to disagree on how the IOD will respond to climate change.
Using the DMI assumes that there is little pattern diversity between positive IOD events – such as whether an event is a strong or moderate one – and that the simulated SST pattern of positive events is located over the same regions as observations.
But research has shown that IOD events display particular “flavours” that need to be taken into account. Therefore, to capture positive IOD diversity in models more accurately, we developed two separate indices – an “S-index” to represent strong events and an “M-index” for moderate ones.
By using these two indices, each model can express its own patterns of positive events, which allows us to investigate them in more detail.
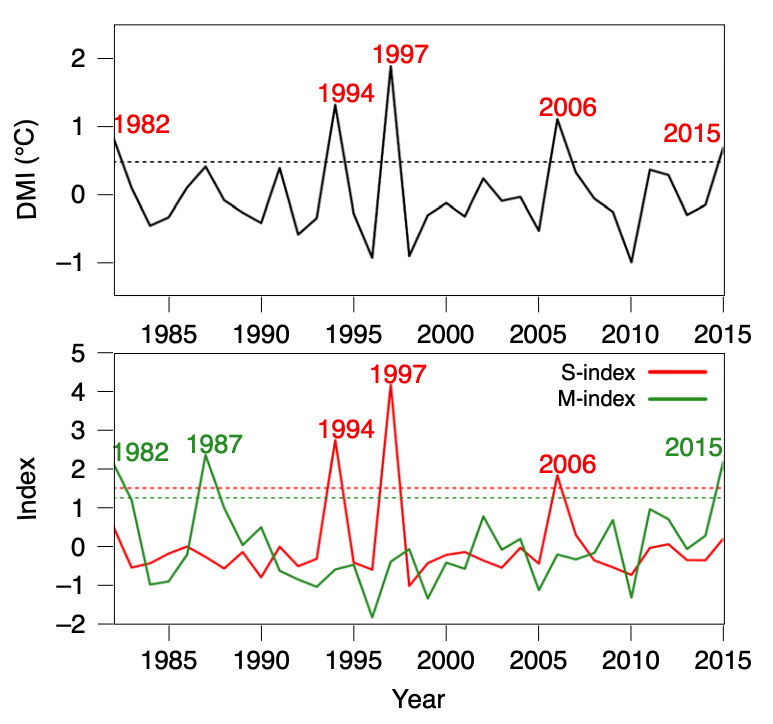
You can see a comparison for 1982-2015 below. The upper chart shows the standard DMI, with key positive events in 1982, 1994, 1997, 2006 and 2015.
The lower chart shows the S-index (red line) and M-index (green) for the same period. Here, the S-index identifies the strong events in 1994, 1997 and 2006, whilst the M-index captures prominent moderate ones in 1982, 1987, and 2015.
Changing variability and frequency
Using 20 climate models, we then compared the variability of the S-index and M-index between the present-day (1900-99) and the future (2000-99) under the SSP5–8.5 very high emissions scenario.
We found that there is an opposite response between moderate and strong positive IOD events in our model simulations. Eighteen out of the 20 models simulate a decrease in M-index variability, whilst 17 out of 20 models generate an increase in S-index variability.
Looking at the average change across all the modes, we find a statistically significant decrease of 16% for moderate event variability and a 22% increase for strong events. In contrast, the DMI shows no statistically significant change in the model average.
The decrease in M-index variability translates to a 52% reduction in the frequency of moderate events in a warmer climate. The increase in S-index variability translates to a 66% increase in strong events.
This would mean the frequency of strong events rising from one event every 13 years in the present-day climate to one event every eight years in the future.
These projections are much more consistent across the models than for the DMI – with around 80-85% of models supporting these findings. And the direction of change is similar for model runs using a moderate emissions scenario (RCP4.5) too.
Driving forces
So what’s the cause of this opposite response?
First, although there is a relationship between the IOD and ENSO, we find that the projected changes are not caused by shifts in ENSO.
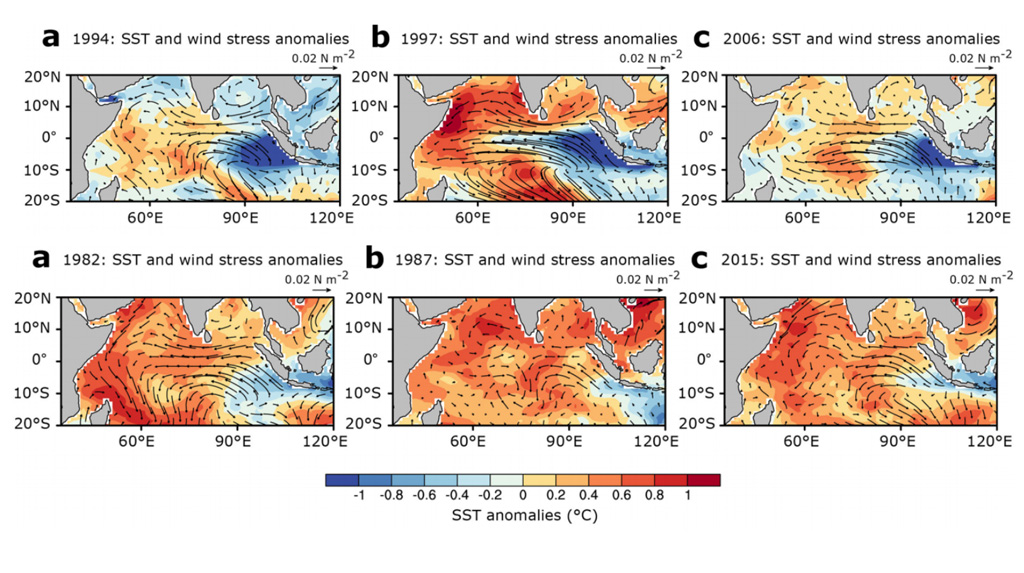
Second, we need to look at the differences in patterns between the moderate and strong positive IOD events. This can been seen in the figures below. The upper set of maps shows how SSTs and winds in autumn differ from usual during strong events (showing 1994, 1997 and 2006 as examples), while the lower set shows the equivalent for the moderate events in 1982, 1987 and 2005.
In general, strong events are dominated by cooling (blue shading) in the eastern equatorial Indian Ocean, whilst moderate events see broadscale warming (red shading) across the western Indian Ocean.
Our model projections indicate that the contrasting changes in positive IOD events occur as a result of the different pace of warming across the tropical Indian Ocean.
For example, the western and northern regions of the Indian Ocean are projected to warm faster than eastern and southern parts. This is supported by stronger seasonal southeasterly winds and increased evaporation in the west. You can see this in the maps of SSTs (left) and winds (right) below.
We also find that the lowest layer of the atmosphere – the troposphere – warms faster than the Earth’s surface. This makes the atmosphere more stable – as it suppresses the rising of warm air, known as convection. In turn, this weakens the response of seasonal equatorial easterly winds to SST anomalies.
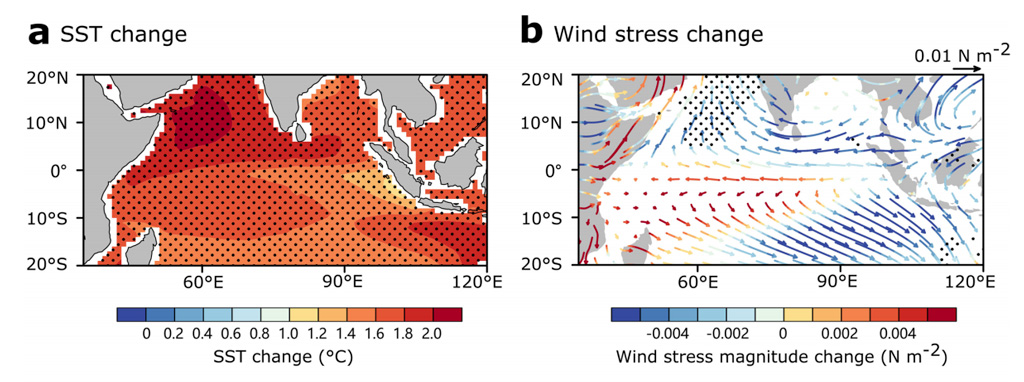
These changing wind patterns weaken processes that bring warm SSTs to the tropical western Indian Ocean. This weakening in the future climate leads to decreased variability in moderate events.
But, for strong events, the faster average warming in the west and northwest tropical Indian Ocean provides favourable conditions for convection. In turn, this strengthens easterly winds along the equator that extend from the central to western Indian Ocean (see arrows in the winds map above). And this allows cooler water to come to the surface in the eastern Indian Ocean – a feature of strong events.
Therefore, although there is a decrease in moderate positive IOD events, strong events similar to 1997 and 2019 are expected to occur more frequently in a warmer climate.
Cai, W. et al. (2020) Opposite response of strong and moderate positive Indian Ocean Dipole to global warming, Nature Climate Change, doi:10.1038/s41558-020-00943-1
-
Guest post: Why climate change will cause more ‘strong’ Indian Ocean Dipole events
-
How the Indian Ocean Dipole could change under human-caused warming