Explainer: What the new IPCC report says about extreme weather and climate change
Robert McSweeney
08.10.21Robert McSweeney
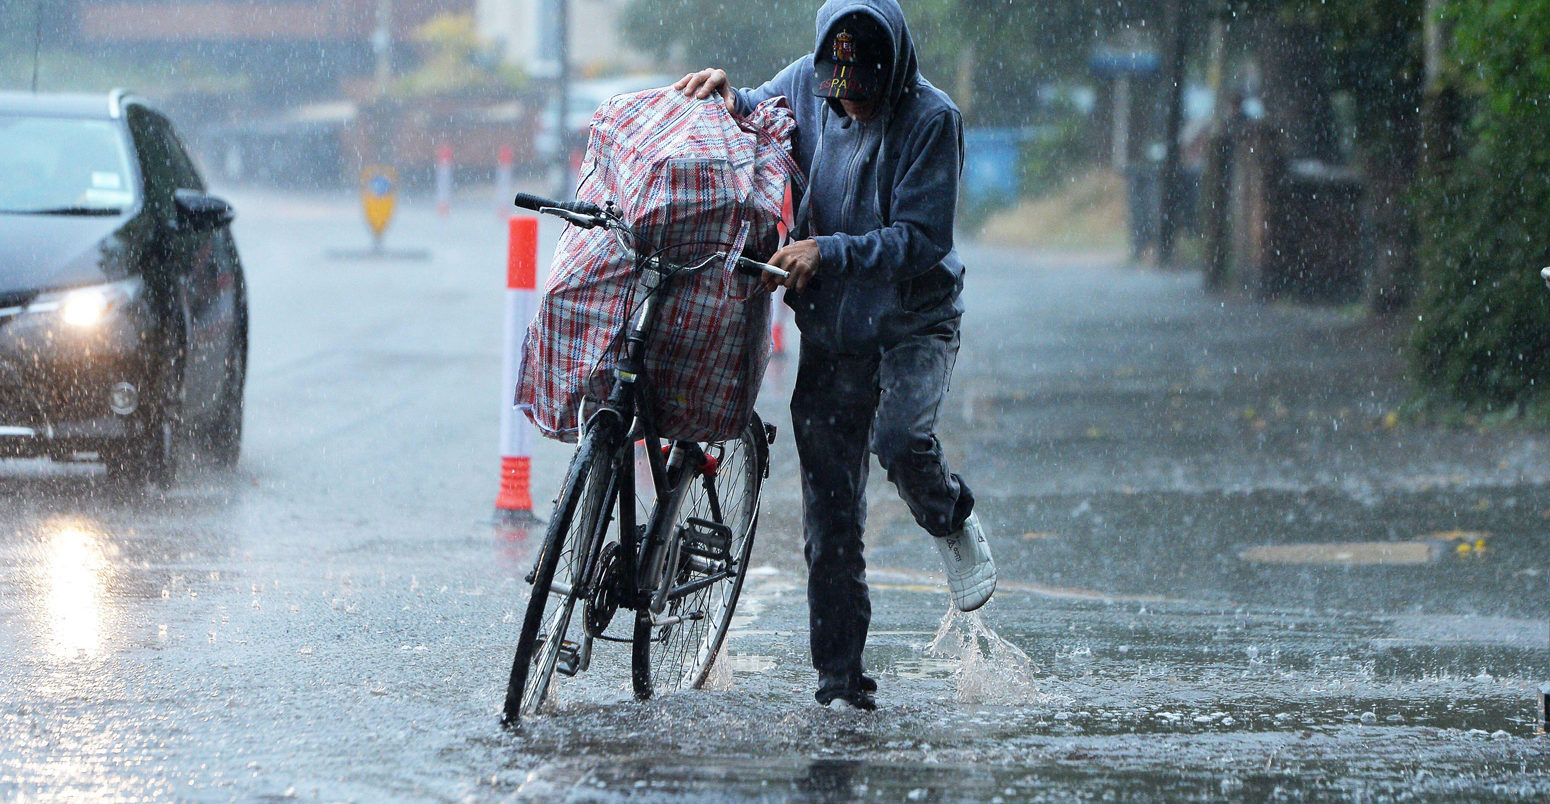
10.08.2021 | 2:03pmThe new report from the Intergovernmental Panel on Climate Change (IPCC) on the science of climate change lands in the aftermath of a series of deadly extreme weather events around the world.
From the record-breaking “heat dome” in the Pacific north-west and the wildfires that followed, to the catastrophic flooding in Europe and China and rainfall-induced landslides in India, extreme weather has frequently hit the headlines in 2021.
-
WG1
- In-depth Q&A: The IPCC’s sixth assessment report on climate science
- Scientists react: What are the key new insights from the IPCC’s WG1 report? WG2
- In-depth Q&A: The IPCC’s sixth assessment on how climate change impacts the world
- Scientists react: What are the key new insights from the IPCC’s WG2 report? WG3
- In-depth Q&A: The IPCC’s sixth assessment on how to tackle climate change
- Scientists react: What are the key new insights from the IPCC’s WG3 report?
It is fitting, then, that the mammoth document – which forms the working group one (WG1) section of the IPCC’s sixth assessment report (AR6) – includes a dedicated chapter on weather extremes for the first time.
The chapter “assesses changes in weather and climate extremes on regional and global scales, including observed changes and their attribution, as well as projected changes”, the report says.
Among its key conclusions is that it is an “established fact” that human-caused greenhouse gas emissions have “led to an increased frequency and/or intensity of some weather and climate extremes since pre-industrial times”.
It adds that the latest scientific evidence strengthens the verdict of the IPCC’s 2018 special report on 1.5C of warming that “even relatively small incremental increases in global warming (+0.5C) cause statistically significant changes in extremes on the global scale and for large regions”.
In this explainer, Carbon Brief draws out what the reports says on different categories of extremes and how they are – and will be – influenced by a warming climate.
- Framing: It is an “established fact” that human-caused emissions of greenhouse gases “have led to an increased frequency and/or intensity of some weather and climate extremes”.
- Attribution: How it has “emerged as a growing field of climate research with an increasing body of literature”.
- Heat: It is virtually certain that “there has been increases in the intensity and duration of heatwaves and in the number of heatwave days at the global scale”.
- Heavy rainfall: The frequency and intensity of heavy rainfall events “have likely increased at the global scale over a majority of land regions”.
- Flooding: Models project “a larger fraction of land areas to be affected by an increase in river floods than by a decrease in river floods”.
- Drought: “More regions are affected by increases in agricultural and ecological droughts with increasing global warming”.
- Tropical cyclones: “It is likely that the proportion of major TC intensities and the frequency of rapid intensification events have both increased globally over the past 40 years.”
- Compound events: “Compound hot and dry conditions become more probable in nearly all land regions as global mean temperature increases.”
- Summary tables: Two tables provided by the IPCC that synthesise the observed changes in extremes and contribution by human influences, and projections under 1.5C, 2C and 4C of warming.
Framing
The report defines an extreme weather event as one “that is rare at a particular place and time of year”. It says an extreme climate event is “a pattern of extreme weather that persists for some time, such as a season”.
-
WG1
- Media reaction: IPCC’s new climate science report and what it means for the world
- Analysis: What the new IPCC report says about when world may pass 1.5C and 2C
- Explainer: What the new IPCC report says about extreme weather and climate change
- IPCC: How the AR6 WG1 summary for policymakers compares to its predecessor WG3
- Analysis: What the new IPCC report says about how to limit warming to 1.5C or 2C
- Guest post: How not to interpret the emissions scenarios in the IPCC report
- Guest post: Why estimates of the ‘cost’ of climate action are overly pessimistic
The dedicated chapter on extreme events covers “temperature extremes, heavy precipitation and pluvial floods, river floods, droughts, storms (including tropical cyclones), as well as compound events”. The last of these describes a situation where two or more weather events – not necessarily extreme by themselves – occur together or in succession, leading to more severe impacts.
(The report’s chapter on regional impacts of climate change also provides information on climate extremes – specifically for risk assessments. For more on that chapter, see Carbon Brief’s in-depth Q&A for the whole report.)
Since the IPCC’s fifth assessment report (AR5) was published in 2013-14, “there have been important new developments and knowledge advances on changes in weather and climate extremes”, the new report says. In particular, these cover “human influence on individual extreme events, on changes in droughts, tropical cyclones and compound events, and on projections at different global warming levels”.
The AR5 report, for example, concluded (pdf) that “it is very likely that anthropogenic forcing has contributed to the observed changes in the frequency and intensity of daily temperature extremes on the global scale since the mid-20th century”.
The “very likely” statement is part of the set of “calibrated language” that IPCC reports use to communicate levels of certainty behind the statements it includes. The set of terms are shown in the table below. They are shown in italics in the report and in this article, too.
| Table 1. Likelihood Scale | |
|---|---|
| Term* | Likelihood of the Outcome |
| Virtually certain | 99-100% probability |
| Very likely | 90-100% probability |
| Likely | 66-100% probability |
| About as likely as not | 33-66% probability |
| Unlikely | 0-33% probability |
| Very unlikely | 0-10% probability |
| Exceptionally unlikely | 0-1% probability |
For AR6, the report concludes that it is an “established fact” that human-caused emissions of greenhouse gases “have led to an increased frequency and/or intensity of some weather and climate extremes”.
The term “established fact” is not one of the “likelihood statements” in the table above. As the IPCC explains in its guidance, “in some cases, it may be appropriate to describe findings for which evidence and understanding are overwhelming as statements of fact without using uncertainty qualifiers”.
IPCC reports also use specific terminology to describe the level of confidence behind individual statements, which combines assessments of evidence and agreement. The overall level of confidence is expressed using the five qualifiers of very low, low, medium, high and very high.
As well as considering observed changes, the report includes projections of future changes in extremes, according to different levels of global warming. These encompass scenarios “compatible with the aim of the Paris Agreement (+1.5C), a scenario slightly overshooting the aims of the Paris Agreement (+2C), and a ‘worst-case’ scenario with no mitigation (+4C)”, the report explains.
It is worth noting that the chapter includes summary tables of observed and projected changes – with uncertainties – for different types of extremes for each of the 46 AR6 land “regions” around the world.
These “large tables”, as the report calls them, take up more than 100 pages of the report, which itself runs to more than 300 pages in total. The chapter is the longest in the report.
Attribution
Since the publication of AR5, “attribution science” has “emerged as a growing field of climate research with an increasing body of literature”, the AR6 report says. These studies assess whether – and to what extent – human-caused climate change and other drivers have affected the frequency and/or intensity of extreme weather events.
Attribution research has shown that, for example, climate change made Europe’s record-breaking heatwave in 2019 as much as 100-times more likely and also tripled the chances of the record rainfall that Hurricane Harvey dumped on Texas in 2017.
The geographical spread of these studies is “uneven”, the AR6 report says, with fewer carried out in the developing world. There are various reasons for this, including “a lack of observational data, lack of reliable climate models and other problems”.
Nonetheless, the authors say, the large number of event-attribution studies “provide evidence that changes in the properties of these local and individual events are in line with expected consequences of human influence on the climate and can be attributed to external drivers”.
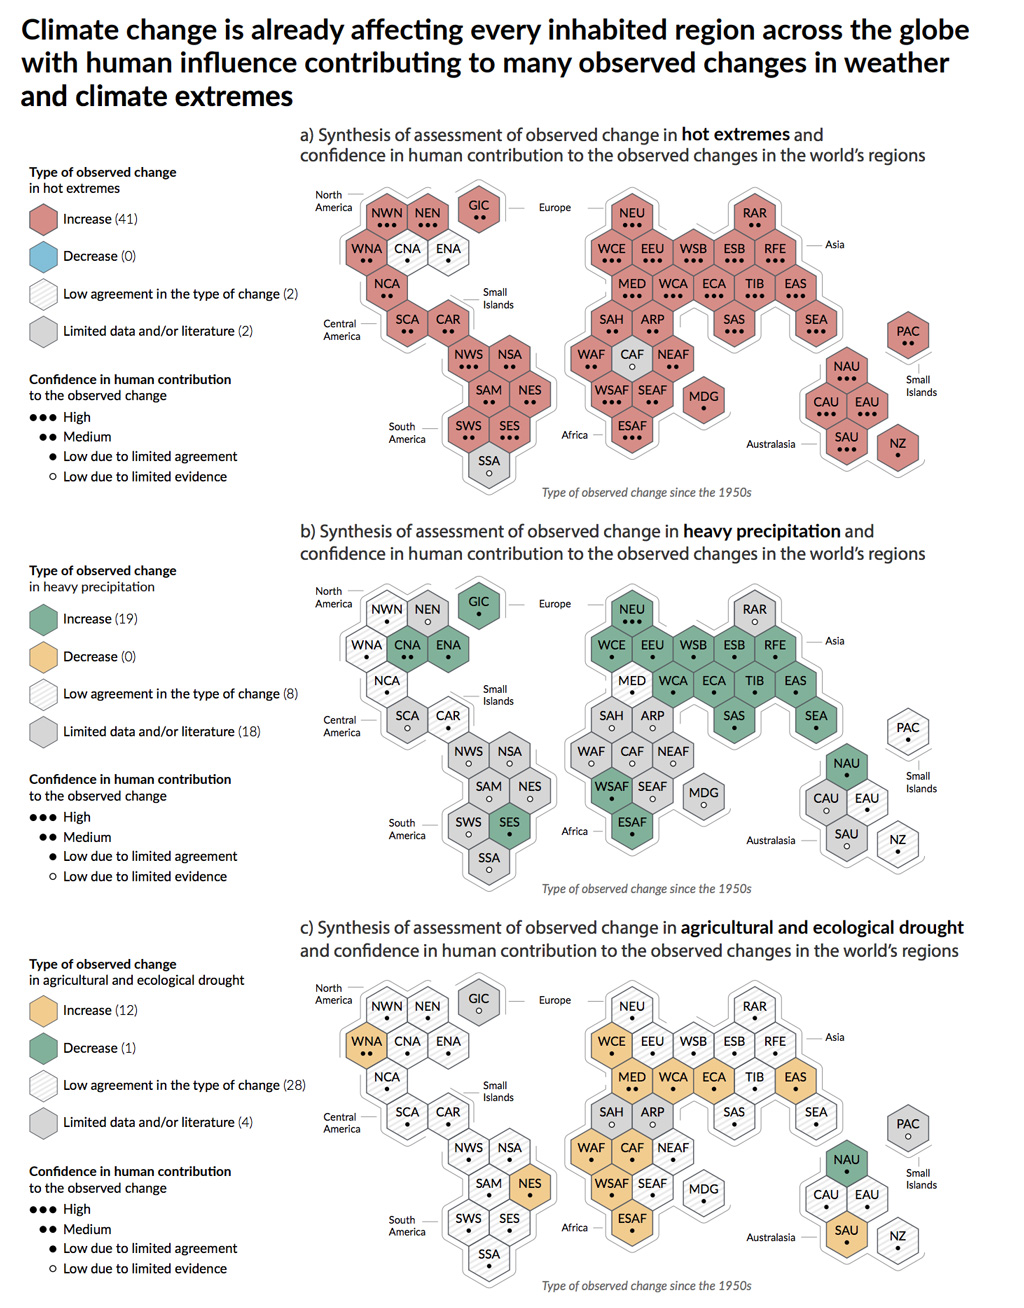
The maps below, taken from the report’s Summary for Policymakers, shows how climate change is “already affecting every inhabited region” across the world. The maps show a “synthesis of assessment” for hot extremes (top), heavy precipitation (middle) and drought (bottom), with each hexagon showing a single region.
The colour of shading in each hexagon shows whether there has been an observed increase or decrease in that region since the 1950s, while grey shading or cross-hatching indicates limited data or low agreement, respectively. The number of dots within the hexagons show the level of confidence in the influence that humans are having.
The following sections look at different types of weather extremes in turn, drawing out what the report says on observed changes, attribution and projections for the future.
Heat
Observations
The AR6 report concludes that it is virtually certain that “the frequency and intensity of hot extremes (including heatwaves) have increased and those of cold extremes have decreased on the global scale from 1950”.
This “also applies at regional scale”, the IPCC says, with more than 80% of regions showing these changes at least at the likely level.
The maps below show how annual hottest temperature (left), coldest temperature (middle) and number of “warm days” (right) have changed across the world since 1960. The shading indicates increases (red), decreases (blue), no significant change (crosses) and insufficient data (grey).
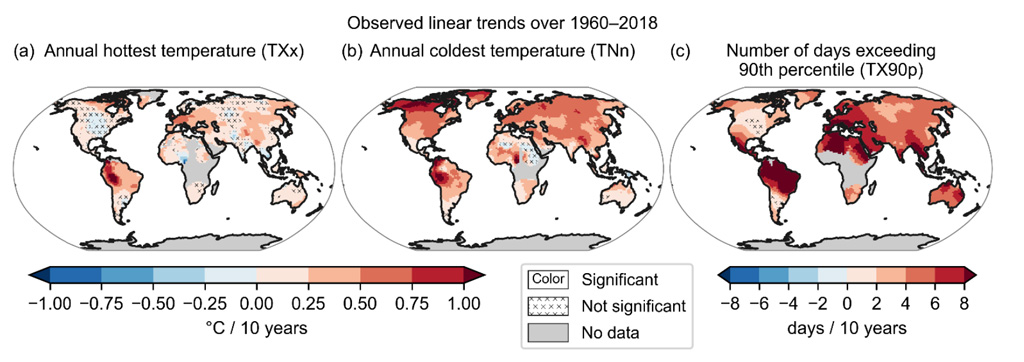
The global rate of increase in annual hottest temperatures is similar to that of average land warming, the report says, which is “about 45% higher than global warming”. Increases in the annual coldest temperature is “even higher, with about 3C of warming since 1960”, the report adds.
The maps show “trends consistent with overall warming in most regions”, the IPCC says, with particularly high increases in maximum temperatures in Europe and north-western South America, and the highest increases in minimum temperatures in the Arctic.
On the Arctic, specifically, the report adds that extreme heat events have increased since 1979, “particularly over Arctic North America and Greenland, which is consistent with summer melt”. It also notes that “Arctic minimum temperatures have increased at about three times the rate of global surface temperature since the 1960s”.
In contrast, “a decrease in the number of cold spell days is also observed over nearly all land surface areas, and in the northern mid-latitudes in particular”, the report says. In addition, nearly all land regions have seen “statistically significant decreases” in cold nights.
The report says that it is virtually certain that “there has been increases in the intensity and duration of heatwaves and in the number of heatwave days at the global scale”. It adds:
“These trends likely occur in Europe, Asia and Australia. There is medium confidence in similar changes in temperature extremes in Africa and high confidence in South America; the lower confidence is due to reduced data availability and fewer studies.”
Attribution
The IPCC says it is virtually certain that “human-induced greenhouse gas forcing is the main driver behind observed changes in hot and cold extremes on the global scale”.
It adds that “some recent hot events would have been extremely unlikely to occur without human influence on the climate system”. This reflects a number of recent attribution studies that have concluded that certain extreme events – such as heatwaves in the Pacific north-west in 2021, Siberia in 2020 and across the northern hemisphere in 2018 – would have been virtually “impossible” without human-caused warming.
Increasing greenhouse gas concentrations in the atmosphere lead to a warming of the atmosphere and the Earth’s surface, the report explains. This “direct thermodynamic effect” leads to “warmer temperatures everywhere”, the report says, and triggers other thermodynamic responses and feedbacks, such as an increase in water vapour in the atmosphere.
Temperature increases are also “amplified in areas where seasonal snow cover is reduced” and by the “higher atmospheric evaporative demand that results in a drying of soils in some regions”, the report says.
In addition, “the spatial distribution of temperatures can also affect temperature extremes by modifying the characteristics of weather patterns”, the IPCC says. For example, a rapidly warming Arctic has a “robust thermodynamic effect” that “amplifies the warming of cold extremes” in the mid and high latitude regions of the northern hemisphere, the IPCC says, because of a reduction in the cold air being carried down from the Arctic.
However, the report also notes that a potential “dynamic effect” of a warming Arctic – where a reduction in the temperature difference between the Arctic and mid-latitudes has knock-on effects in the atmosphere that “increase the persistence of weather patterns” such as heatwaves – is “much less robust”.
Projections
The AR5 report (pdf) in 2013 concluded that it was virtually certain that there will be more frequent hot extremes and fewer cold extremes over most land areas as the climate warms. The report notes that new studies since AR5 “confirm these assessments”, adding:
“It is virtually certain the number of hot days and hot nights and the length, frequency, and/or intensity of warm spells or heat waves compared to 1995-2014 will increase over most land areas.”
The maps below present future projections of annual maximum temperature (top) and annual minimum temperature (bottom) under 1.5C (left), 2C (middle) and 4C (right) of warming.
The shading indicates the size of the projected change, with the deeper reds showing larger increases. However, the report notes that “large warming in hot and cold extremes will occur even at the 1.5C warming level”.
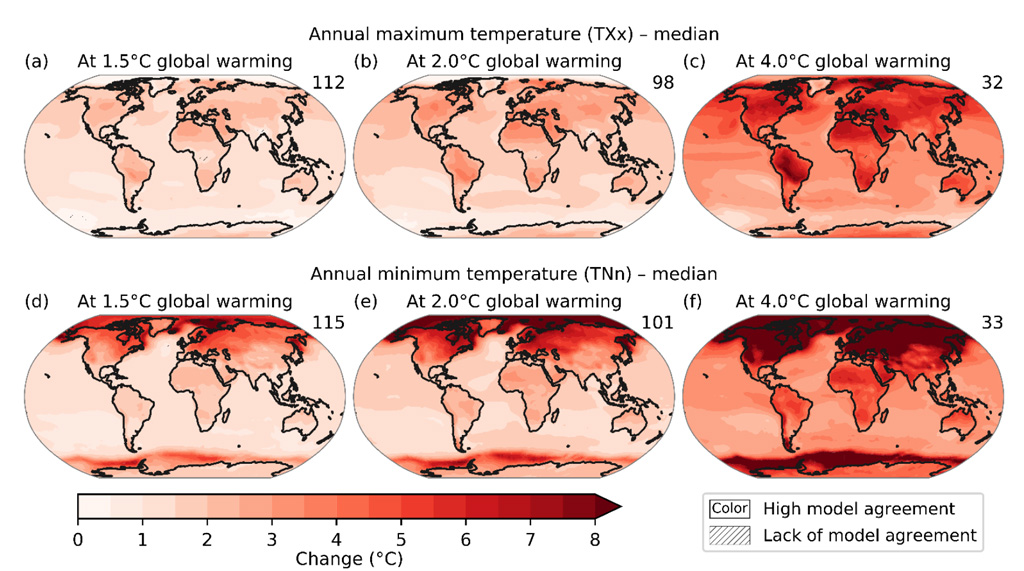
The maps illustrate that the projected warming for annual minimum temperatures is larger than for maximum temperatures and exhibits stronger warming at the poles than the equator. In the Arctic, for example, “the rate of warming of the temperature of the coldest nights is about three times the rate of global warming”, the report says. In the mid-latitudes, “the rate of warming of hot extremes can be twice the rate of global warming”.
Rising maximum temperatures “is more uniform over land” and does not exhibit the same variations with latitude, the authors note. They add:
“The highest increase of temperature of hottest days is projected in some mid-latitude and semi-arid regions, at about 1.5 times to twice the rate of global warming (high confidence).”
Interestingly, the report says with high confidence that, in most regions, “changes in the magnitude of temperature extremes are proportional to global warming levels”, but that the probability of these extremes “generally increases non-linearly” with warming.
After the deadly Pacific north-west “heat dome” in the summer of 2021 shattered records by such a large margin, scientists warned that it was “surprising and shaking” to find out that “our theoretical picture of how heatwaves would behave” in a warming climate “was broken”.
And research published shortly after warned that climate change is expected to drive increases in “record-shattering” heat extremes.
Heavy rainfall
Observations
The frequency and intensity of heavy rainfall events “have likely increased at the global scale over a majority of land regions with good observational coverage”, the IPCC says. Regional increases in the frequency and/or intensity of heavy rainfall “have been observed with medium confidence for nearly half” of regions, the report adds.
Since 1950, the annual maximum amount of rainfall falling in a day or over five consecutive days “has likely increased” for land areas with sufficient observations, the report notes.
In general, the evidence for increasing rainfall extremes for Europe, North America and Asia is the most robust, the report says, and heavy precipitation has likely increased on the continental scale over these three continents.
For example, “there is a significant increase in heavy rainfall” in central India during the South Asian monsoon season, the report says, which has occurred alongside “a significant decrease in moderate rainfall”.
Whereas across Africa, for example, there is a “general lack of continent-wide systematic analysis” and a “sporadic nature” of available data, the report says. So, while “increases in the frequency and intensity of extreme precipitation have been observed over the well-gauged areas during 1950-2013”, this only covers “15% of the total area”.
Similarly, in Central and South America, “evidence shows an increase in extreme precipitation, but in general there is low confidence”, the report says. And in small island states, “there is a lack of evidence showing changes in heavy precipitation overall”.
Trends in other regions are also not clear-cut, the authors say:
“In Australasia, available evidence has not shown an increase or a decrease in heavy precipitation over Australasia as a whole (medium confidence), but heavy precipitation tends to increase over northern Australia (particularly the north-west) and decrease over the eastern and southern regions.”
The IPCC says it only has very low confidence about changes in sub-daily extremes – for example, hourly rainfall. This is because sub-daily precipitation data often “have only sporadic spatial coverage and are of limited length”.
In general, available data records “are far shorter than needed for robust quantification of past changes” in extremes. Nonetheless, the report adds, “there are studies in regions of almost all continents that generally indicate intensification of sub-daily extreme precipitation”.
Attribution
For the increases that are observed, human influence – particularly through greenhouse gas emissions – “is likely the main driver of the observed scale intensification”, the report says, adding:
“In particular, detection and attribution analyses have provided consistent and robust evidence of human influence on extreme precipitation of one- and five-day durations at global to continental scales.”
Evidence for human influence on extreme precipitation at regional scales is limited, the report notes, but “new evidence is emerging”. For example, studies have shown that “the increase in widespread extremes over the South Asian Monsoon during 1950-2015 is due to the combined impacts of the warming of the Western Indian Ocean (Arabian Sea) and the intensification of irrigation water management over India”.
The report explains that rising temperatures control “changes in water vapour through increases in evaporation and in the water-holding capacity of the atmosphere”. At the global scale, water vapour content “increases roughly following the Clausius-Clapeyron (C-C) relation, with an increase of approximately 7% per 1C of warming”. It continues:
“Climate model projections show that the increase in water vapour leads to robust increases in precipitation extremes everywhere, with a magnitude that varies between 4% and 8% per degree celsius of surface warming.”
However, there are “multiple cases indicating that very extreme precipitation may increase at a rate more than the C-C rate”, the report notes.
A warming climate can also affect “dynamic” processes in the atmosphere, the IPCC says, such as the frequency and intensity of cyclones, weather fronts and convective systems:
“For example, the poleward shift and strengthening of the southern hemisphere mid-latitude storm tracks can modify the frequency/intensity of extreme precipitation. However, the precise way in which dynamic changes will affect precipitation extremes is unclear due to several competing effects.”
Projections
In future, heavy rainfall will “generally become more frequent and more intense with additional global warming”, the report says. It adds:
“At global warming levels of 4C relative to the pre-industrial, very rare (e.g. 1 in 10 or more years) heavy precipitation events would become more frequent and more intense than in the recent past, on the global scale (virtually certain) and in all continents and AR6 regions.”
The maps below present future projections of annual maximum daily precipitation under 1.5C (left), 2C (middle) and 4C (right) of warming. The shading indicates increases (green) and decreases (brown), while the hatching shows parts of the world with limited agreement across climate models.
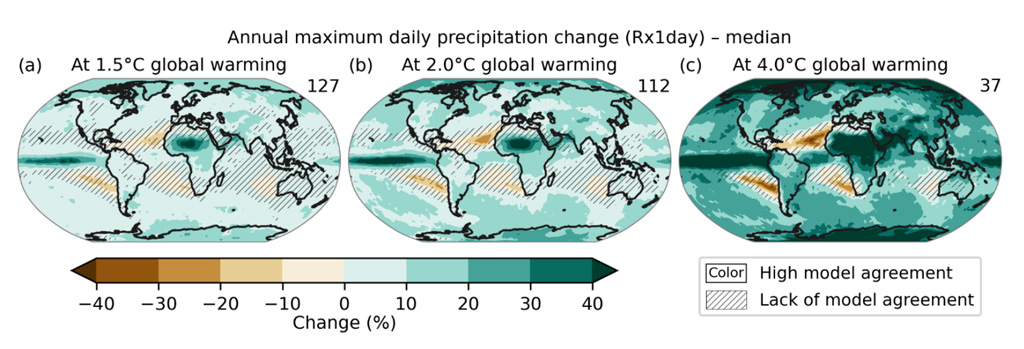
The spatial patterns across the maps “are quite similar” and show “near-linear scaling between extreme precipitation and global warming levels at regional scales”, the report says:
“Extreme precipitation nearly always increases across land areas with larger increases at higher global warming levels, except in very few regions, such as southern Europe around the Mediterranean Basin in some seasons.”
Most projected decreases in extreme rainfall are confined to “subtropical ocean areas”, the report says, and are “highly correlated to decreases in mean precipitation due to storm track shifts”.
The number of studies on projections of extreme hourly rainfall “are limited”, the IPCC notes. Simulations by regional climate models that are able to simulate convective processes – known as convective-permitting models – are “limited in length and only available in a few regions because of high computing costs”. Nonetheless, the report says:
“A majority of the available convection-permitting simulations project increases in the intensities of extreme sub-daily precipitation events with the amount similar to or higher than the C-C scaling rate.”
Flooding
Observations
The report’s chapter on extreme weather focuses on two main forms of flooding that relate to rainfall – “pluvial” floods, which include surface water and flash flooding, and “fluvial” floods, which occur when a river or stream overflows its banks.
For river floods, the inundated area is “difficult to measure or quantify”, the report says. For this reason, many of the existing studies on changes in floods focus on “streamflow”, which is the flow of water through the river channel.
The authors note that floods are “a complex interplay of hydrology, climate and human management”. In addition to the amount and intensity of precipitation, other factors play an important role, including soil moisture, seasonal snow cover, land use, and river and catchment engineering, the report says. This means that “there is not always a one-to-one correspondence between an extreme precipitation event and a flood event, or between changes in extreme precipitation and changes in floods”.
Published studies on observed changes in flooding tend to focus on regional and local scales, which makes it “difficult to synthesise at the global and sometimes regional scales”. There also significant data gaps, the IPCC says:
“Streamflow measurements are not evenly distributed over space, with gaps in spatial coverage, and their coverage in many regions of Africa, South America and parts of Asia is poor, leading to difficulties in detecting long-term changes in floods.”
The IPCC concludes that it has high confidence that the “seasonality of floods has changed in cold regions where snowmelt dominates the flow regime in response to warming”. However, there is a more uncertain picture for the rest of the world, the report explains:
“Confidence about peak flow trends over past decades on the global scale is low, but there are regions experiencing increases, including parts of Asia, southern South America, the north-east US, north-western Europe and the Amazon, and regions experiencing decreases, including parts of the Mediterranean, Australia, Africa and the south-western US.”
Attribution
The multiple factors at play in flood events also makes attribution assessments more difficult. This, along with “the lack of studies overall”, means the IPCC says there is low confidence in “general statements” around flooding and human-caused climate change. However, “some individual regions have been well studied, which allows high confidence” in these cases, the report says:
“For example, flooding in the UK following increased winter precipitation can be attributed to anthropogenic climate change.”
Projections
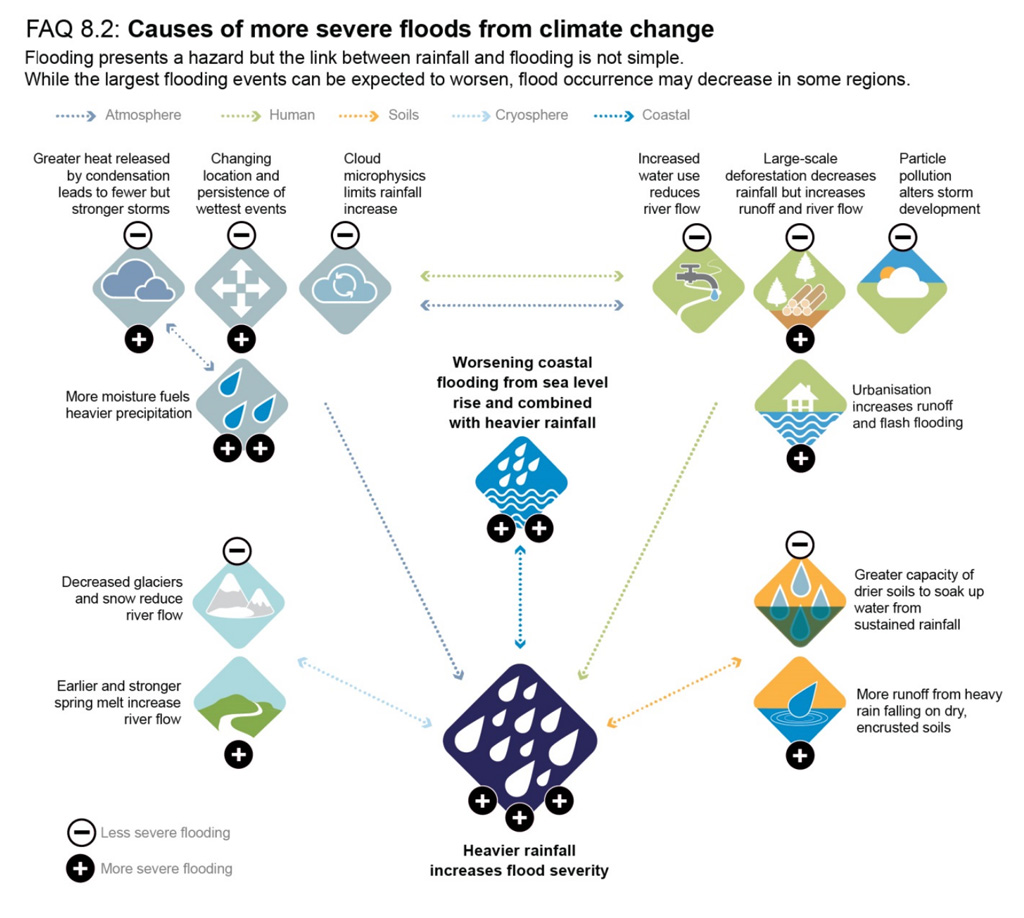
The figure below shows how climate change can increase the severity of different types of floods.
Looking ahead, the IPCC says it has medium confidence in the findings from global hydrological models that project “a larger fraction of land areas to be affected by an increase in river floods than by a decrease in river floods”. It adds there is also medium confidence that river floods “will increase in the western Amazon, the Andes, and south-eastern and northern Asia”.
The IPCC is more certain about changes in pluvial flooding, concluding – with high confidence – that projected increases in the intensity of extreme rainfall “translates to an increase in the frequency and magnitude of pluvial floods…as pluvial flooding results from precipitation intensity exceeding the capacity of natural and artificial drainage systems”.
Drought
Observations
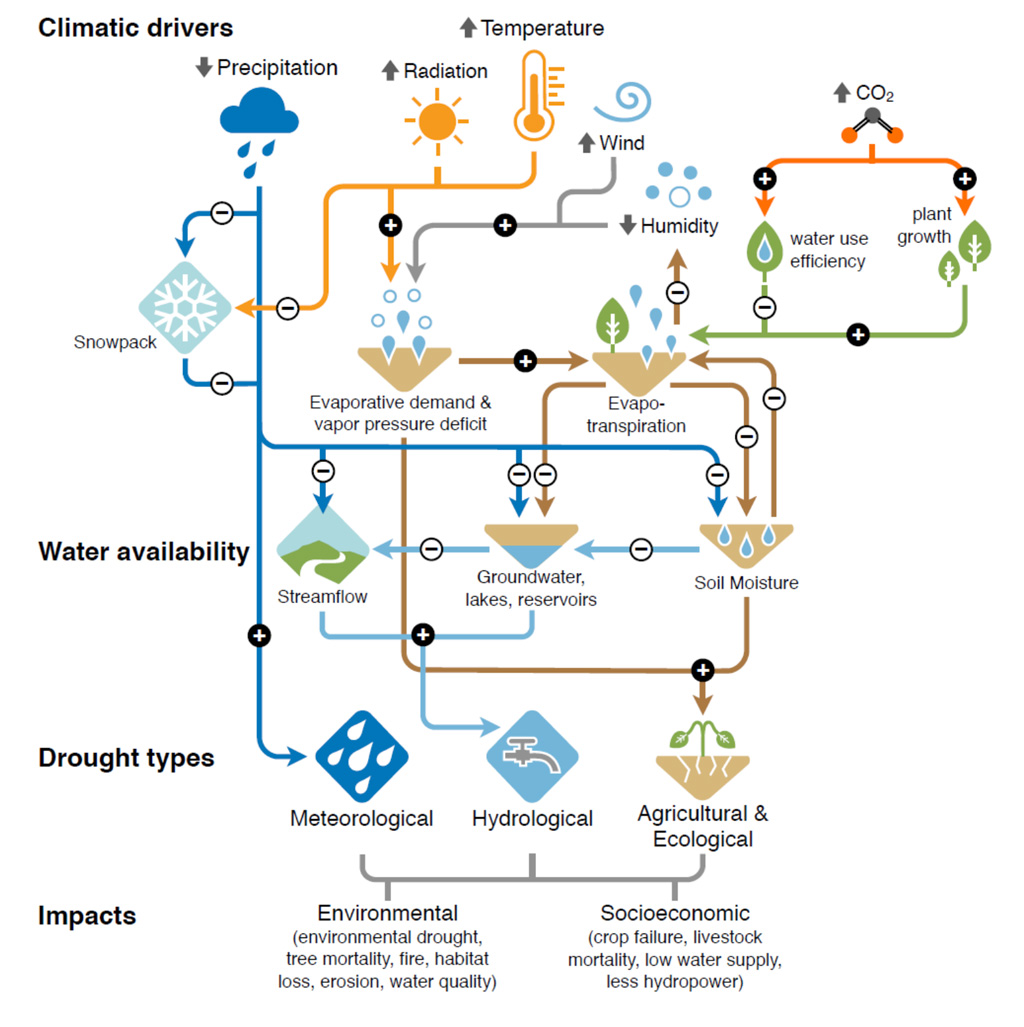
As with flooding, there is more than one type of drought, and these descriptions add more nuance to the IPCC’s general definition of “periods of time with substantially below-average moisture conditions”. The report explains:
“Depending on the variables used to characterise it and the systems or sectors being impacted, drought may be classified in different types, such as meteorological (precipitation deficits), agricultural (e.g. crop yield reductions or failure, often related to soil moisture deficits), ecological (related to plant water stress that causes e.g. tree mortality), or hydrological droughts (e.g. water shortage in streams or storages such as reservoirs, lakes, lagoons, and groundwater).”
This figure highlights the climatic drivers of drought and the impacts on water availability.
The maps below illustrate observed changes across the world over the last 60-70 years using three different drought metrics. The shading indicates a wetting (green) or drying (brown) trend, with grey showing areas with insufficient data.
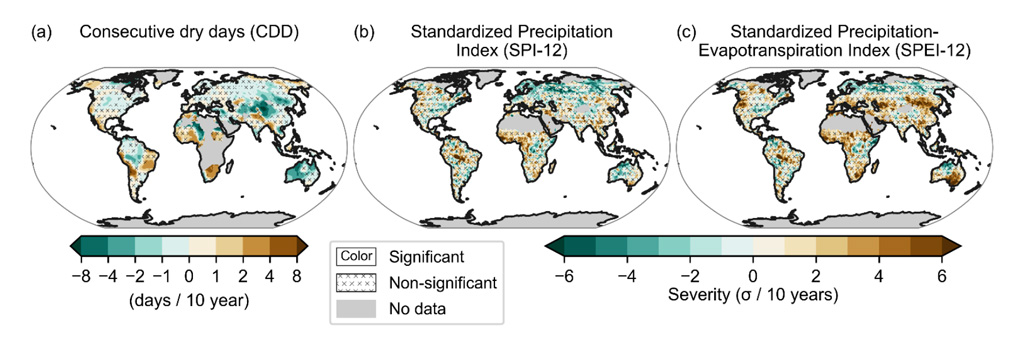
The metrics include the number of consecutive dry days (left) and the standardised precipitation index, or “SPI” (middle), which are both “precipitation-based indices…used for the estimation of changes in meteorological droughts”, the report says.
The report concludes that few regions “show observed increases in meteorological drought”, but those that do are “mostly in Africa and South America”.
The third metric, standardised precipitation-evapotranspiration index, or “SPEI” (right), is an atmospheric-based index that combines precipitation and atmospheric evaporative demand (AED). AED is the “maximum amount of actual evapotranspiration that can happen from land surfaces if they are not limited by water availability”, the report notes.
There are “stronger signals indicating observed increases in agricultural and ecological drought”, the report says, “which highlights the role of increased ET, driven by increased AED, for these trends”. Increases in agricultural and ecological droughts are found “on all continents and several regions”, the authors say, including western, central and southern Africa, central and east Asia, southern Australia, the Mediterrannean, western and central Europe, and north-east South America. Decreases in agricultural and ecological drought are only found in one region, the report says – northern Australia.
Attribution
The IPCC says, with medium confidence, that “human-induced climate change has contributed to increases in agricultural and ecological droughts in some regions due to ET increases”.
In turn, the report says – with high confidence – that increases in ET “have been driven by AED increases induced by increased temperature, decrease relative humidity and increase net radiation”. It also notes that “trends in precipitation are not a main driver in affecting global-scale trends in drought”.
Droughts are affected by a changing climate through “both thermodynamic and dynamic processes”, the reports explains:
“Thermodynamic processes affect droughts by increasing atmospheric evaporative demand through changes in air temperature, radiation, wind speed and relative humidity. Dynamic processes affect droughts through changes in the occurrence, duration and intensity of weather anomalies, which are related to precipitation and the amount of sunlight.”
Projections
Looking to the future, the IPCC warns – with high confidence – that “more regions are affected by increases in agricultural and ecological droughts with increasing global warming”.
The latest evidence “strengthens the conclusion” of the IPCC’s special report on 1.5C that “even relatively small incremental increases in global warming (+0.5C) cause a worsening of droughts in some regions”, the authors say.
The maps below show projected changes in the frequency and intensity of one-in-10-year soil moisture drought for June-to-August (top) and December-to-February (bottom) at 1.5C (left), 2C (middle) and 4C (right) of global warming. The size of the change is indicated by the shading – green for declining frequency and brown for increasing.
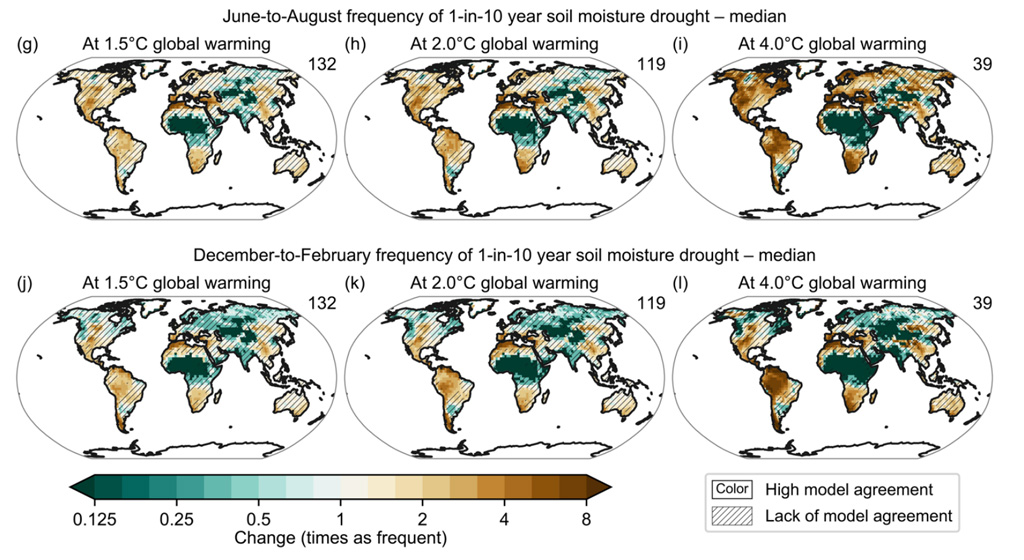
Several regions will be affected by “more severe agricultural and ecological droughts even if global warming is stabilised at 2C”, the report says, with high confidence. For some regions, this occurs at 1.5C, the report adds with medium confidence, including the Mediterranean, southern Africa, southern Australia, central North America, and much of South America.
Even more regions would be affected by 4C of warming, the IPCC says, with north-east Africa and South Asia being notable exceptions that show a decrease in drought.
At higher warming levels, there is high confidence that the land carbon sink “will become less efficient due to soil moisture limitations and associated drought conditions”, the IPCC says.
And the report also notes that, while higher atmospheric CO2 concentrations lead to enhanced water-use efficiency in plants, there is only low confidence that this can “ameliorate agricultural and ecological droughts, or hydrological droughts, at higher global warming levels characterised by limited soil moisture and enhanced AED”.
Tropical cyclones
Observations
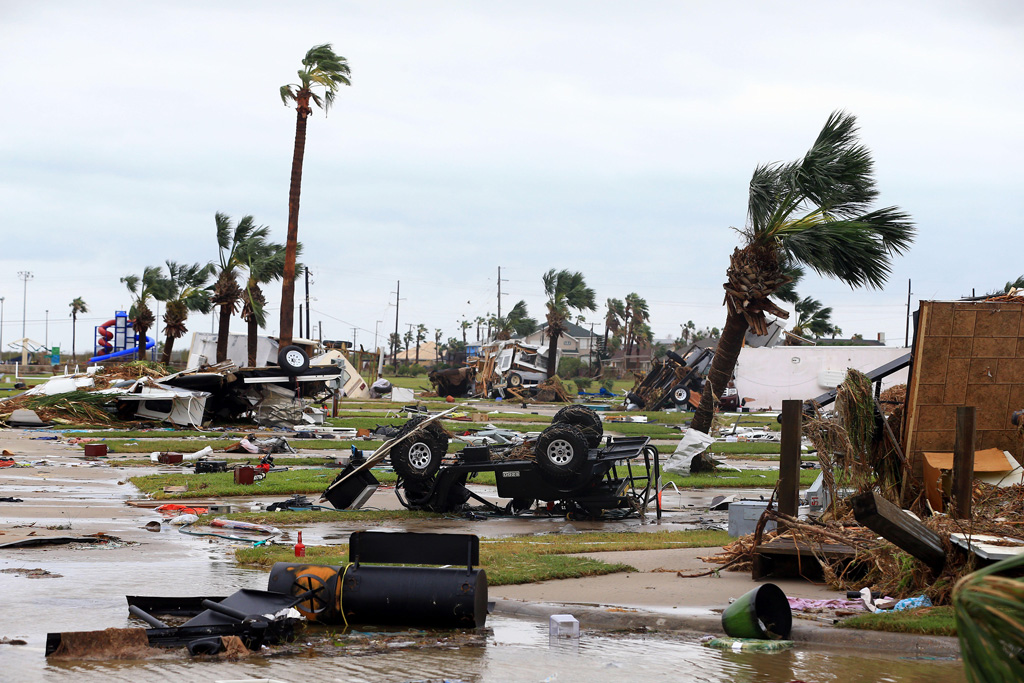
Tropical cyclones (TCs) are powerful storms that develop in the warm ocean waters of the tropics. Their impacts frequently hit the headlines. In 2017, for example, a string of major hurricanes – including Harvey, Irma and Maria – caused devastation in the US and Caribbean.
Quantifying the effect of climate change on such storms is “challenging”, the report says, “partly because extreme storms are rare, short-lived and local”, but also because individual storms are influenced by a “high degree of random variability”. However, “despite these challenges, progress has been made since AR5”, the IPCC says.
The report concludes that “it is likely that the global proportion of category 3-5 tropical cyclone instances and the frequency of rapid intensification events have both increased globally over the past 40 years”.
(Category 3-5 tropical cyclones – known as “major” storms – are those that reach sustained wind speeds of 111 miles per hour or more.)
For context, the AR5 report previously concluded (pdf) that “confidence remains low for long-term (centennial) changes in tropical cyclone activity, after accounting for past changes in observing capabilities”.
That conclusion reflected the findings of the IPCC’s special report on the risks of extreme events (SREX) in 2012. While the IPCC’s fourth assessment report (AR4) in 2007 found (pdf) that it was likely that intense tropical cyclone activity had increased since 1970 in some regions, SREX subsequently concluded that it was “difficult to draw firm conclusions with respect to the confidence levels associated with observed trends prior to the satellite era and in ocean basins outside of the North Atlantic”, the AR5 report explains.
The AR6 report also notes that “it is very likely that the average location where TCs reach their peak wind-intensity has migrated poleward in the western North Pacific Ocean since the 1940s”, and “it is likely that TC translation speed has slowed over the US since 1900”.
The translation speed is the pace that the storms move across the Earth’s surface. In 2017, for example, Hurricane Harvey “stalled” over Houston, releasing 100cm of rain in just three days and triggering catastrophic flooding.
Attribution
The authors conclude that “there is high confidence that anthropogenic climate change contributed to extreme rainfall amounts during Hurricane Harvey and other intense TCs”. And “it is more likely than not that the slowdown of TC translation speed over the US has contributions from anthropogenic forcing”.
It is “very likely that the recent active TC seasons in the North Atlantic, the North Pacific and Arabian basins cannot be explained without an anthropogenic influence”, the report says.
For example, it notes, “the anomalous TC activity in 2015 was not solely explained by the effect of an extreme El Niño” as “there was also an anthropogenic contribution, mainly through the effects of SSTs [sea surface temperatures] in subtropical regions.”
The anthropogenic influence on active TC seasons is “principally associated with aerosol forcing [as a result of reduced air pollution], with stronger contributions to the response in the North Atlantic”, the report says.
For comparison, AR5 (pdf) found “low confidence in attribution of changes in tropical cyclone activity to human influence”. This was a result of “insufficient observational evidence, lack of physical understanding of the links between anthropogenic drivers of climate and tropical cyclone activity and the low level of agreement between studies as to the relative importance of internal variability, and anthropogenic and natural forcings”.
Projections
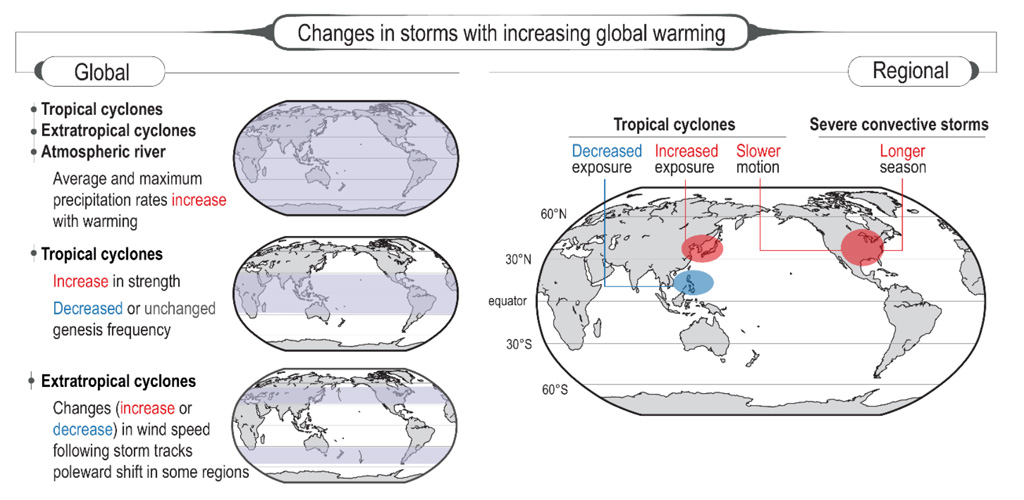
Projections for how tropical cyclones will change as warming continues suggest that “average peak TC wind speeds and the proportion of category 4-5 TCs will very likely increase globally with warming”, the IPCC says.
It is also very likely that “average TC rain rates will increase with warming, and likely that the peak rain rates will increase at greater than the Clausius-Clapeyron scaling rate of 7% per 1C of warming in some regions”, the report adds.
On tropical cyclone frequency, the IPCC says it is likely that “the global frequency of TCs over all categories will decrease or remain unchanged”. The bulk of the reduction is “at the weaker end of the intensity spectrum as the climate warms”, the report notes, while “the frequency of category 4-5 TCs will increase in limited regions over the western North Pacific”.
The figure below summarises the past and projected global (left) and regional (right) changes for tropical cyclones, as well as for extratropical cyclones – that is, those outside of the tropics – and severe convective storms and atmospheric rivers.
Compound events
The report also considers “compound events”, which “were not assessed in depth in past IPCC reports”. These events are defined as “the combination of multiple drivers and/or hazards that contribute to societal or environmental risk”. The authors explain:
“The combination of two or more – not necessarily extreme – weather or climate events that occur i) at the same time, ii) in close succession, or iii) concurrently in different regions, can lead to extreme impacts that are much larger than the sum of the impacts due to the occurrence of individual extremes alone. This is because multiple stressors can exceed the coping capacity of a system more quickly.”
The IPCC says there is high confidence that the “land area affected by concurrent extremes has increased”. Similarly, the report ascribes the same level of confidence to the conclusion that “concurrent extreme events at different locations, but possibly affecting similar sectors (e.g., breadbaskets) in different regions, will become more frequent with increasing global warming, in particular above +2C of global warming”.
Looking specifically at concurrent heat and drought extremes, the report says “there is high confidence that concurrent heatwaves and droughts have increased in frequency over the last century at the global scale due to human influence”.
The IPCC also says it has high confidence that “compound hot and dry conditions become more probable in nearly all land regions as global mean temperature increases”.
And these concurrent extremes have implications for wildfires, too, the report notes:
“There is medium confidence that weather conditions that promote wildfires (fire weather) have become more probable in southern Europe, northern Eurasia, the US, and Australia over the last century.
“There is high confidence that fire weather conditions will become more frequent at higher levels of global warming in some regions.”
Finally, the report also considers compound extremes in coastal regions, noting that “there is medium confidence that over the last century the probability of compound flooding has increased in some locations, including along the US coastline”. It adds:
“There is high confidence that the occurrence and magnitude of compound flooding in coastal regions will increase in the future due to both sea level rise and increases in heavy precipitation.”
Summary tables
The table included below (Table 11.1 from the report) provides a “synthesis…on observed changes in extremes and contribution by human influences”.
| Phenomenon and direction of trend | Observed/detected trends since 1950 (for +0.5C global warming or higher) | Human contribution to the observed trends since 1950 (for +0.5C global warming or higher) |
|---|---|---|
| Warmer and/or more frequent hot days and nights over most land areas Warmer and/or fewer cold days and nights over most land areas Warm spells/heatwaves; Increases in frequency or intensity over most land areas Cold spells/cold waves: Decreases in frequency or intensity over most land areas | Virtually certain on global scale Continental-scale evidence: Asia, Australasia, Europe, North America: Very likely Central and South America: High confidence Africa: Medium confidence | Extremely likely main contributor on global scale Continental-scale evidence: North America, Europe, Australasia, Asia: Very likely Central and South America: High confidence Africa: Medium confidence |
| Heavy precipitation events: increase in the frequency, intensity, and/or amount of heavy precipitation | Likely on global scale, over majority of land regions with good observational coverage Continental-scale evidence: Asia, Europe, North America: Likely Africa, Australasia, Central and South America: Low confidence | Likely main contributor to the observed intensification of heavy precipitation in land regions on global scale. Continental-scale evidence: Asia, Europe, North America: Likely Africa, Australasia, Central and South America: Low confidence |
| Increases in agricultural and ecological drought events | Medium confidence in some regions Increasing trends in agricultural and ecological droughts have been observed in AR6 regions on all continents (medium confidence) | Medium confidence in some regions |
| Increase in precipitation associated with tropical cyclones | Medium confidence | High confidence |
| Increase in likelihood that a TC will be at major TC intensity (Cat. 3-5) | Likely | Medium confidence |
| Changes in frequency of rapidly intensifying tropical cyclones | Likely | Medium confidence |
| Poleward migration of tropical cyclones in the western Pacific | Medium confidence | Medium confidence |
| Decrease in TC forward motion over the USA | It is likely that TC translation speed has slowed over the USA since 1900. | It is more likely than not that the slowdown of TC translation speed over the USA has contributions from anthropogenic forcing. |
| Severe convective storms (tornadoes, hail, rainfall, wind, lightning) | Low confidence in past trends in hail and winds and tornado activity due to short length of high-quality data records. | Low confidence |
| Increase in compound events | Likely increase in the probability of compound events. High confidence that co-occurrent heatwaves and droughts are becoming more frequent under enhanced greenhouse gas forcing at global scale. Medium confidence that fire weather, i.e. compound hot, dry and windy events, have become more frequent in some regions. Medium confidence that compound flooding risk has increased in some locations. | Likely that human-induced climate change has increased the probability of compound events. High confidence that human influence has increased the frequency of co-occurrent heatwaves and droughts. Medium confidence that human influence has increased fire weather occurrence in some regions. Low confidence that human influences has contributed to changes in compound events leading to flooding. |
And this table (Table 11.2 from the report) offers a “synthesis table on projected changes in extremes” at 1.5C, 2C and 4C above pre-industrial conditions.
| Phenomenon and direction of trend | Projected changes at +1.5C global warming | Projected changes at +2C global warming | Projected changes at +4C global warming |
|---|---|---|---|
| Warmer and/or more frequent hot days and nights over most land areas Warmer and/or fewer cold days and nights over most land areas Warm spells/heat waves; Increases in frequency or intensity over most land areas Cold spells/cold waves: Decreases in frequency or intensity over most land areas | Virtually certain compared to pre-industrial on global scale. Extremely likely on all continents Highest increase of temperature of hottest days is projected in some midlatitude and semi-arid regions, and the South American Monsoon region, at about 1.5 times to twice the rate of global warming (high confidence) Highest increase of temperature of coldest days is projected in Arctic regions, at about three times the rate of global warming (high confidence) Continental-scale projections: Extremely likely: Africa, Asia, Australasia, Central and South America, Europe, North America | Virtually certain compared to pre-industrial on global scale. Virtually certain on all continents Highest increase of temperature of hottest days is projected in some midlatitude and semi-arid regions, and the South American Monsoon region, at about 1.5 times to twice the rate of global warming (high confidence) Highest increase of temperature of coldest days is projected in Arctic regions, at about three times the rate of global warming (high confidence) Continental-scale projections: Virtually certain: Africa, Asia, Australasia, Central and South America, Europe, North America | Virtually certain compared to pre-industrial on global scale. Virtually certain on all continents Highest increase of temperature of hottest days is projected in some midlatitude and semi-arid regions, and the South American Monsoon region, at about 1.5 times to twice the rate of global warming (high confidence) Highest increase of temperature of coldest days is projected in Arctic regions, at about three times the rate of global warming (high confidence) Continental-scale projections: Virtually certain: Africa, Asia, Australasia, Central and South America, Europe, North America |
| Heavy precipitation events: increase in the frequency, intensity, and/or amount of heavy precipitation | High confidence that increases take place in most land regions Very likely: Asia, N. America Likely: Africa, Europe High confidence: Central and South America Medium confidence: Australasia | Likely that increases take place in most land regions Extremely likely: Asia, N. America Very likely: Africa, Europe Likely: Australasia, Central and South America | Very likely that increases take place in most land regions Virtually certain: Africa, Asia, N. America Extremely likely: Central and South America, Europe Very likely Australasia |
| Agricultural and ecological droughts: Increases in intensity and/or duration of drought events | More regions affected by increases in agricultural and ecological droughts compared observed changes (high confidence) Precipitation decreases is going to increase the severity of drought in some regions; atmospheric evaporative demand will continue to increase compared to pre-industrial conditions and lead to further increases in agricultural and ecological droughts due to increased evapotranspiration in some regions. (high confidence) | More regions affected by increases in agricultural and ecological droughts than at 1.5C of global warming (high confidence) Precipitation decreases is going to increase the severity of drought in some regions; atmospheric evaporative demand will continue to increase compared to pre-industrial conditions and lead to further increases in agricultural and ecological droughts due to increased evapotranspiration in some regions. (high confidence) | More regions affected by increases in agricultural and ecological droughts than at 2C of global warming (very likely) Precipitation decreases is going to increase the severity of drought in several regions; atmospheric evaporative demand will continue to increase compared to pre-industrial conditions and lead to further increases in agricultural and ecological droughts due to increased evapotranspiration in several regions. (high confidence) |
| Increase in precipitation associated with tropical cyclones (TC) | High confidence in a projected increase of TC rain-rates at the global scale with a median projected increase due to human emissions of about 11%. Medium confidence that rain-rates will increase in every basin. | High confidence in a projected increase of TC rain-rates at the global scale with a median projected increase due to human emissions of about 14%. Medium confidence that rain-rates will increase in every basin. | High confidence in a projected increase of TC rain-rates at the global scale with a median projected increase due to human emissions of about 28% Medium confidence that rain-rates will increase in every basin. |
| Increase in mean tropical cyclone lifetime-maximum wind speed (intensity) | Medium confidence | High confidence | High confidence |
| Increase in likelihood that a TC will reach major TC intensity (Cat. 4-5) | High confidence for an increase in the proportion of TCs that reach the strongest (Category 4-5) levels. The median projected increase in this proportion is about 10%. | High confidence for an increase in the proportion of TCs that reach the strongest (Category 4-5) levels. The median projected increase in this proportion is about 13%. | High confidence for an increase in the proportion of TCs that reach the strongest (Category 4-5) levels. The median projected increase in this proportion is about 20%. |
| Severe convective storms | High confidence that the average and maximum rain rates associated with severe convective storms increase in some regions including the US. High confidence that CAPE [convective available potential energy] increases in response to global warming in the tropics and subtropics, suggesting more favourable environments for severe convective storms. Medium confidence that the frequency of springtime severe convective storms is projected to increase in the US leading to a lengthening of the severe convective storm season. |
||
| Increase in compound events (frequency, intensity) | Likely that probability of compound events will continue to increase with global warming. High confidence that co-occurrent heat waves and droughts will continue to increase under higher levels of global warming, with higher frequency/intensity with every additional 0.5C of global warming. High confidence that fire weather, i.e. compound hot, dry and windy events, will become more frequent in some regions at higher levels of global warming. High confidence that compound flooding at the coastal zone will increase under higher levels of global warming. |
||
-
Explainer: What the new IPCC report says about extreme weather and climate change