Guest post: The role of ‘atmospheric rivers’ in UK winter floods

Helen Griffith
01.26.21Helen Griffith
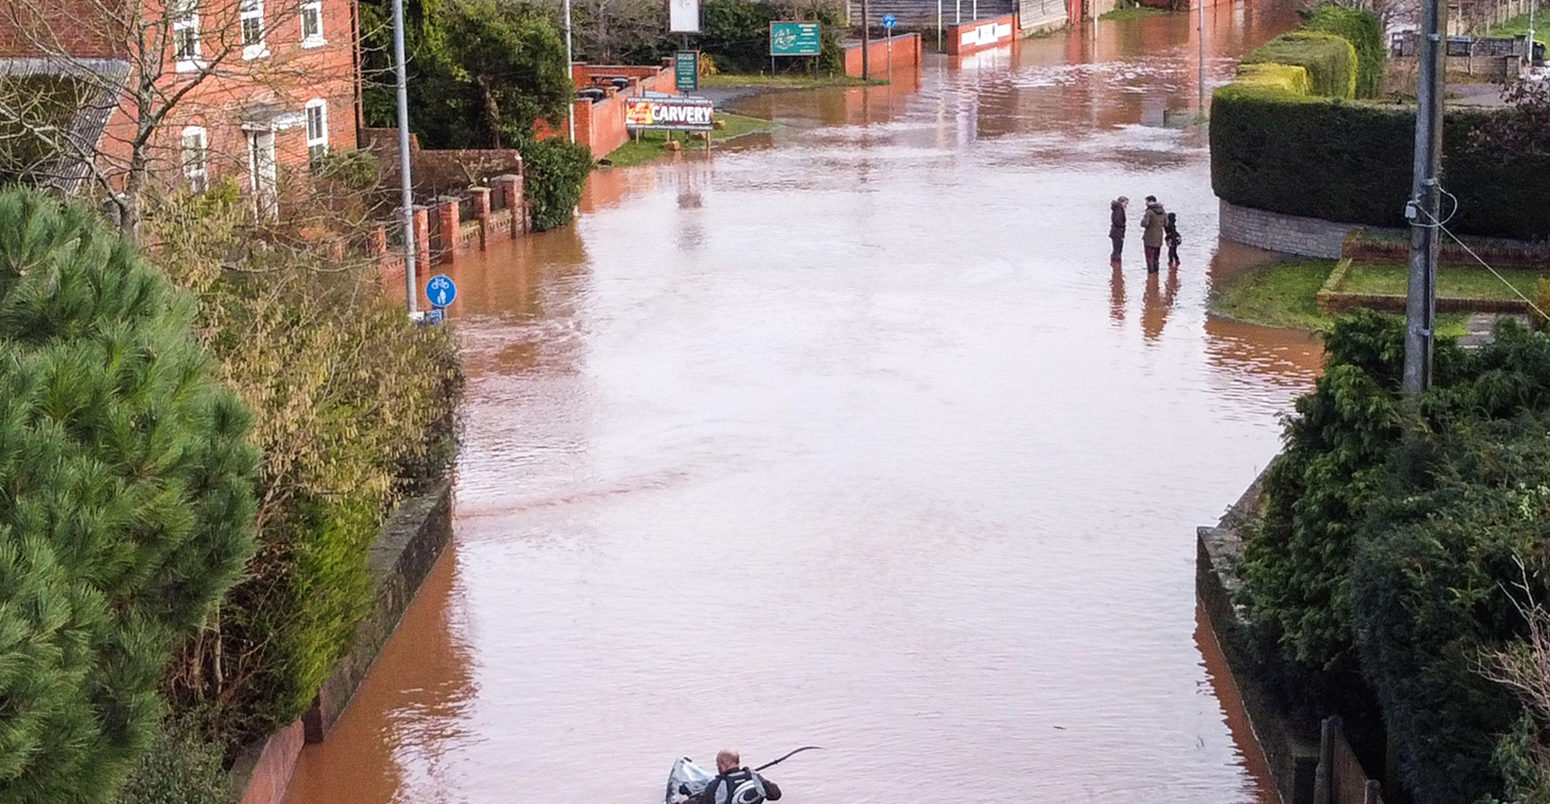
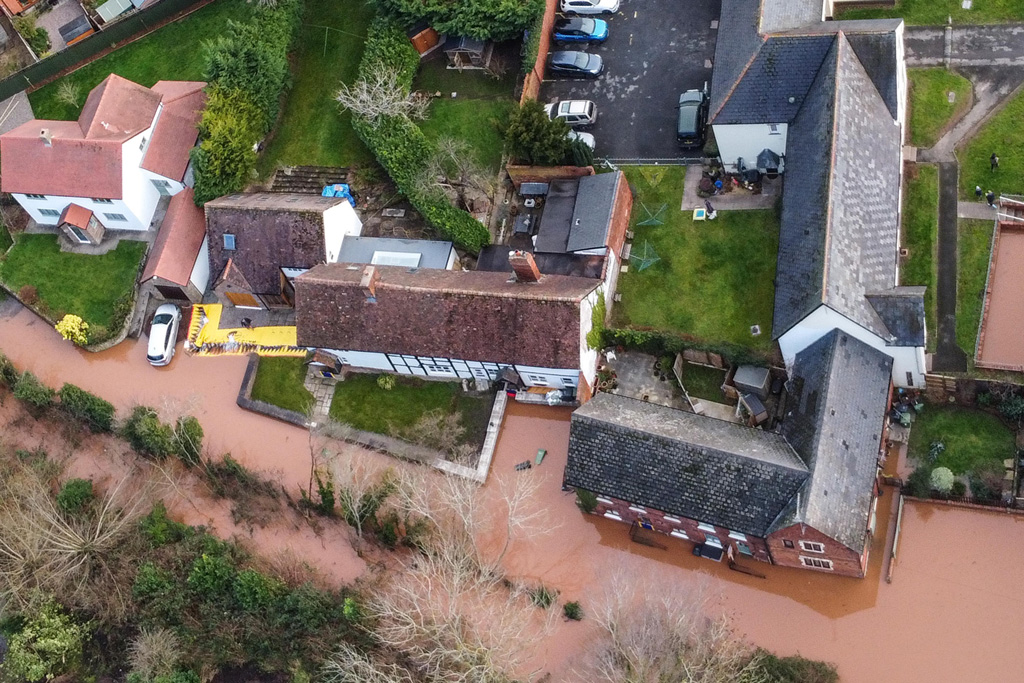
26.01.2021 | 3:24pmThe arrival of Storm Christoph last week has led to widespread flooding across northern regions of the UK, affecting thousands of homes. At the peak of the event, more than 200 flood warnings were in place – many of them “severe”, meaning that floodwaters posed a danger to life.
Christoph arrived on the back of several high-profile storms within the past 12 months. Most notable were storms Ciara, Dennis and Jorge in February 2020, causing the UK’s wettest February on record. Thousands of homes were flooded across England and Wales, and the month was estimated to have cost the insurance industry more than £336m.
A common factor between these events – along with many of the UK’s winter floods – is the arrival of an “atmospheric river”. These long, narrow plumes of warm and wet air can deliver a deluge of rainfall to countries in the mid-latitudes.
This article unpacks how these atmospheric rivers form, what impact their rainfall can have, and how they may change as global temperatures rise.
What is an atmospheric river?
More than 90% of the water vapour being carried in the air across the mid-latitudes occurs within long, narrow filaments known as atmospheric rivers (AR). They are typically around 2,000km long and 300-500km wide.
At the leading edge of the rivers often exists a low-pressure weather system – these characteristic comma-shaped frontal systems are responsible for the majority of the UK’s unsettled weather over the winter months.
At least across the Pacific Ocean, there is evidence that the moisture carried within ARs comes from the tropics, primarily when combined with favourable atmospheric conditions, for example during an El Niño event. However, it is likely that some degree of local moisture cycling is also occurring, where water is evaporated from the sea surface when a low-pressure weather system passes. Not all of this evaporated moisture has time to condense into rain before the system moves on, and this can leave behind a “footprint” of water vapour trailing behind the storm.
We suspect that ARs are formed through a combination of these two processes, depending on the individual properties of the storm.
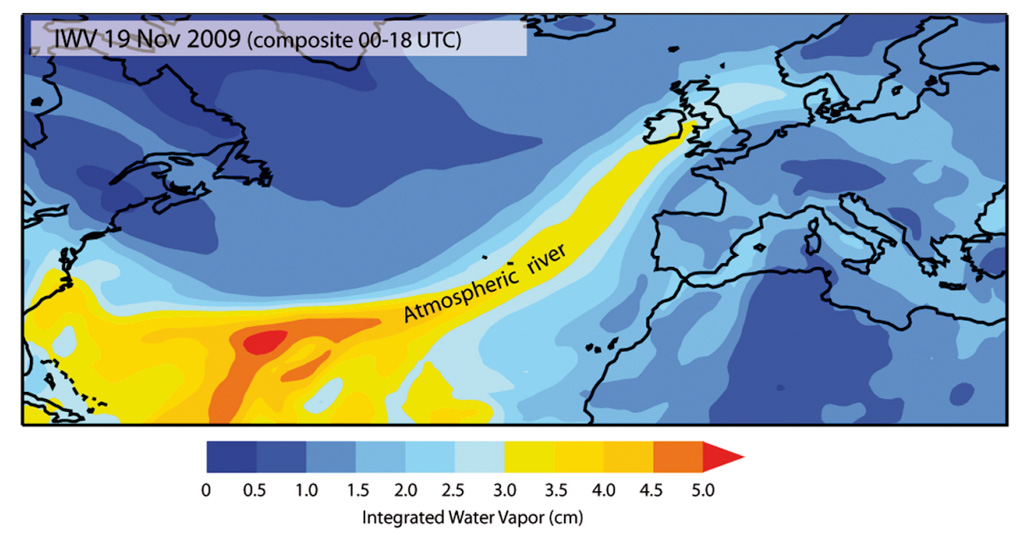
You can see the trail of water vapour in the map below, showing an example from 19 November 2009. The colours show the levels of water vapour in the air, with yellows and oranges indicating a river of atmospheric water. This particular AR brought widespread flooding to Ireland and northern England.
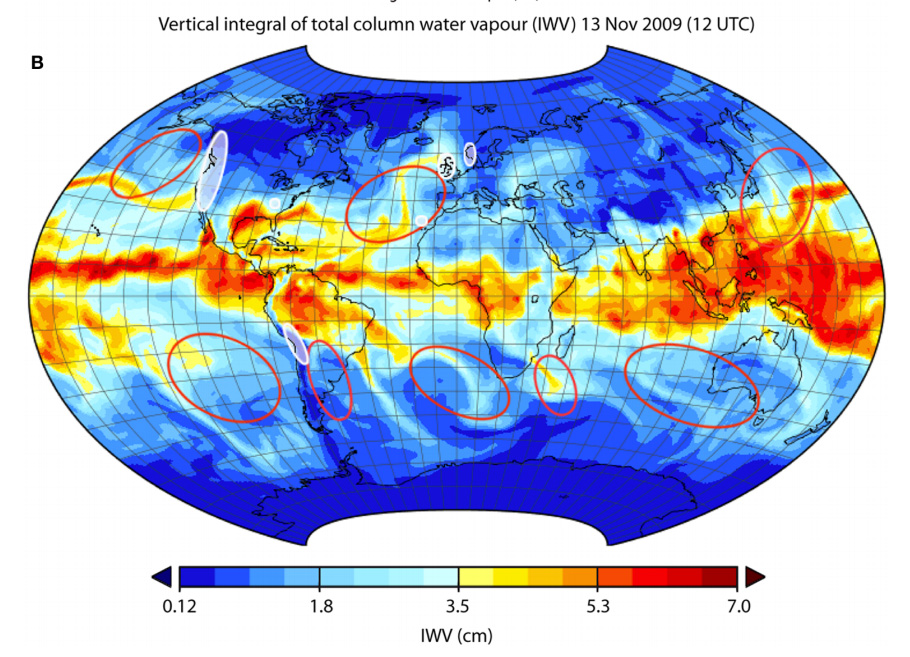
Four or five ARs are present in each hemisphere at any one time and the rivers are long enough to span many of the world’s largest oceans. The map below shows the distribution of ARs on 13 November 2009, with the red rings highlighting areas where ARs typically occur.
The white rings show land areas where ARs have been linked with extreme rainfall and floods – including parts of Europe and North and South America. For example, the “Pineapple Express” is the name given to ARs that carry moisture from the tropical Pacific around Hawaii over to the west coast of the US and Canada.
Global water cycle
The importance of ARs in the global water cycle has been revealed through extensive field campaigns carried out across the Pacific Ocean over the past 20 years. Working with the US Air Force, scientists released dropsondes – weather devices designed to measure storm conditions – into a series of winter storms.
This has allowed scientists to build up a cross-sectional view of ARs that would have been impossible from satellite images alone. These findings have revealed that warm moist air of an AR is typically channelled by low-level winds into a strong “jet”.
When the AR hits land, the winds are forced upwards. The moisture in the air then cools and condenses to form clouds, bringing a deluge of rainfall.
The flows found within the strongest ARs are comparable in magnitude to some of the largest rivers in the world. Thus, the moisture they deliver to their landfalling locations is important both in terms of flood risk and water supply.
It is worth noting that ARs are also beneficial. For regions such as California, where the majority of their annual water budget may arrive in the form of several winter storms, the occurrence – or not – of an AR can significantly impact the availability of water resources from one year to the next.
Across western Europe, ARs bring up to 50% of the monthly rainfall during the winter months. Therefore, the arrival of several events in succession – such as in February last year – can lead to devastating events.
As ARs are thousands of kilometres long, they can remain over a given location well after the accompanying storm has passed. This can lead to more than 24 hours of persistent rainfall – as was the case during and after Storm Christoph.
Can atmospheric rivers be forecasted?
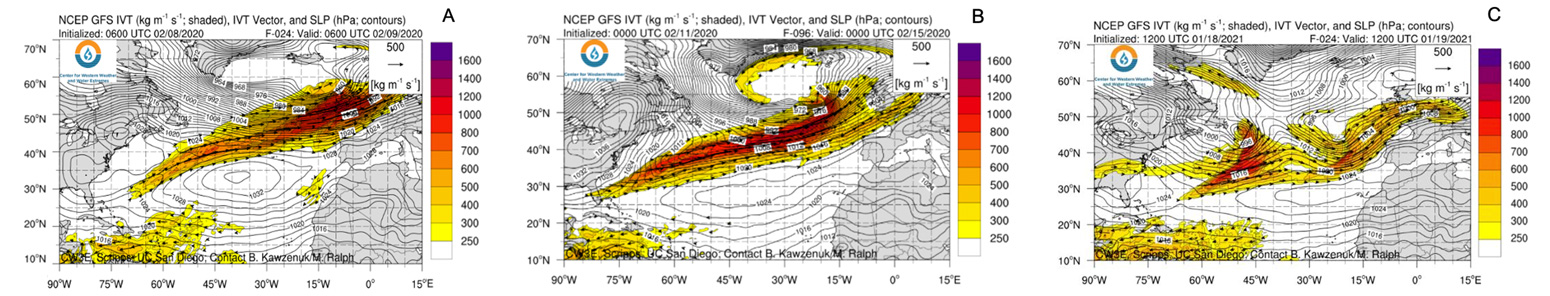
The US is paving the way with regard to developing forecasts of ARs. The National Centres for Environmental Prediction (NCEP) Global Forecast System (GFS) provides predictions of water vapour flux up to seven days in advance for the Northern Pacific and Atlantic Oceans.
The figures below show snapshots of predictions for storms Ciara and Dennis during February 2020 and Christoph this month. As with the earlier maps, the yellow and orange shading indicates the ARs.
From these images alone, it is possible to see that ARs come in different shapes and sizes. For example, the ARs associated with storms Ciara and Dennis were particularly intense, and strong winds were able to support high flows of moisture vapour, resulting in heavy and intense rainfall. The winds associated with Christoph were not quite so strong, but the system stalled over the UK for several days and therefore its rainfall totals were just as significant.
The Centre for Western Weather Extremes (CW3E), based at the Scripps Institute of Oceanography in San Diego, has recently released a proposed AR Scale – similar to the well-known hurricane scale – that goes some way to combining these ideas.
Elsewhere, the European Centre for Medium-Range Weather Forecasts (ECMWF) has developed the Extreme Forecast Index (EFI). This compares the forecast at a given location to the average climate – thus, determining how “extreme” the forecast may be.
There are proposals for a field campaign – similar to that across the northern Pacific – to take place across the Atlantic. This will be designed specifically to improve our understanding of ARs and extreme rainfall events.
The UK can expect to receive around three or four ARs each winter. However, they clearly do not all result in impacts on the scale of Storm Christoph and others. The presence of AR is, therefore, a necessary, but not sufficient, condition for extreme rainfall. Understanding how and why landfalling atmospheric rivers translate into significant impacts is essential if we are to successfully incorporate them into our forecasts.
The power of AR lies within the uplift of its low-level moisture when it hits land – and my colleagues and I propose that the subtle interaction between the AR and the land surface is key to understanding how some ARs generate more rainfall than others. Other factors, such as soil moisture levels and the existence of water storage areas, also play a significant role in the impact of an AR. This is an active area of research at the University of Reading.
Prospects in a changing climate
According to the Clausius-Clapeyron equation, the air can generally hold around 7% more moisture for every 1C of temperature rise. This “thermodynamic” mechanism means that we can expect an increase in atmospheric water vapour content as the climate warms.
However, “dynamic” mechanisms – the processes that transport this moisture around the globe – may also change in terms of their location, intensity and duration. These factors are jointly expected to influence AR rainfall in a changing climate.
As storm tracks become more active, it is reasonable to imagine a combination of a warmer, wetter atmosphere on a backdrop of increasingly turbulent conditions.
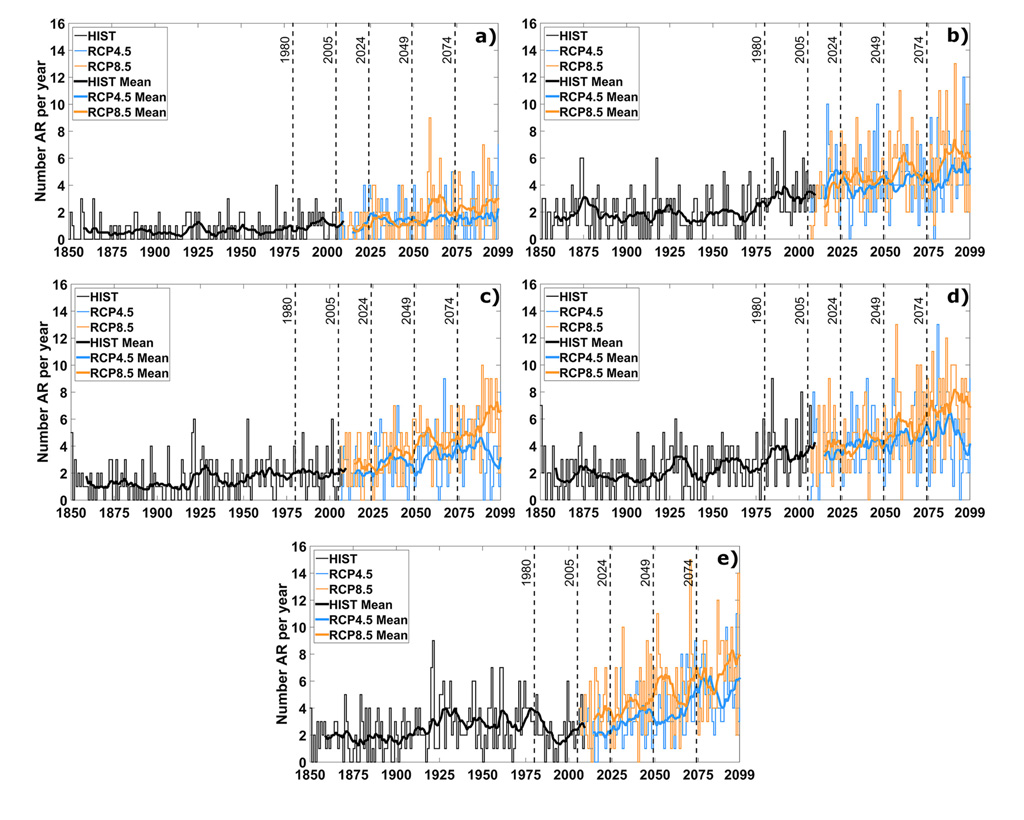
For example, we expect North Atlantic ARs to become stronger and more numerous by the end of this century. In particular, under a very high emissions scenario (RCP8.5), we expect a doubling of AR landfalling frequency along the UK coastline, with an increase in strength of the most intense events. For an intermediate emissions scenario (RCP4.5), we could see an increase in landfalling AR frequency of at least 50%.
You can see this in more detail in the charts below, which show model simulations for five areas of Europe: a) the Iberian Peninsula; b) France; c) UK; d) Central Europe; and e) northern Scandinavia. The lines indicate winter AR frequency for the historical period (1859-2009, black) and projected through the century under RCP4.5 (blue) and RCP8.5 (orange).
In the Pacific, along North America’s west coast, research suggests that the number of days with ARs could increase by as much as 200-300% by the end of this century under RCP8.5. The study projects an 11-18% increase in total AR rainfall across the US west coast and a 15-39% increase of the most intense AR days.
There remains some uncertainty about how the dynamical processes behind ARs will change. The increase in average AR strength is attributed to an increase in atmospheric moisture – as opposed to a strengthening of low-level winds. And there are a number of atmospheric processes that will influence how effectively this moisture will be delivered to coastal locations.
Nonetheless, it is beyond doubt that ARs are capable of delivering intense and persistent rainfall when they make landfall. As the climate warms, ARs will become more frequent and flooding on the scale of that seen in the past 12 months will become more likely.
If we are to develop the most effective forecasts both now and into the future, we therefore need a solid understanding of the processes that shape the powerful ARs in the present climate.
-
Guest post: The role of ‘atmospheric rivers’ in UK winter floods
-
Guest post: How ‘atmospheric rivers’ can trigger flooding in the UK