In-depth Q&A: The IPCC’s special report on the ocean and cryosphere
Multiple Authors
09.25.19Multiple Authors
25.09.2019 | 3:54pmEarlier today in Monaco, the Intergovernmental Panel on Climate Change (IPCC) published its special report on the ocean and cryosphere in a changing climate – or “SROCC” for short.
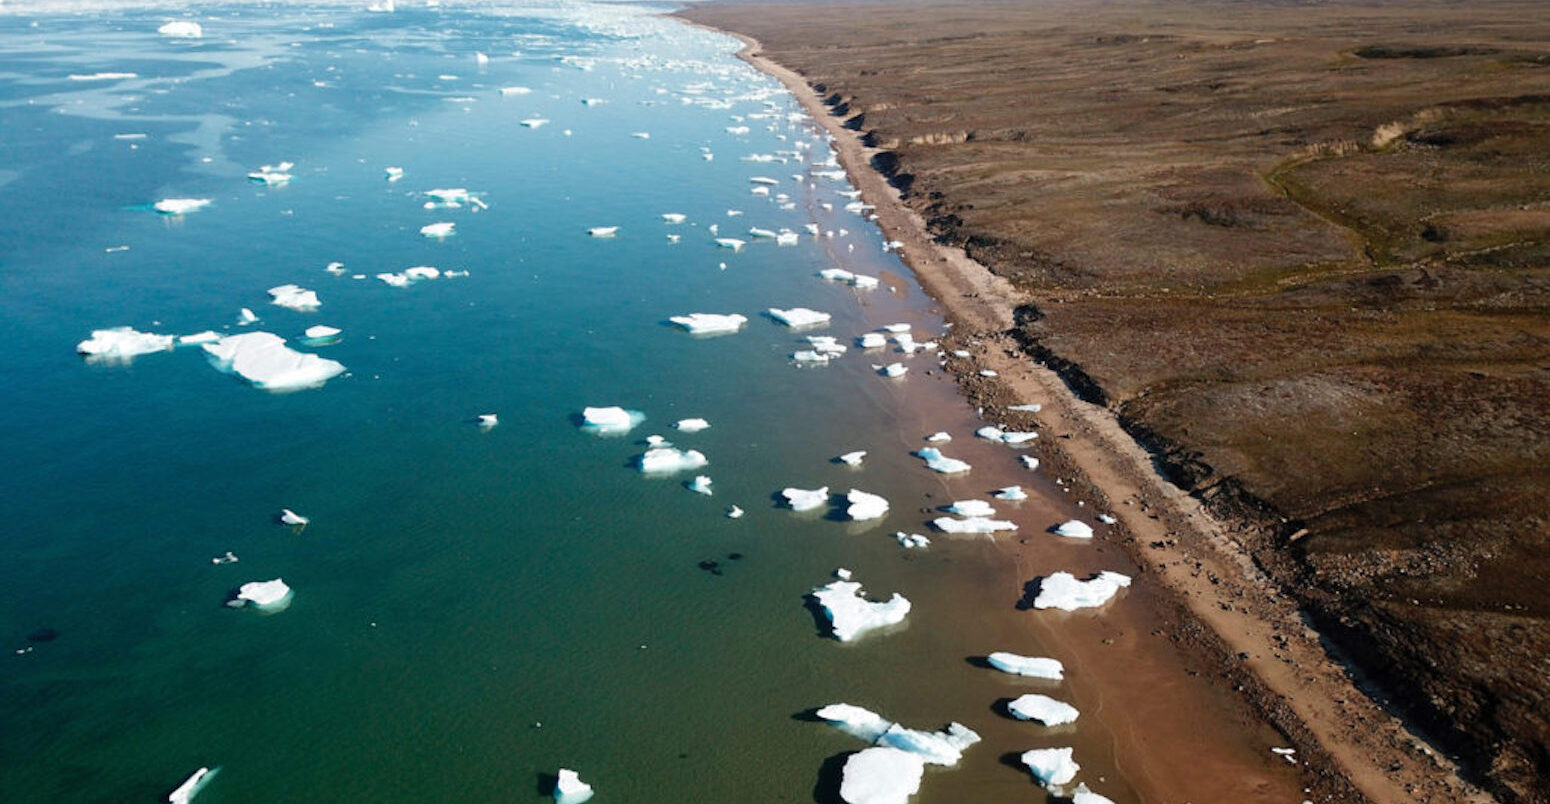
“All people on Earth depend directly or indirectly on the ocean and cryosphere,” the report warns, noting that “human communities in close connection with coastal environments, small islands, polar areas and high mountains are particularly exposed” to changes, such as sea level rise and melting glaciers.
It is “virtually certain” that the global ocean has warmed unabated since 1970, the report stresses, while “global warming has led to widespread shrinking of the cryosphere”.
These changes are increasingly pushing adaptation responses “to their limits”, with the most vulnerable people having “the lowest capacity” to respond. Sustainable development and climate change resilience depend “critically on urgent and ambitious emissions reductions coupled with coordinated sustained and increasingly ambitious adaptation actions”.
In this detailed Q&A, Carbon Brief unpacks what the report says about how climate change is affecting the Earth’s ice and oceans – and the wider impacts that is having on sea levels, marine life and human society, as well as extreme events and potential “tipping points”.
Each section below (click on hyperlinks to jump down) explains, in turn, all of the report’s key findings. They include…
- The need for this report:“Pervasive ocean and cryosphere changes…are already being caused by human-induced climate change.”
- High mountain areas: Glaciers could lose a fifth of their mass this century if emissions are low, and more than 80% in regions such as Central Europe.
- Sea ice: There is “very high confidence” that Arctic sea ice has declined in all months of the year and around half the summer loss is due to human-caused warming.
- Ice sheets: Greenland melt is unprecedented in at least 350 years. With rising Antarctic loss, ice sheets are now contributing 700% more to sea levels than two decades ago.
- Implications of polar warming: Polar bears are travelling further due to less ice, while Arctic peoples and marine life face rising negative impacts due to warming.
- Abrupt changes and ‘tipping points’: The AMOC ocean current that brings warm water to Europe may already have weakened by 15%, but is “very unlikely to collapse” this century.
- Permafrost: Arctic near-surface permafrost faces “widespread disappearance”, with a 30-99% decrease in area if emissions are very high, releasing 10s to 100s of billions of tonnes of CO2.
- Sea level rise: The rate is accelerating and is “unprecedented” over the past century. Worst-case projections are higher than thought and a 2m rise by 2100 “cannot be ruled out”.
- Impacts for coasts and islands: Warming could “drastically alter” migration flows. If emissions are high, some island nations are “likely” to become “uninhabitable” this century.
- Marine life: Marine mammals could decline by 15% and fisheries by a quarter this century, if emissions are very high, while “almost all coral reefs will degrade” even if emissions are low.
- Extreme events: Cyclones, marine heatwaves and other extremes are becoming more severe and will exceed the limits of adaptation, causing “unavoidable loss and damage”.
- Socioeconomic implications: Changes to oceans and the cryosphere will impede the UN’s sustainable development goals and could expand the range of disease threats.
Why did the IPCC produce this report?
The IPCC published its special report on the ocean and cryosphere in a warming climate at the end of a week-long approval plenary in Monaco. At this meeting, government delegates approved – line-by-line – the 42-page “summary for policymakers” (pdf), or “SPM”, overview report. The subsequent press conference was live-streamed on the internet. (For a summery of media coverage and other reaction see the “Reaction” section below.)
(For a full summary of the plenary negotiations, see the latest Earth Negotiations Bulletin by IISDRS.)
With the SPM agreed, the IPCC then also published (pdf) the “underlying technical assessment” report, which runs to six chapters and more than 800 pages – plus supplementary materials. The individual chapters are still subject to “trickle-back” changes, which are updates that need to be made to the full report to ensure it is consistent with the revised SPM.
The SROCC is the second special report that the IPCC has published this year and the third of the IPCC’s sixth assessment cycle. The report on climate change and land was released in August, while the 1.5C report was published in October 2018. The next special report will be on “climate change and cities”, which will be published during the seventh assessment cycle of the IPCC – and so will come after its sixth assessment report (AR6) in 2021-22.
The #IPCC plenary in Monaco concludes today with the approval of the Special Report on the Ocean and Cryosphere in a Changing Climate! 👏 Stay tuned for the #SROCC press release at 11am CEST tomorrow 🌊 🏔️ #ClimateChange #GlobalGoals pic.twitter.com/uT0vf1VAFc
— IPCC (@IPCC_CH) September 24, 2019
The land report was originally commissioned by the IPCC at an April 2016 meeting in Nairobi (pdf). A draft outline (pdf) for the report was subsequently adopted at a meeting in Guadalajara, Mexico, in March 2017.
The author team of coordinating lead authors, lead authors and review editors – selected in August 2017 – is made up of 103 experts from around the world. They have been supported by dozens of contributing authors on each chapter.
The special report “assesses new knowledge” since the IPCC’s fifth assessment report (AR5) – published in 2013-14 – and its 1.5C report. It covers “how the ocean and cryosphere have and are expected to change with ongoing global warming, the risks and opportunities these changes bring to ecosystems and people, and mitigation, adaptation and governance options for reducing future risks”.
The report says: “The literature used is primarily published, peer-reviewed scientific, social science and humanities research.” However, “in some cases, grey-literature sources (for example, published reports from governments, industry, research institutes, and non-government organisations) are used where there are important gaps in available peer-reviewed literature”.
In keeping with previous IPCC reports, the SROCC uses “calibrated language for the communication of confidence” in the assessment process. In other words, statements within the report are accompanied by qualitative expressions of “confidence” – based on the robustness of evidence for a finding – and quantitative expressions of “likelihood” to describe the likelihood of a finding. These statements can be found throughout the report, typically in brackets or italics.
The figure below, from chapter one (pdf) of the report, shows the five different levels of confidence.
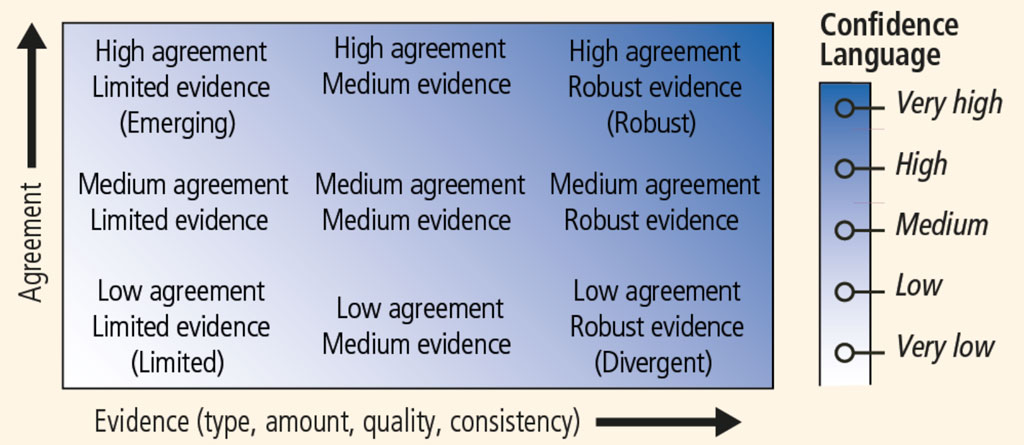
Schematic of the IPCC usage of calibrated language on confidence. Source: IPCC: Figure 1.4 (pdf)
And this table outlines the 10 levels of likelihood.
| Likelihood language | Statistical level (assessing change) | Statistical Range (assessing range) |
|---|---|---|
| Virtually certain | greater than 99% | |
| Extremely likely | greater than 95% | |
| Very likely | greater than 90% | 5-95% range |
| Likely | greater than 66% | 17-83% range |
| More likely than not | greater than 50% | 25-75% range |
| About as likely as not | 33-66% | |
| Unlikely | less than 33% | <17% and >83% (both tails) |
| Very unlikely | less than 10% | <5% and >95% (both tails) |
| Extremely unlikely | less than 5% | |
| Exceptionally unlikely | less than 1% |
The opening statement of the report says that “all people on Earth depend directly or indirectly on the ocean and cryosphere”. They fulfil “fundamental roles” in the Earth’s climate, such as “the uptake and redistribution of anthropogenic CO2 and heat by the ocean, as well as their crucial involvement in the hydrological cycle”.
The global ocean – comprising the Arctic, Pacific, Atlantic, Indian, and Southern oceans, as well as their marginal seas – covers 71% of the Earth surface, the report notes. It contains “about 97% of the Earth’s water, supplies 99% of the Earth’s biologically-habitable space, and provides roughly half of the primary production on Earth”.
The cryosphere refers to frozen components of the Earth system that are at or below the land and ocean surface. These include “snow, glaciers, ice sheets, ice shelves, icebergs, sea ice, lake ice, river ice, permafrost and seasonally frozen ground”, the report notes.
The oceans and cryosphere provide services including “food and freshwater, renewable energy, health and wellbeing, cultural values, trade, and transport”, the report says, but they “are also a source of hazards”.
The graphic below illustrates the key components and processes in the oceans and cryosphere.
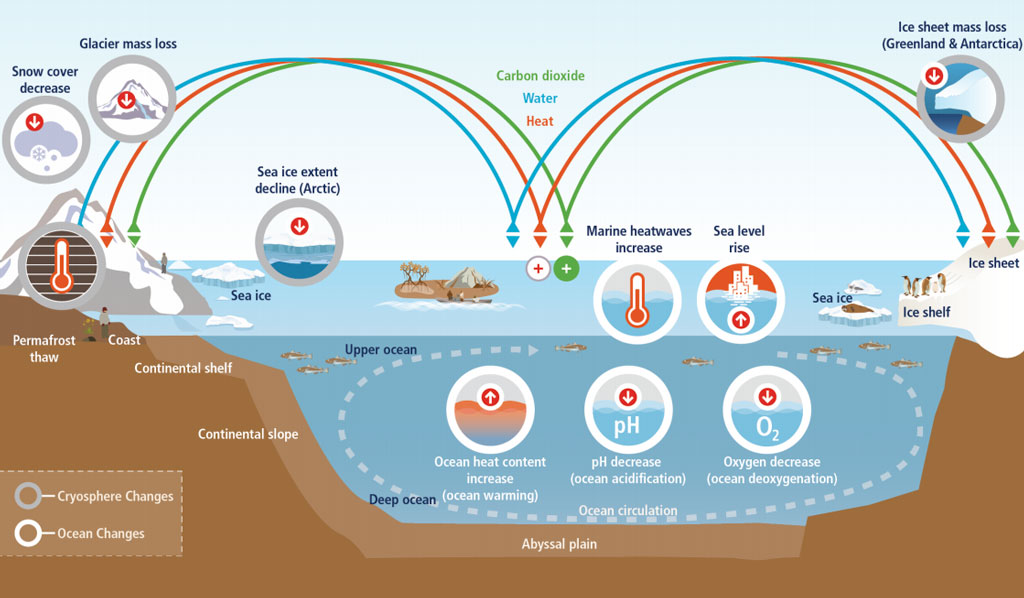
Schematic illustration of key components and changes of the ocean and cryosphere, and their linkages in the Earth system through the movement of heat, water, and carbon. Source: IPCC: Box 1.1, Figure 1 (pdf)
Communities living in close connection with polar, mountain and coastal environments are particularly exposed to the current and future hazards of ocean and cryosphere change, the report says. For example, almost 10% of the global population – around 670 million people – live in high mountain regions, while approximately four million people live in the Arctic. Coastal regions are home to many more, the report adds:
“Coasts are the most densely populated areas on Earth. As of 2010, 28% of the global population (1.9 billion people) were living in areas less than 100km from the coastline and less than 100m above sea level, including 17 major cities, which are each home to more than five million people. Small island developing states are together home to around 65 million people.”
Observations indicate “pervasive ocean and cryosphere changes…are already being caused by human-induced climate change” from the “high mountains, to the polar regions, to coasts and into the deep reaches of the ocean”.
If allowed to continue unabated, these impacts are projected to have huge costs. In monetary terms, for example, “declines in ocean health and services are projected to cost the global economy $428bn per year by 2050”, the report says, “and $1.979tn per year by 2100”.
The report finds – with “very high confidence” – that societies “will be exposed and challenged to adapt” even if current and future efforts to reduce greenhouse gas emissions manage to keep global warming well below 2C.
“Effective mitigation at a global scale will reduce the need and cost of adaptation, and reduce the risks of surpassing limits to adaptation,” the report says.
Hans-Otto Pörtner, Co-Chair of IPCC Working Group II, presenting the Special Report on the Ocean and Cryosphere in a Changing Climate #SROCC#climatechange #GlobalGoals pic.twitter.com/FJDvo4lNjJ
— IPCC (@IPCC_CH) September 25, 2019
Local mitigation and adaptation efforts, meanwhile, will have “limited effectiveness to mitigate climate change and reduce its consequences at the global scale”. However, they are still “useful to implement because they address local risks, often have co-benefits such as biodiversity conservation, and have few adverse side effects”.
The figure below summarises some of the mitigation and adaptation options available. It includes some negative emissions techniques (on the left-hand side). The report notes that “ocean-based CO2 removal at the global scale has potentially large negative ecosystem consequences”.
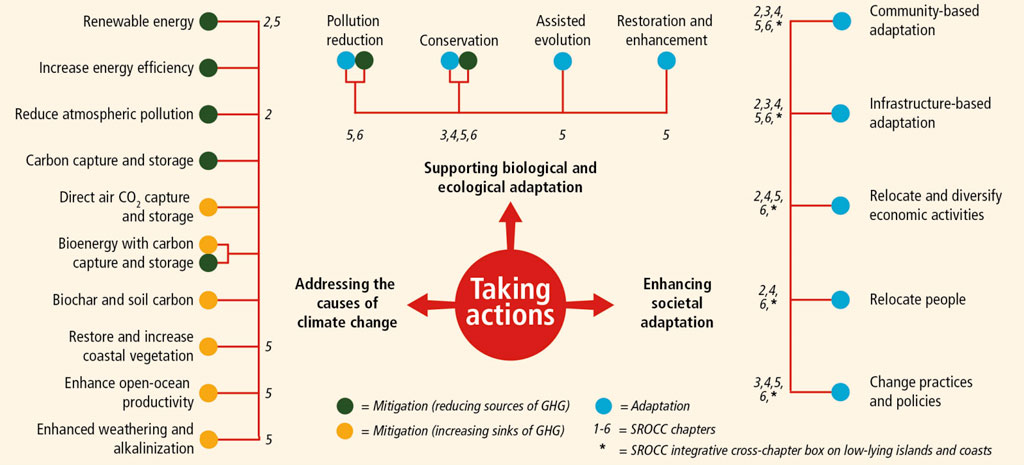
Overview of the main ocean-cryosphere mitigation and adaptation measures to observed and expected changes in the context of this report. Source: IPCC: Figure 1.2 (pdf)
What does the report say about high mountain areas?
High-mountain regions are home to around a tenth of the world’s population. Their glaciers, permafrost and snow cover means they are also the site of critical cryosphere changes. The IPCC report considers how cascading effects of global warming in these areas could impact everything from drinking water quality to the feasibility of the skiing industry.
Chapter two of the report describes how by the end of the century, glaciers are projected to lose around 18% of their mass compared to 2015 levels under a low-emissions scenario. This anticipated loss doubles to around a third under a high-emissions scenario.
The accompanying sea level rise resulting from these glacier losses is projected to be around 94mm and 200mm for the low-and high-emissions scenarios, respectively.
![]()
In non-polar regions with relatively little ice cover, such as Central Europe and North Asia, the projected outcomes are far more pronounced, according to the report, with on average more than 80% of their current glacier mass gone by 2100. As the chart below indicates, some glaciers could disappear completely over this timescale.
The report also reiterates the “high confidence” findings of the IPCC’s fifth assessment report (AR5) that due to a “pronounced imbalance” between current glacier mass and climate, glaciers will continue to melt even with no further climate change.
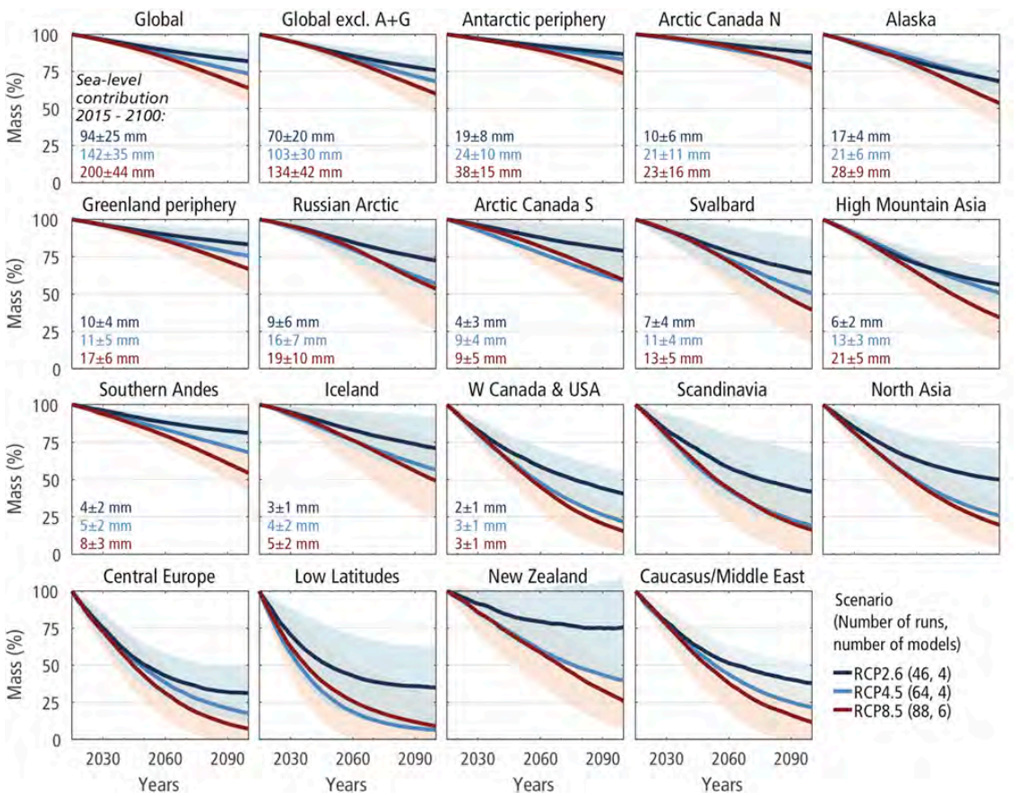
Projected changes in glacier mass between 2015 and 2100 under emission scenarios RCP2.6 and RCP8.5. Lines and shading refer the arithmetic mean ± standard deviation of 46 (RCP2.6) and 88 (RCP8.5) individual model runs from four to six glacier models forced each by data from five to 21 general circulation models (GCMs). Source: IPCC: Figure CB6.1 (pdf)
![]()
Shifts in glacier mass and snow cover are already affecting river runoff. Following a period of increased runoff due to more ice melting, scientists expect to see a turning point known as “peak water”, after which runoff declines (see chart below). The report notes there is robust evidence that in several regions this point has already passed.
Melting ice and snow presents a significant danger to the communities inhabiting mountain regions due to their interactions with natural disasters. The report says retreating glaciers and thawing permafrost have already destabilised mountain slopes and over the past few decades scientists have recorded an increase in “wet snow” avalanches (caused by snow becoming saturated with water). However, at lower elevations avalanches are projected to decline in number and distance covered.
Cryosphere-related landslides and floods are also a threat to people’s lives and infrastructure, according to the report, and without adequate adaptation strategies such natural disasters are likely to become more of a problem in the coming years. These events “will also emerge where there is no record of previous events”.
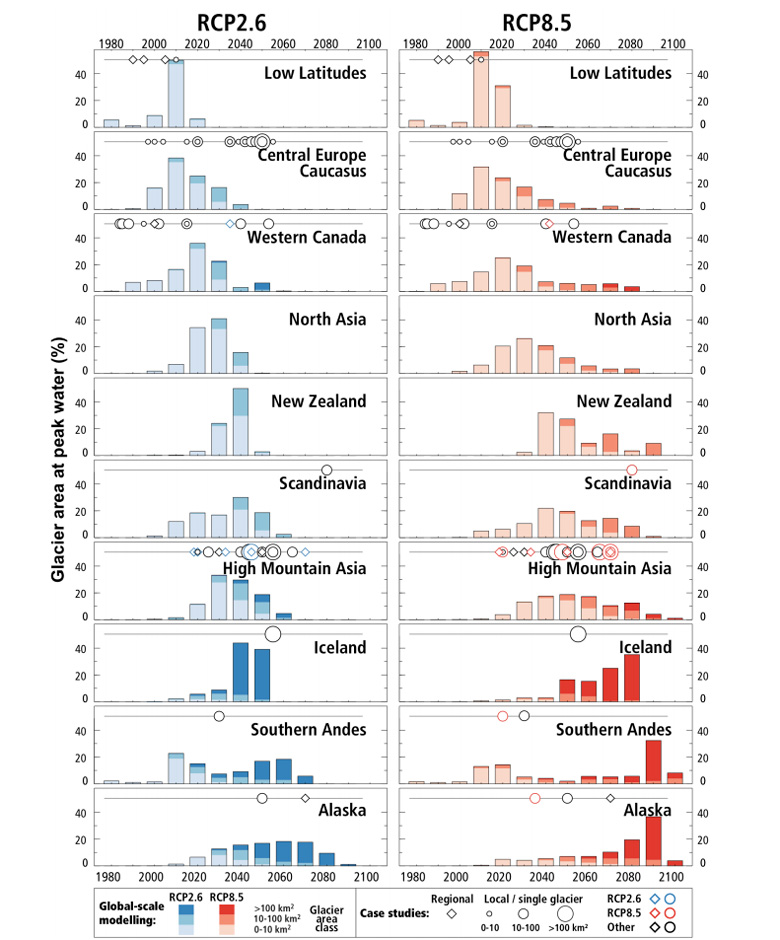
Timing of peak water from glaciers in different regions under two emission scenarios (RCP2.6 and RCP8.5). Peak water is the year when annual runoff from the a glacierised area will start to decrease due to glacier shrinkage after an initial period of melt-induced increase. Shadings of the bars distinguish different glacier sizes, indicating a tendency for peak water to occur later for larger glaciers. Source: IPCC: Figure 2.6 (pdf)
Aside from these serious risks, there are also wider issues being triggered by the decline in mountain ice. Societies depend on their mountains for a range of services, many of which are at risk of disruption as temperatures rise.
A key service is providing a source of drinking water. While the report notes there is “limited evidence” that glacier decline places increased risks on drinking water supply, such trends have been reported in rural areas in the Himalayas and the Andes.
There is also evidence such changes may drive a decline in water quality in some regions. Glaciers hold a significant store of toxic human-derived chemicals including DDT, heavy metals and black carbon, all of which could diminish drinking water quality in surrounding areas as they are released from the ice, the report says.
“Changes in water availability will not just affect people in these high mountain regions, but also communities much further downstream,” said Panmao Zhai, Co-Chair of IPCC Working Group I#srocc #climatechange #globagoals pic.twitter.com/sw85KDZXIv
— IPCC (@IPCC_CH) September 25, 2019
Hydropower, which contributes almost 100% of electricity generation in some mountainous nations, such as Albania and Peru, is also at risk due to changes in glaciers and snowmelt. Due to their dependence on water flow to produce power, the report says hydropower operations are “expected to be affected by changes in runoff from glaciers and snow cover”.
Despite this, it notes that “only a few organisations are incorporating current knowledge of climate change into their investment planning” for hydropower.
For farmers working in mountainous regions, including the tropical Andes and the Rocky Mountains, reductions in water available for irrigation have already been attributed to a decline in river runoff from higher elevations. The report notes this issue may be exacerbated in the future as rising air temperatures leave plants requiring more water to achieve optimum yields.
The report also considers the impact a changing climate will have on “cultural assets” provided by mountains, as well as tourism and recreation activities. Around the world, many local populations view mountains with reverence and often see glacial retreat as a sign of their “failure to show respect to sacred beings or to follow proper conduct”, the report notes. At the same time, shifts in ice cover can have lasting damage on regional economies, as the report explains:
“Current adaptation strategies, such as snowmaking to support ski tourism, are projected to be less effective in most parts of Europe, North America and Japan already at 1.5C global warming relative to the pre-industrial period, with effectiveness further reduced beyond 2C warming.”
This is linked to the wider issue considered in the report – the limits to adaptation for mountain communities as temperatures rise. It states that some populations, such as those occupying Peru’s Santa River drainage, have already seen declines that can be linked to cryosphere processes and notes that threats to habitability will likely increase in the decades to come.
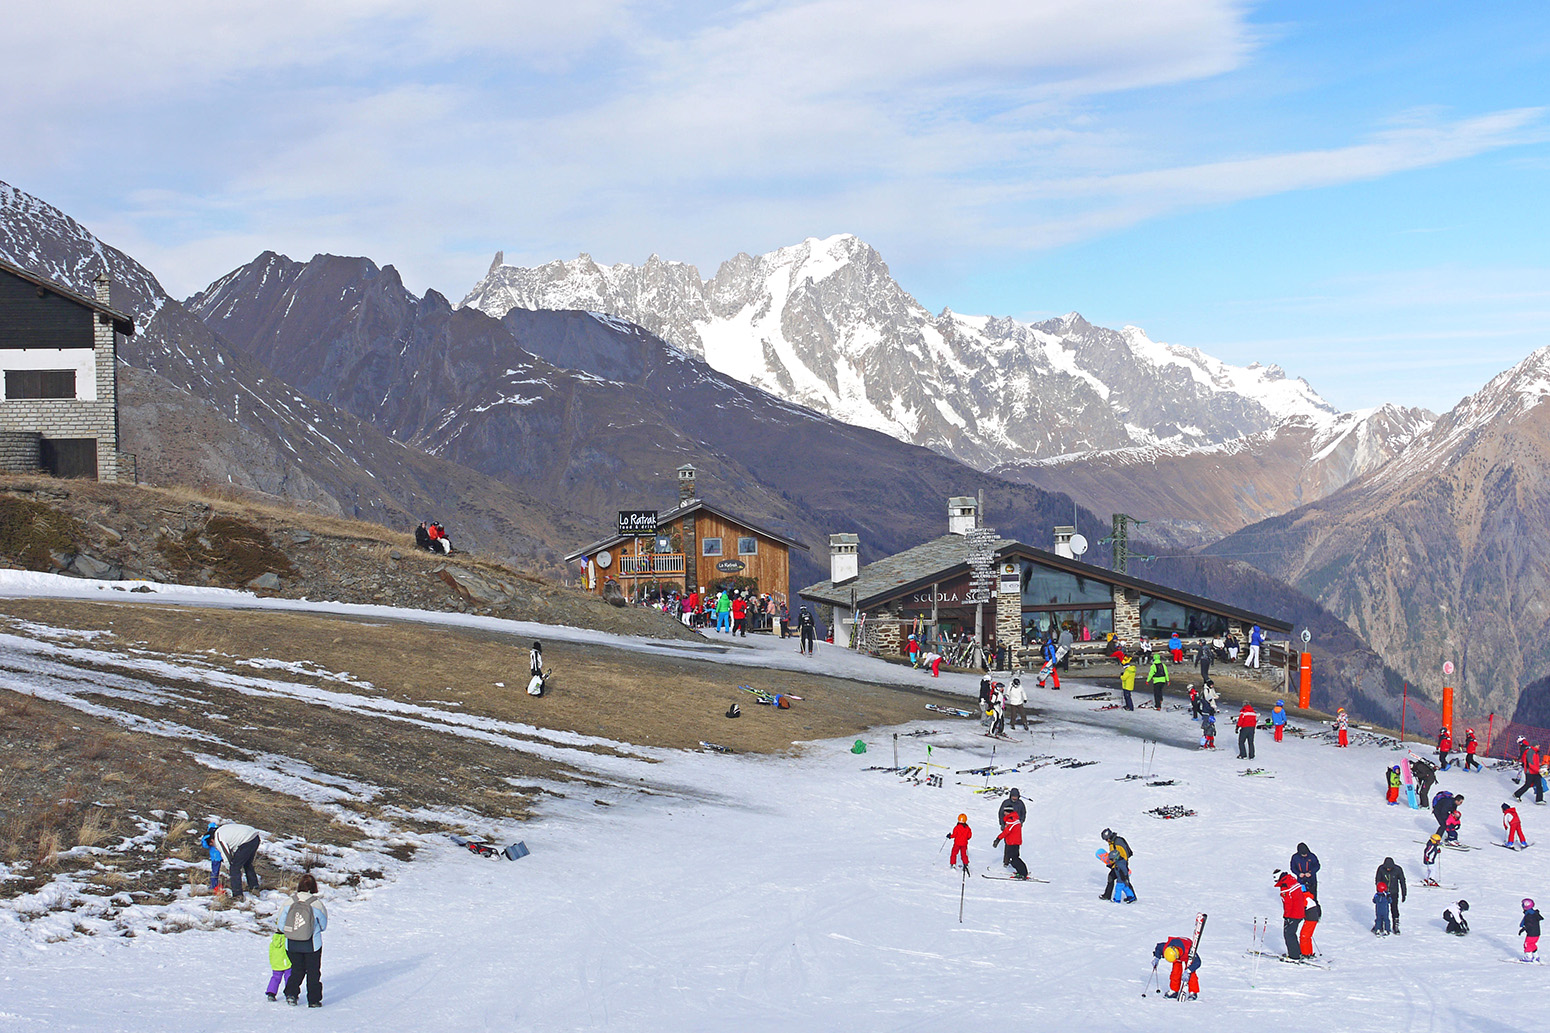
Lack of snow in La Thuile ski resort, Italy, December 2015. Credit: StockShot / Alamy Stock Photo.
Besides humans, changing conditions in high mountains are expected to have far-reaching consequences for alpine ecosystems. In many cases, studies suggest these changes are beneficial, at least in the short term. For example, scientists have found that overall biodiversity has increased at higher elevations due to more habitable areas being opened up by snow and ice retreating.
However, this comes at the expense of more specialist mountain-dwelling species, some of which are expected to decline in numbers. Animals that change their coat or plumage colour to white so as to stay hidden against the snow, such as hares and ptarmigans, have already seen their ranges contract.
How is climate change affecting sea ice at the Earth’s poles?
The special report is published in the same week that the Arctic sea ice annual minimum extent was announced as the joint second smallest on record. This annual milestone, reached at the end of summer each year, clocked in at 4.15m square kilometres (km2) on 18 September for 2019. This means 2019 is “effectively tied” with 2007 and 2016 as the second lowest on record, says the National Snow and Ice Data Center (NSIDC), behind only the record low of 3.39m km2 in 2012.
Scientists now have four decades of continuous satellite observations of polar sea ice. This evidence provides ”very high confidence” that Arctic sea ice extent “has declined in all months of the year” since 1979. In other words, pick any month of the year, in any season, and Arctic sea ice extent today is smaller than it was when satellite observations began.
Arctic sea ice losses are largest in late summer, the report notes, with September sea ice extent declining by 83,000 km2 per year between 1979 and 2017, a decline of 13% per decade compared to the 1981-2010 average. Equivalent declines in late winter show a loss of 41,000 km2 per year for the month of March, which is approximately 3% per decade relative to 1981-2010.
Sea ice in the Arctic is also starting to melt earlier after the winter and melting for longer in the year, the report says:
“There is high confidence that the Arctic sea ice melt season has extended by three days per decade since 1979 due earlier melt onset, and seven days per decade due to later freeze-up.”
Reconstructions of Arctic sea ice cover back to 1850 using ship reports, aeroplane surveys and other sources “shows that Arctic ice loss over the past two decades is likely unprecedented in at least 150 years”.
Arctic sea ice is also generally younger, the report says, noting that ice “at least five years old declined from 30% to 2% between 1979 and 2018”. It adds: “Over the same period, first-year sea ice proportionally increased from approximately 40% to 60–70%.”
The report also says that there is “very high confidence” that “Arctic sea ice has thinned through volume reductions”. Data from multiple satellite missions show declines in Arctic Basin ice thickness from 2000 to 2012 of almost 60cm per decade, the report adds, noting that “there is emerging evidence that this sea ice volume loss may be unprecedented over the past century”.
“Approximately half of the observed Arctic summer sea ice loss” is down to human-caused climate change, the report says, with the remainder being caused by natural variability.
The report has “high confidence” that Arctic surface air temperatures over the past two decades have “increased at more than double the global average”. It says:
“Attribution studies show the important role of anthropogenic increases in greenhouse gases in driving observed Arctic surface temperature increases, so there is high confidence in projections of further Arctic warming.”
This rapid phenomenon is known as “Arctic amplification”, the report notes. In part, it stems from the rapid loss of sea ice cover in the region. As Arctic sea ice diminishes, energy from the sun that would have been reflected away by the bright white ice is instead absorbed by the ocean, causing further warming.
Arctic surface sea temperatures have also continued to warm, the report says:
“August trends for 1982–2017 reveal summer mixed layer temperatures increasing at about 0.5C per decade over large sectors of the Arctic basin that are ice-free in summer.”
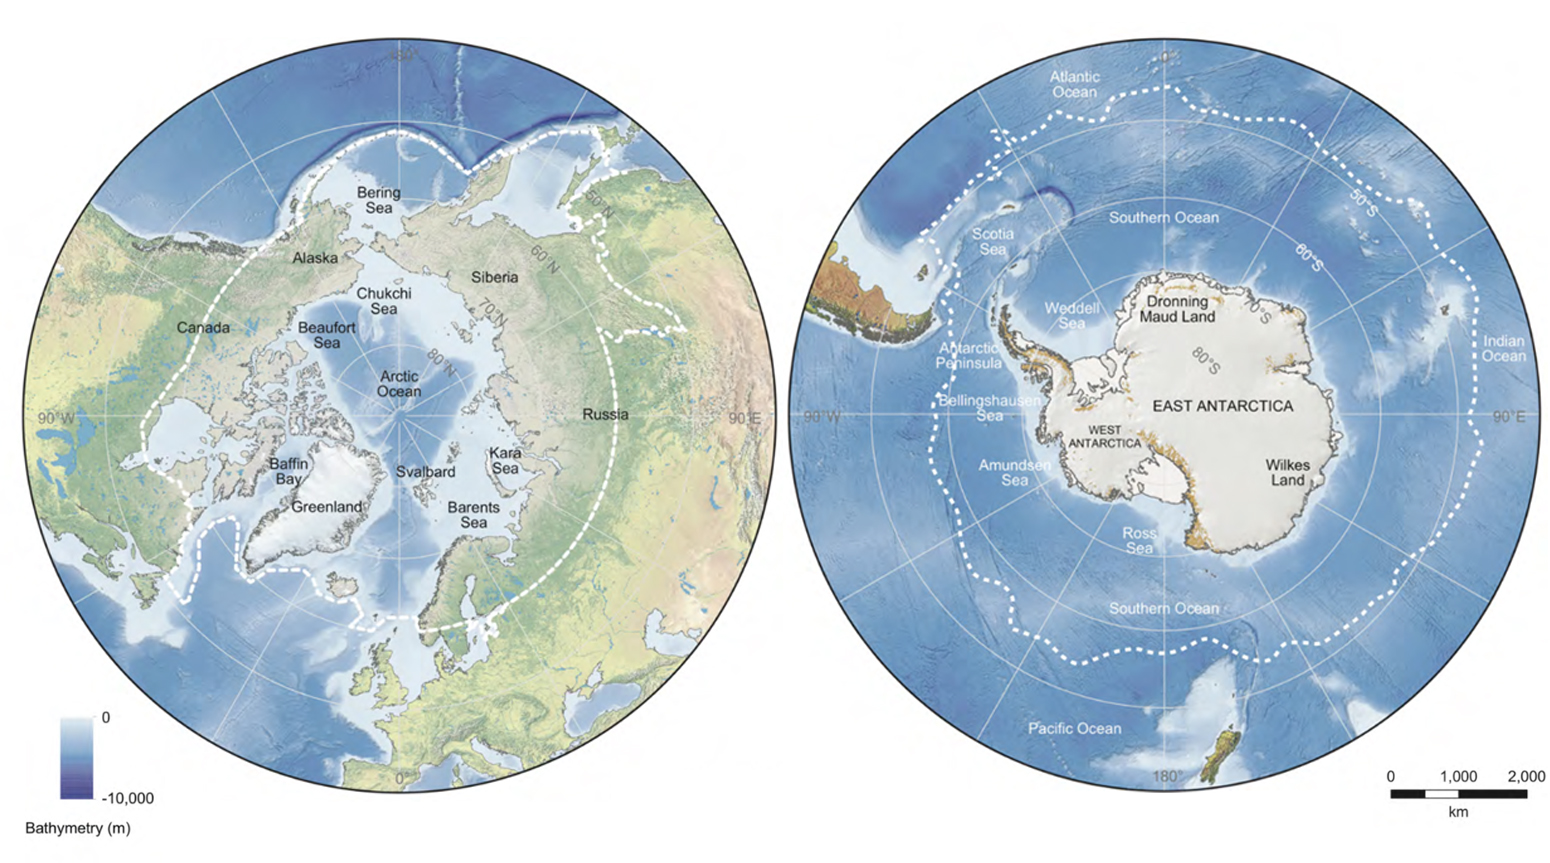
Map of the Arctic (left) and Antarctic (right) polar regions. Various place names referred to in the text are marked. Dashed lines denote approximate boundaries for the polar regions. Source: IPCC: Figure 3.2 (pdf)
In contrast to the Arctic, the Antarctic continent has seen “less uniform [air] temperature changes over the past 30-50 years”, the report says, “with warming over parts of West Antarctica and no significant overall change over East Antarctica”. However, there is “low confidence” in these trends, “given the sparse in situ records and large large interannual to interdecadal variability”.
The Southern Ocean – which is “important for the transfer of heat from the atmosphere to the global ocean, including heat from anthropogenic warming” – accounted for “~75% of the global ocean uptake of excess heat during 1870-1995”. Since around 2005, scientists have used Argo floats to collect data on ocean heat. These indicate that “the heat gained by the Southern Ocean south of 30 degrees south [between 2005 and 2017] was 45-62% of the global ocean heat gain”.
“Multi-decadal warming of the Southern Ocean has been attributed to anthropogenic factors, especially the role of greenhouse gases but also ozone depletion,” it notes.
Antarctic sea ice has shown “no significant trend over the period of satellite observations”, the report says:
“A significant positive trend in mean annual ice cover between 1979 and 2015 has not persisted, due to three consecutive years of below-average ice cover (2016-2018) driven by atmospheric and oceanic forcing.”
“The overall Antarctic sea ice extent trend is composed of near-compensating regional changes,” the report notes, “with rapid ice loss in the Amundsen and Bellingshausen seas counteracted by rapid ice gain in the Weddell and Ross seas”.
There are multiple factors that contribute to this regional variability in Antarctic sea ice extent, the report says. A key influence is the “meridional winds”, which flow north-to-south or vice versa:
“Poleward wind trends in the Bellingshausen Sea push sea ice closer to the coast and advect warm air to the sea ice zone, and the reverse is true over much of the Ross Sea.”
Longer records indicate – with “medium confidence” – that “there has been a decrease in overall Antarctic sea ice cover since the early 1960s”, but “this decline is too modest to be separated from natural variability”.
Climate model simulations suggest that human-caused warming at the surface in Antarctica “is delayed by the Southern Ocean circulation, which transports heat downwards into the deep ocean”, the report says. This, and other factors, “may explain the weak response of Antarctic sea ice cover to increased atmospheric greenhouse gas concentrations compared”. However, the low sea ice cover since 2016 suggests that “there is still potential for longer-term changes to emerge in the Antarctic, similar to the Arctic”.
![]()
The maps below show observed changes for 1982−2017 in sea surface temperature (SST, first and third columns) and sea ice (second and fourth columns) for the Arctic (top row) and Antarctic (bottom row). The four maps to the left show data for March and the four to the right show data for September). The shading indicates warm (red) and cool (blue) SSTs and increases (green) and decreases (yellow/brown) in sea ice. The charts beneath the maps show satellite observations (black line), model reconstructions (green) and projections for the 21st century under RCP2.6 (blue), RCP4.5 (orange) and RCP8.5 (red).
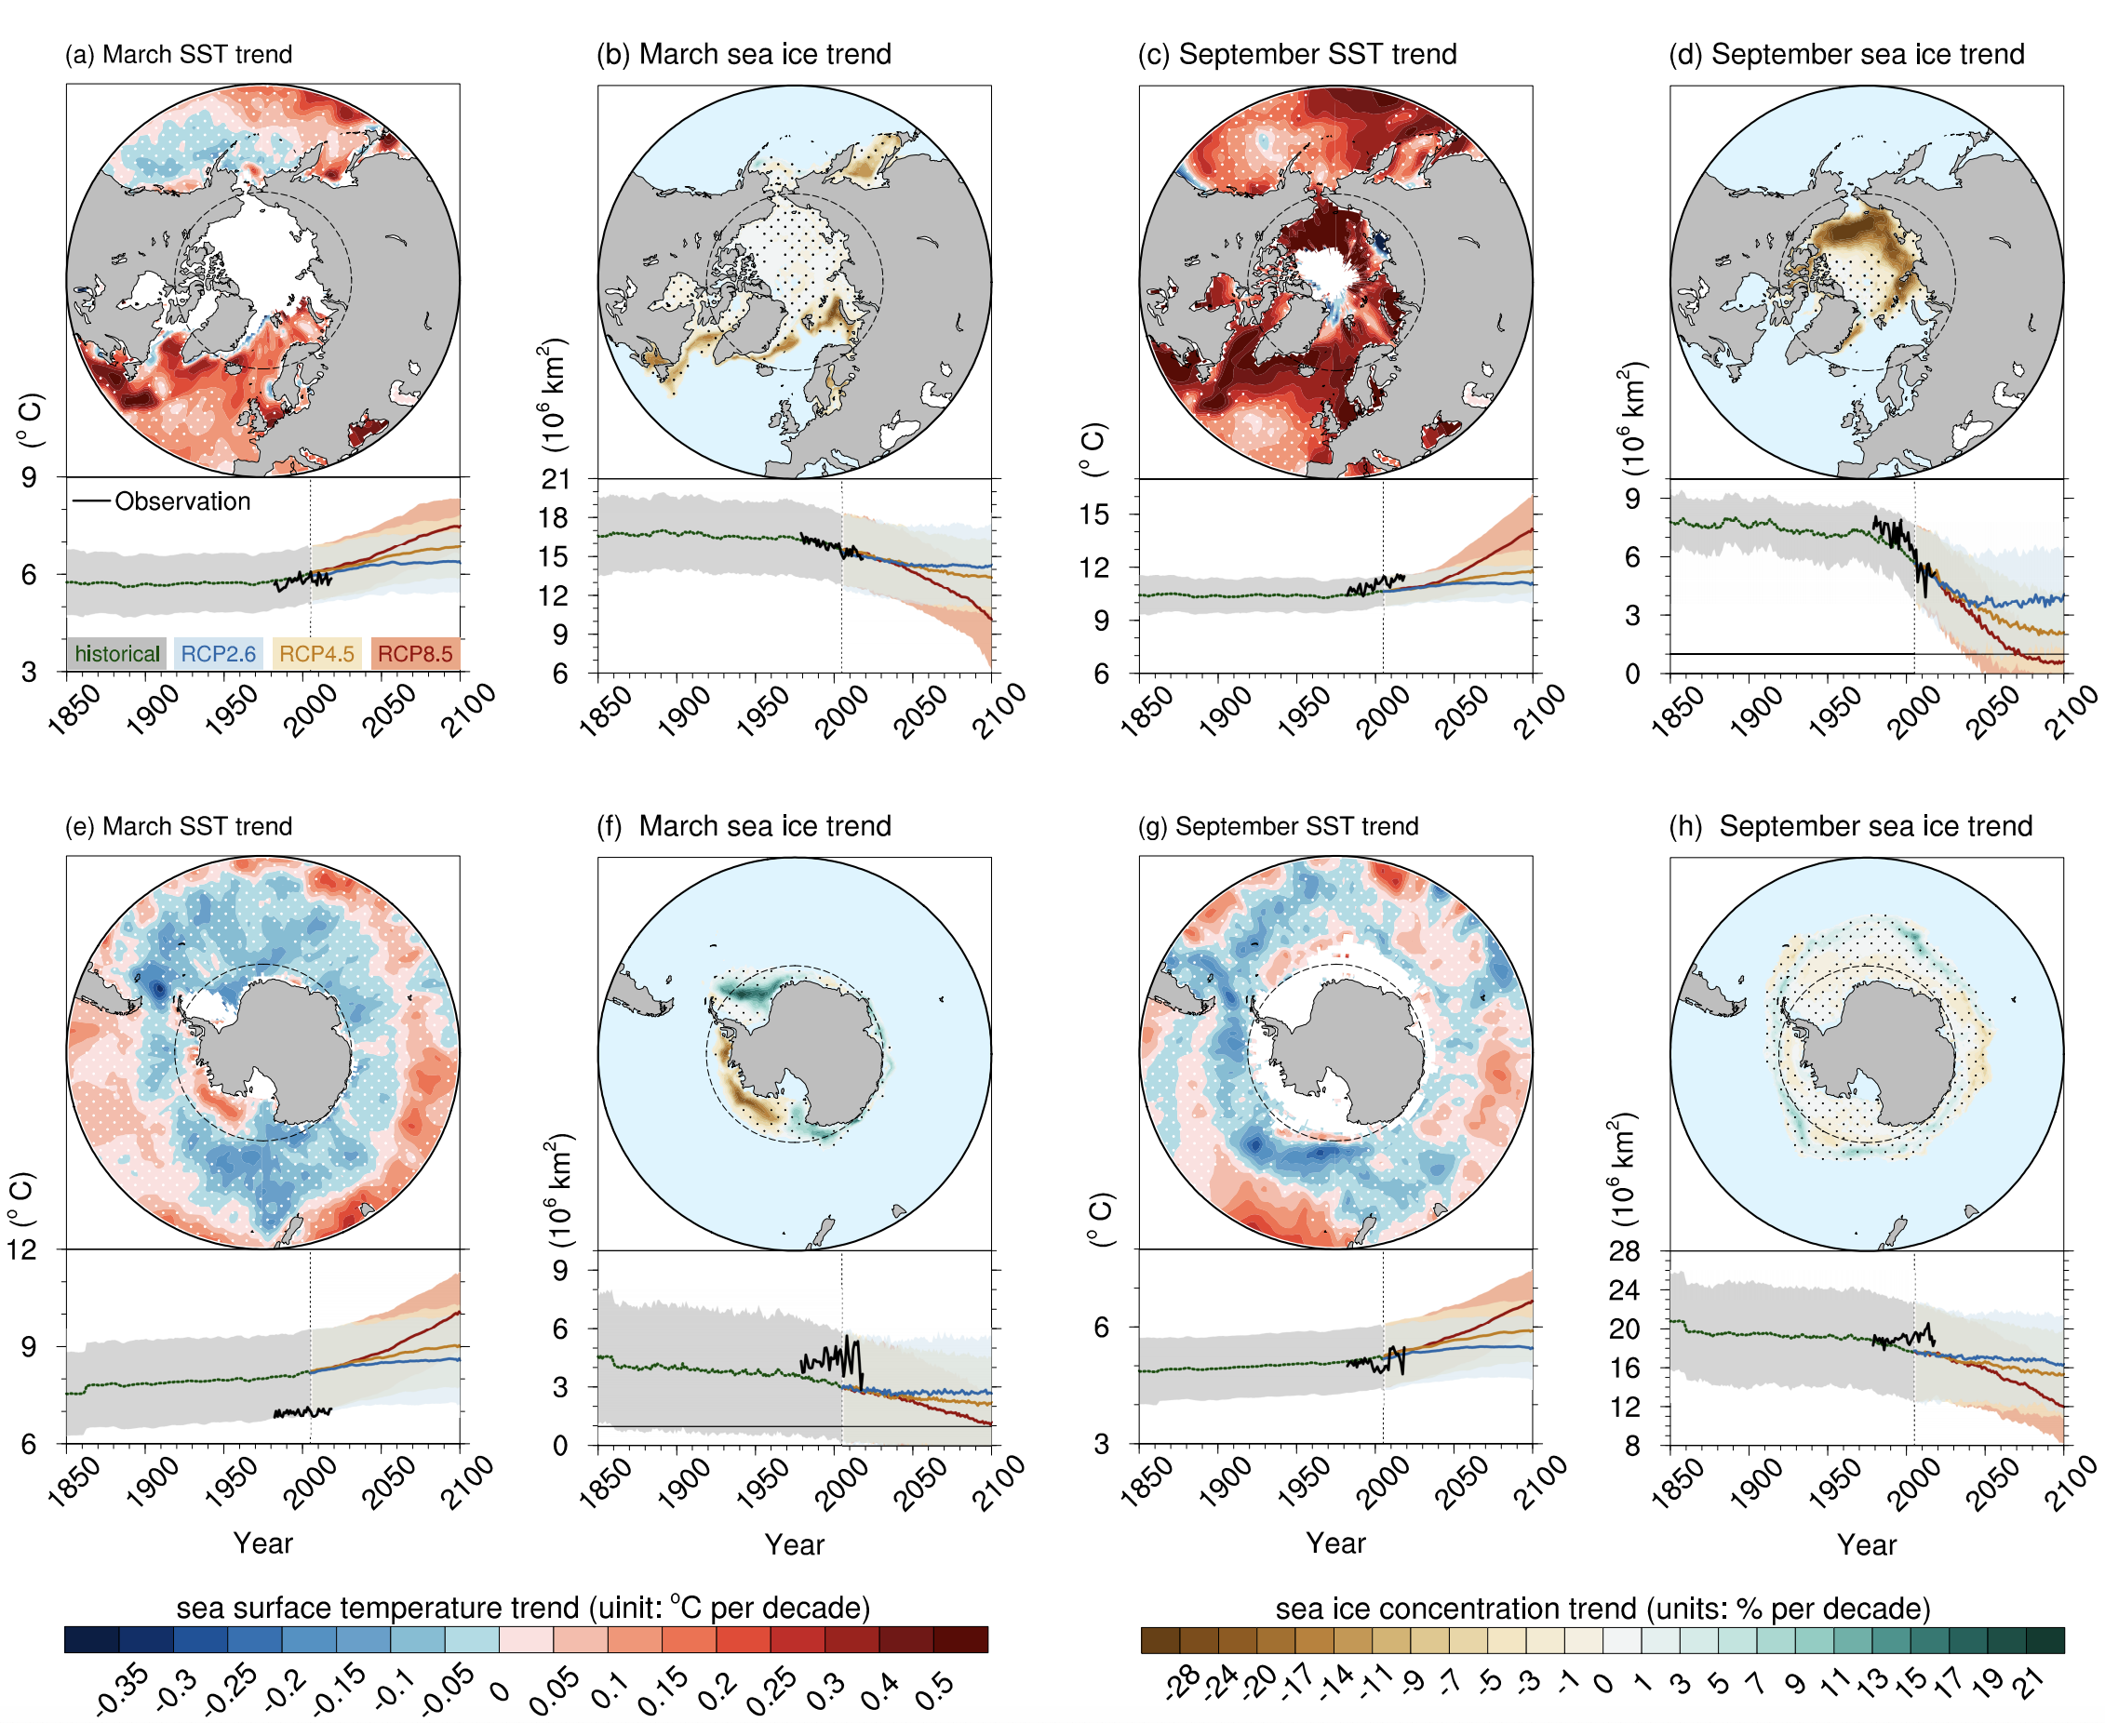
Maps of linear trends (in degrees C per decade) of Arctic (a, c) and Antarctic (e, g) sea surface temperature (SST) for 1982−2017 in March (a, e) and September (c, g). Maps (b, d, f, h) show the same as (a, c, e, g), but for the linear trends of sea ice concentration (in % per decade). Stippled regions indicate the trends that are statistically insignificant. Dashed circles indicate the Arctic/Antarctic Circle. Beneath each map of linear trend shows the time series of SST (area-averaged north of 40N/south of 40S) or sea ice extent in the northern/southern hemisphere. Black, green, blue, orange, and red lines indicate observations, CMIP5 historical simulation, RCP2.6, RCP4.5, and RCP8.5 projections respectively; shading indicates +/- standard deviation of multi-models. Source: IPCC: Figure 3.3 (pdf)
Climate models project “continued declines in Arctic sea ice through the end of the century”, the report says. Because of natural variability, model limitations and uncertainty about future emissions, there is “a large spread in the timing of when the Arctic may become ice free in the summer, and for how long during the season”.
If warming is held to 1.5C, “sea ice in September is likely to be present at end of century with an approximately 1% chance of individual ice-free years”. However, after a decade in a 2C warmer world “more frequent occurrence of an ice-free summer Arctic is expected (around 10-35%)”. It adds that “a temporary temperature overshoot of a given warming target has no lasting impact on ice cover”.
There is “low confidence in projections of Antarctic sea ice” because “there are multiple anthropogenic forcings (ozone and greenhouse gases) and complicated processes involving the ocean, atmosphere, and adjacent ice sheet”.
The report also has a section – Box 3.2 – that discusses how the decline in Arctic sea ice could have knock-on impacts for weather extremes at lower latitudes. This has “emerged as a societally important topic” since the publication of the IPCC’s fifth assessment report (AR5) “because hundreds of millions of people can potentially be impacted”.
“There is only low-to-medium confidence in the current nature of Arctic/mid-latitude weather linkages because conclusions of recent analyses are inconsistent,” the report concludes.
For example, “considerable literature exists on the potential for cold episodes in eastern Asia from sea ice loss in the Kara Sea”. And “there is some analysis of cases between change in the Chukchi Sea and west of Greenland, and cold events in eastern North America”. “Such connections, however, are only episodic,” the report stresses. Similarly, while “there is evidence of an increase in the frequency of weak polar vortex events, studies do not show increases in the number of mid-latitude cold events in observations or model projections”, says the report. As a result, these events “are not separable from natural variability, and so cannot be attributed to greenhouse-gas forced sea ice loss”.
How are the Earth’s ice sheets responding to warming?
The report states that polar regions will be “profoundly different” in the future compared with today. One key example of this is the decline of the Greenland and Antarctic ice sheets.
In chapter three, it concludes that at both poles it is “extremely likely” the rapid loss of ice has been increasing up to the present day, with the Greenland ice sheet currently losing mass at around twice the rate of its Antarctic counterpart.
Melting in Greenland has increased to a level that is unprecedented for at least 350 years and up to five times greater than the level seen in preindustrial times, according to the report.
Between 2012 and 2016, the region lost around 247Gt of ice every year. This is “extremely likely to be greater” than from 1992 to 2001, the report says, which gives estimated losses of 8Gt per year, albeit with a very large range of plus/minus 82Gt.
The report also notes that, between 2005 and 2016, this ice sheet was the largest terrestrial contributor to global sea level rise. While over the last century, glaciers have been the main contributors to changing sea levels, the authors note that “over the 21st century and beyond” it will be the polar ice sheets driving these changes.
Greenland’s rapidly vanishing ice is the result of a “combined increase in dynamic thinning and a decrease in surface mass balance (SMB) (for more information on how Greenland ice sheet loses mass, read Carbon Brief’s recent guest post on its state in 2019).
Since comprehensive measurements began in 1992, the report states it is “virtually certain” that the Antarctic peninsula and the West Antarctic ice sheet have lost mass, with the rate of loss increasing around 2006. It compares the rate of loss between 2012 and 2016, which stood at around 199Gt of ice per year with the rate of loss from 1992 to 2001, which was estimated to be 51Gt per year, although again with a large range of plus/minus 73Gt.
Ice loss in the Antarctic region is dominated by warm ocean waters driving the retreat and rapid thinning of major outlet glaciers in the West Antarctic ice sheet.
The East Antarctic ice sheet, by comparison, has remained “close to balance”, with satellite records showing no clear trend in mass changes. However, the Totten glacier, one of the region’s largest outlets, has begun to retreat in recent decades. The report suggests this means the ice sheet “could become a substantial contributor to future sea level rise”.
Taken together, the report says the combined sea-level rise contribution from both ice sheets was around 1.2mm each year between 2012 and 2016, a 700% increase from two decades previously.
The report discusses the difficulty in filtering out the natural and human drivers that contribute to atmospheric and ocean circulation changes which, in turn, drive the melting of ice sheets. While evidence exists for an anthropogenic role in Greenland ice loss (albeit, pending “formal attribution testing”), the report states there is more uncertainty when it comes to separating out human and natural forces in Antarctica:
“Along with the effects of greenhouse gas increases and stratospheric ozone depletion, atmospheric and ocean variability in the areas of greatest Antarctic ice sheet mass change are affected by a complex chain of processes that exhibit considerable natural variability and have multiple interacting links to sea surface conditions in the Pacific and Atlantic, with additional local feedbacks.”
Despite the clear trends in ice loss and sea level rise, the IPCC authors also emphasise the uncertainty that still exists when scientists attempt to project future changes in these polar regions:
“Our understanding of ice sheets has progressed substantially since AR5, although deep uncertainty remains with regard to their potential contribution to future sea level rise, especially on time scales longer than a century. This is particularly true for Antarctica.”
Sea level rise projections have increased by 10cm under the high-emissions RCP8.5 scenario in 2100 and this is the result of more ice being lost from the Antarctic ice sheet. (See Carbon Brief’s recent explainer on sea level rise for more information.)
Nevertheless, the authors note in their SPM that most of the uncertainty in their projections for the end of the century arise from ice sheets.
The reason for this uncertainty, according to the report, is that “ice sheet models lack realistic representations of some of the underlying physical processes” beyond the 21st century.
One such area of significant concern and uncertainty for those monitoring polar ice sheets is the prospect of “marine ice sheet instability” in parts of Antarctica – the point beyond which underwater melting of ice sheets becomes self-sustaining and out of control.
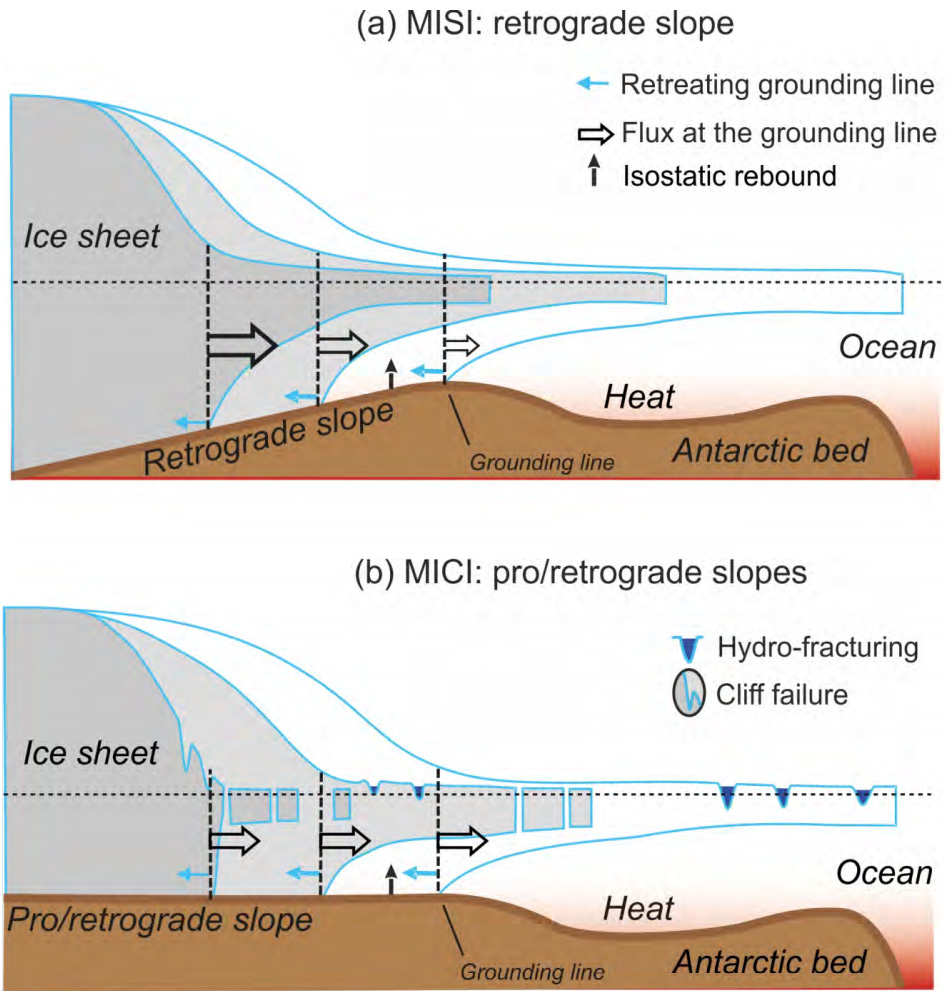
Representation of Marine Ice Sheet Instability (a) and Marine Ice Cliff Instability (b). In (a) thinning of the buttressing ice shelf leads to acceleration of the ice sheet flow and thinning of the marine-terminated ice margin. Bedrock under the ice sheet is sloping towards its interior, meaning thinning of the ice causes retreat of the grounding line and an increase in seaward ice flux, further thinning of the ice margin, and further retreat of the grounding line. In (b), disintegration of the ice shelf due to bottom melting and/or hydro-fracturing produces an ice cliff. If the cliff is tall enough, the stresses at the cliff face exceed the strength of the ice, and the cliff fails structurally in repeated calving events. Source: IPCC: Figure CB8.1 (pdf)
Another potential factor highlighted in the report is “marine ice cliff instability”, a hypothetical process by which vanishing ice leaves behind frozen cliffs that collapse into the ocean. It notes that this idea “remains unproven” and is characterised by “deep uncertainty”.
The report concludes there is “limited evidence and high agreement” that recent Antarctic ice sheet melting could be “irreversible over decades to millennia”.
In the SPM, the authors note “considering the consequences of sea level rise that a collapse of parts of the Antarctic Ice Sheet entails, this high impact risk merits attention”.
What are the wider implications of changes at the Earth’s poles?
Warming air and sea temperatures coupled with the losses of sea and land ice will have widespread impacts on polar regions. For the Arctic, the report says:
“Climate change is projected to alter the distribution and properties of Arctic marine habitats with associated implications for species composition, production and ecosystem structure and function.”
For example, declines in sea ice and freshening of surface waters has contributed to blooms in phytoplankton (tiny marine plants) occurring earlier in the year and even happening in autumn – “a phenomenon rarely observed in Arctic waters previously”.
Since AR5, “additional evidence shows climate induced physical and biogeochemical changes are impacting, and will continue to impact, the distribution and production of marine fish” in the Arctic.
“Higher temperature and changes in the quality and distribution of prey is already affecting marine fish,” the report states. This is having a mixed impact on different species. For example, warmer waters in the northern Barents Sea “have expanded suitable feeding areas for boreal/subarctic species and has contributed to increased Atlantic cod”. However, Arctic species, such as polar cod, “are expected to be affected negatively” as a result of “a shortened ice-covered season…increased predatory pressure, reduced prey availability, and impaired growth and reproductive success”.
In short, the division between Arctic and sub-Arctic species is expected to become “more diffuse” in a warming climate and cold-adapted species such as polar cod are likely to do worse as a result.
The Arctic is home to a multi-billion dollar fishing industry, the report says, as well as having “considerable cultural, economic, and subsistence importance to local communities”. Although some fisheries are “resilient to changing environmental and market drivers…climate change will affect the spatial distribution and productivity of some commercially-important marine fish and shellfish”.
Recent studies in the Bering Sea suggest that “future fish production will also depend on how climate change and ocean acidification will alter the quality, quantity and availability of suitable prey, the thermal stress and metabolic demands of resident fish; and species interactions”. This suggests “that the future of commercial fisheries in Arctic regions is uncertain”, the report concludes.
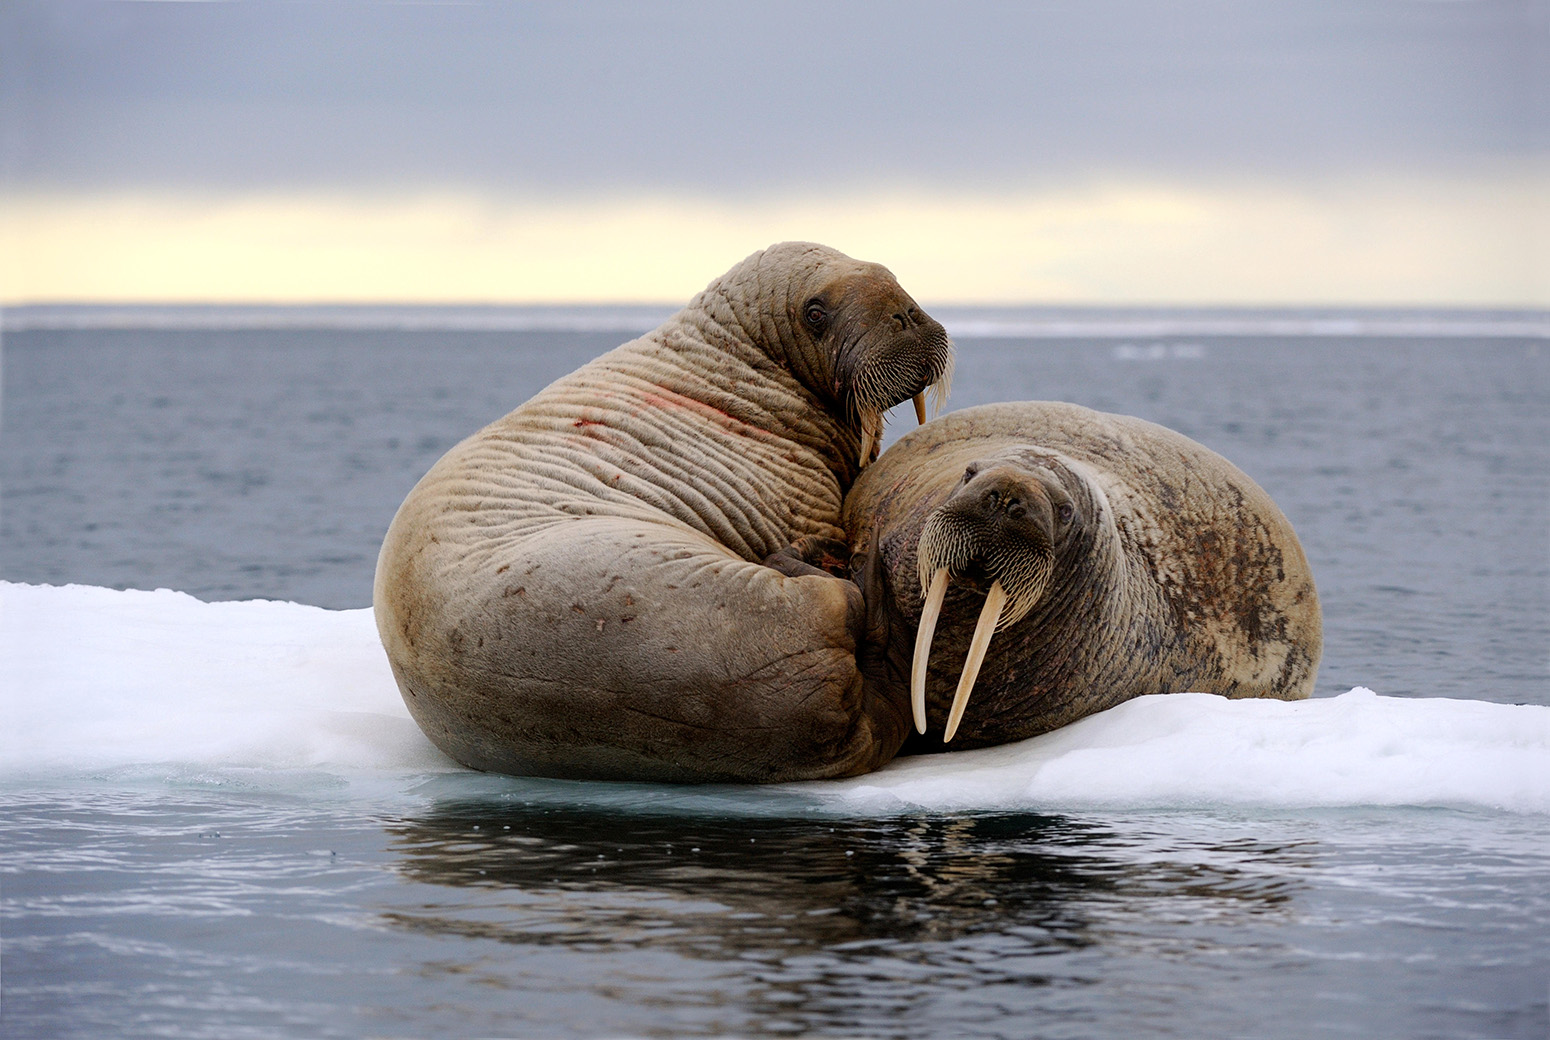
Walrus in Foxe Basin, Canada. Credit: Nature Picture Library / Alamy Stock Photo.
Marine mammals and seabirds are also being affected, the report says, even though many species can adapt by shifting their range, prey preferences or migration patterns. In some cases, changing behaviour has negative impacts, the report says, noting that “increased mortality rates of walrus calves have been observed during on-shore stampedes of unusually large herds” because of decreased sea ice.
Sea ice changes have been linked to “changes in distribution, denning, foraging behaviour and survival rates of polar bears”, the report says:
“Less ice is also driving polar bears to travel over greater distances and swim more than previously both in offshore and in coastal areas, which can be particularly dangerous for young cubs.”
Overall, changes in sea ice patterns are driving demographic changes in polar bears, the report states, “including declines in some populations, while others are stable or increasing”. This reflects the protective management measures that “have been successful in allowing severely depleted populations to recover”, the report notes, or “because new food sources, such as carrion, are becoming available to polar bears in some regions”.
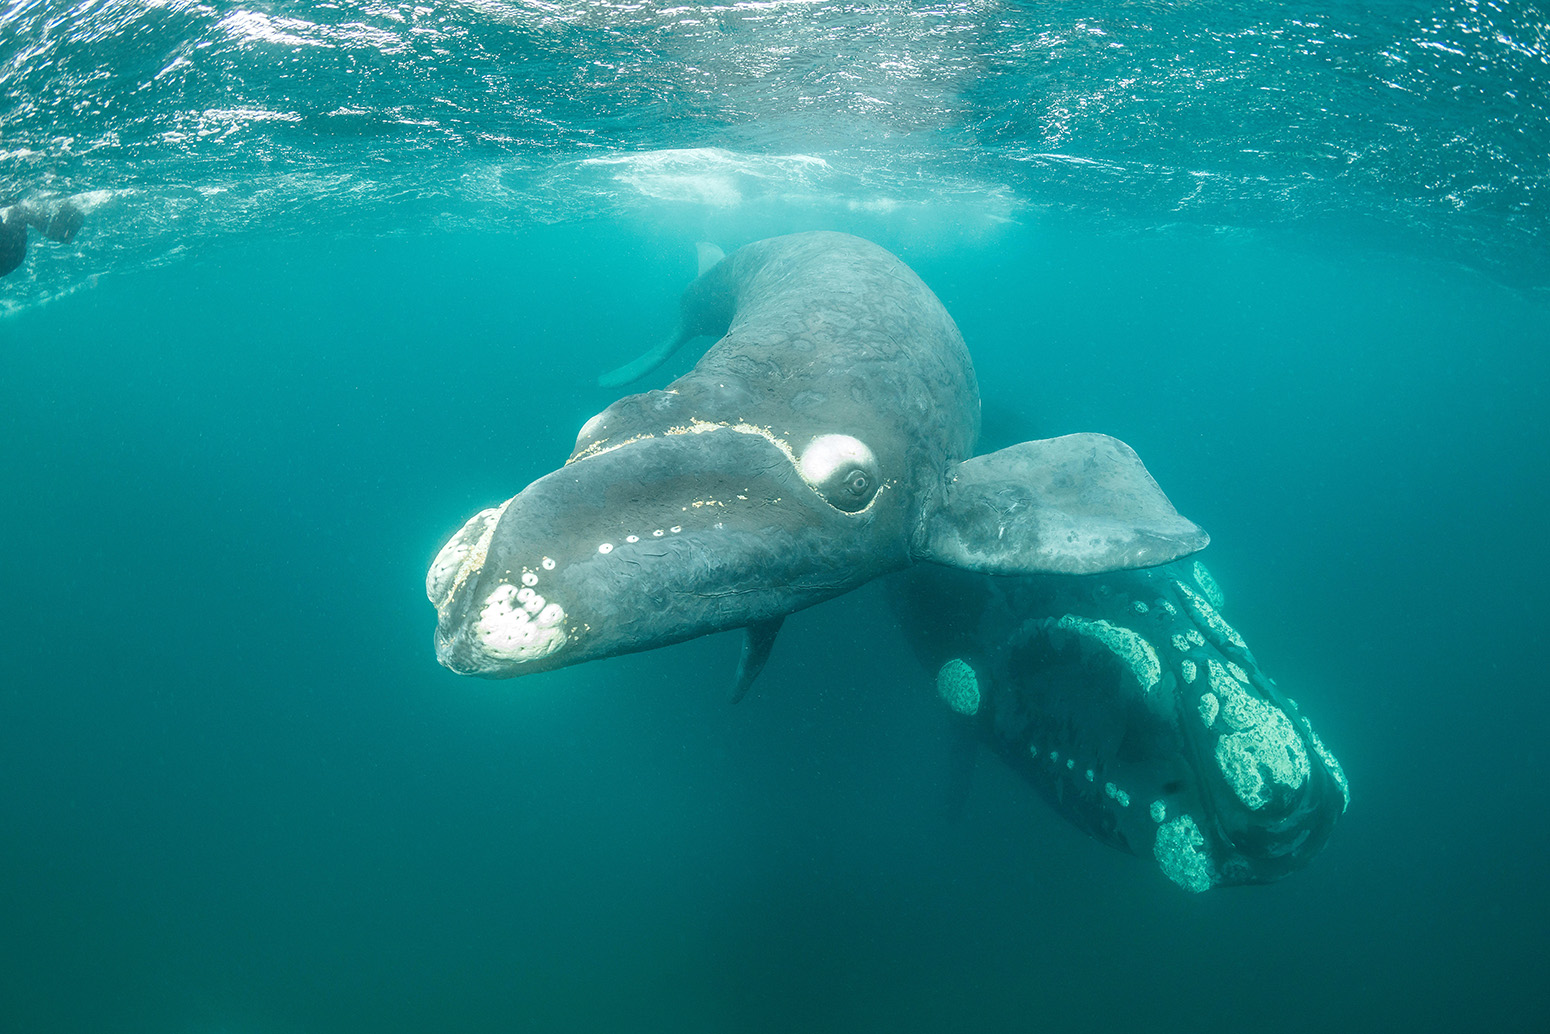
Southern right whale and her calf, Valdes Peninsula, Argentina. Credit: Wildestanimal / Alamy Stock Photo.
For the Southern Ocean, the report notes that Antarctic krill “play a central role in Southern Ocean food webs as grazers and as prey items for fish, squid, marine mammals and seabirds”. However, “the optimum conditions for krill are predicted to move southwards, with the decreases most apparent in the areas with the most rapid warming”. It adds:
“The greatest projected reductions in krill due to the effects of warming and ocean acidification are predicted for the southwest Atlantic/Weddell Sea region (low confidence), which is the area of highest current krill concentrations, contains important foraging grounds for krill predators, and is also the main area of operation of the krill fishery.”
Projections indicate “negative future impacts of climate change on krill and all whale species, although the magnitude of impacts differs among populations as for other higher predators”, the report says:
“Pacific blue, fin and southern right whales are the most at risk but humpback whales are also at risk, as a consequence of reduced prey and increasing interspecific competition.”
Krill is also an important fishery in the Southern Ocean, the report notes, worth approximately $70m a year. The fishery has become “increasingly concentrated in space over recent decades, which has raised concern regarding localised impacts on krill predators”. In addition, the fishery has “also changed its peak season of operation” – towards late autumn and away from summer. “Some of these temporal and spatial shifts in the fishery over time have been attributed to reductions in winter sea ice extent in the region,” the report says.
For Antarctic fish, many species have “a narrow thermal tolerance as a result of physiological adaptations to cold water”, the report warns, “which makes them vulnerable to the effects of increasing temperatures”. The report picks out the icefish and Antarctic silverfish as important species that could be affected.
For other Antarctic mammals and seabirds, “there has been an increasing body of evidence of climate-induced changes in populations” since AR5. For example, “trends of populations of Antarctic penguins affected by climate change include both increases for gentoo penguins, and decreases for Adélie, chinstrap, king and emperor penguins”.
Evidence for climate change impacts on Antarctic flying birds suggests that regional declines in sea ice, warming sea, extreme events and wind changes “can reduce breeding success and population growth rates in some species”, the report says, including southern fulmars, Antarctic petrels and black-browed albatrosses.
It also warns of socioeconomic impacts in indigenous communities: “There is high confidence in indicators that food insecurity risks are on the rise for indigenous Arctic peoples.”
Food systems in northern communities are “intertwined with northern ecosystems because of subsistence hunting, fishing, and gathering activities,” the report says. Impacts of climate change include declining lake ice affecting fishing, changes to snow conditions making “travel more difficult and dangerous” and limiting access to hunting grounds, and reduced “reliability of permafrost for natural refrigeration”.
Climate change has also “negatively affected place attachment via hunting, fishing, trapping, and traveling disruptions, which have important mental health impacts”, the report says. And in coastal areas, “sea ice means freedom for travel, hunting, and fishing, so changes in sea ice affect the experience of and connection with place”.
Tourism is also affected by reductions in polar sea ice, which has “facilitated an increase in marine and cruise tourism opportunities across the Arctic related directly to an increase in accessibility”:
“Compared to a decade ago, there are more cruises on offer, ships travel further in a single season, larger vessels with more passenger berths are in operation, purpose-built polar cruise vessels are being constructed, and private pleasure craft are appearing in greater frequency.”
The report says there is “high confidence” that Arctic cruise tourism will continue to grow:
“For example, Canada’s Northwest Passage (southern route), which only saw occasional cruise ship transits in the early 2000s, is now reliably accessible during the summer cruising season and as a result has experienced a doubling and quadrupling of cruise and pleasure craft activity over the past decade.”
For shipping in general, there is “very high confidence” that climate change driven reductions in Arctic sea ice is a main driver” of an observed increase over the past decade. Shipping activity will continue to rise across the Arctic as northern routes become increasingly accessible.
This will have “significant socio-economic and political implications”, the report says, related to “safety (marine accidents, local accidents, ice as a hazard), security (trafficking, terrorism), and environmental and cultural sustainability (invasive species, release of biocides, chemicals and other waste, marine mammal strikes, fuel spills, air and underwater noise pollution, impacts to subsistence hunting)”.
In addition, commercial shipping “mainly uses heavy fuel oil, with associated emissions of sulphur, nitrogen, metals, hydrocarbons, organic compounds and black carbon and fly ash to the atmosphere during combustion”.
What does the report say about abrupt changes and ‘tipping points’?
Chapter six (pdf) of the IPCC report is dedicated to “extremes, abrupt changes and managing risks”. This chapter covers “tipping points” in the climate system, which it defines as “a critical threshold when global or regional climate changes from one stable state to another stable state”.
These tipping points “are associated with rapid and abrupt changes even when the underlying forcing changes gradually”, the report says. “Abrupt” means a large-scale change that “takes place over a few decades or less, persists (or is anticipated to persist) for at least a few decades, and causes substantial disruptions in human and natural systems”.
Some of these changes are irreversible, which means the natural recovery period from the changed state “is significantly longer than the time it takes for the system to reach this perturbed state”. For the IPCC report, it considers a change irreversible if the “recovery time scale of interest is hundreds to thousands of years”.
The risk of passing climate tipping points “form part of the scientific case for efforts to limit climate warming to well below 2C”, the report says.
The report includes the following table (Table 6.1), which summarises “abrupt and irreversible phenomena related to the ocean and cryosphere”. The right-most column indicates the “likelihood of an abrupt/irreversible change based on the assessed literature”.
| Change in system component | Change in system component | Irreversibility if forcing reversed (time scales indicated) | Impacts on natural and human systems; global vs. regional vs. local | Projected likelihood and/or confidence level in 21st century under scenarios considered |
|---|---|---|---|---|
| Ocean | ||||
| Atlantic Meridional Overturning Circulation (AMOC) collapse (Section 6.7) | Yes | Unknown | Widespread; increased winter storms in Europe, reduced Sahelian rainfall and agricultural capacity, variations in tropical storms, increased sea levels on Atlantic coasts | Very unlikely, but physically-plausible |
| Sub-polar gyre cooling (Section 6.7) | Yes | Irreversible within decades | Similar to AMOC impacts but considerably smaller. | Medium confidence |
| Marine heatwave increase (Section 6.4) | Yes | Reversible within decades to centuries | Coral bleaching, loss of biodiversity and ecosystem services, harmful algal blooms, species redistribution | Very likely (very high confidence) for physical changes. High confidence for impacts |
| Arctic sea-ice retreat (Section 3.3) | Yes | Reversible within decades to centuries | Coastal erosion in Arctic (may take longer to reverse), impact on mid-latitude storms (low confidence); rise in Arctic surface temperatures (high confidence) | High confidence |
| Ocean deoxygenation and hypoxic events (Section 5.2) | Yes | Reversible at surface, but irreversible for centuries to millennia at depth | Major changes in ocean productivity, biodiversity and biogeochemical cycles | Medium confidence |
| Ocean acidification (Section 5.2) | Yes | Reversible at surface, but irreversible for centuries to millennia at depth | Changes in growth, development, calcification, survival and abundance of species; e.g., from algae to fish | Virtually certain (very high confidence) |
| Cryosphere | ||||
| Methane release from permafrost (Section 3.4) | Yes | Reversible due to short lifetime of methane in the atmosphere | Further increased global temperatures through climate feedback | Medium confidence |
| CO2 release from permafrost (Section 3.4) | Yes | Irreversible for millennia due to long lifetime of CO2 in the atmosphere | Further increased global temperatures through climate feedback | Low confidence |
| Partial West-Antarctic Ice sheet collapse (Cross Chapter Box 2 in Chapter 1, Section 4.2) | Yes (late 21st century,under RCP8.5 only) | Irreversible for decades to millennia | Significant contribution to sea-level rise and local decrease in ocean salinity | Low confidence |
| Greenland Ice sheet decay (Cross Chapter Box 8, Section 4.2) | No | Irreversible for millennia | Significant contribution to sea- level rise, shipping (icebergs) | High confidence for decay contributing 10s of cm of SLR |
| Ice-shelf collapses (Cross Chapter Box 8, Sections 3.3, 4.2) | Yes | Possibly irreversible for centuries | May lead to sea-level rise from contributing glaciers. Some shelves more prone than others. | Low confidence |
| Glacier avalanches, surges, and collapses (Section 2.3) | Yes | Variable | Local hazard; may accelerate sea-level rise; local iceberg production; local ecosystems | Medium confidence for occurrence; Low confidence for increase in frequency/magnitude |
| Strong shrinkage or disappearance of individual glaciers (Sections 2.2, 3.3) | Yes | Reversible within decades to centuries | Regional impact on water resources, tourism, ecosystems and global sea level | Medium confidence |
| Landslides related to glaciers and permafrost, glacier lake outbursts (Section 2.3) | Yes | Irreversible for rock slopes; reversible within decades to centuries for glaciers, debris and lakes | Local direct impact on humans, land use, infrastructure (hazard), and ecosystems | Medium confidence for increase in frequency |
| Change in biodiversity in high mountain areas (impact - Section 2.4) | Yes | In many cases irreversible (e.g., extinction of species) | Local impacts on ecosystems and ecosystem services | Medium confidence |
Chapter six then goes on to focus on the potential collapse of the Meridional Overturning Circulation in the Atlantic (AMOC). This is the system of currents in the Atlantic Ocean that brings warm water up to Europe from the tropics. It is driven by the formation of North Atlantic Deep Water – the sinking of cold, salty water in the high latitudes of the North Atlantic.
The strength of AMOC has been directly monitored through Argo floats since 2004. Although the AMOC “has been weaker since 2008 than in the first four years of measurement…the record is not yet long enough to determine if there is a long-term decline of the AMOC”.
Research which looks further into the past suggests the AMOC may have weakened by around 15% since the mid-20th century, the report says. However, these methods use “indirect measurements of the AMOC” and so “considerable uncertainty remains concerning these results”. The report adds:
“Moreover, the exact mechanisms to explain such a long-term weakening are not fully understood and some reconstructions show a weakening starting very early in the historical era, when the level of anthropogenic perturbation and warming was very low.”
As a result, the report concludes that “there is medium confidence that the AMOC has weakened over the historical era, but there is insufficient evidence to quantify a likely range of the magnitude of the change”.
The special report “confirms” the conclusion of the IPCC’s AR5 that “the AMOC is very unlikely to collapse in the 21st century in response to increasing greenhouse gas concentrations”. The new evaluation uses “almost twice as many models as in the AR5 assessment”.
The chart below shows historical changes and projections for the AMOC – as a percentage of its strength during 2006-15 – using 27 climate models for the 21st century. The projections are shown for RCP2.6 (left-hand chart; blue line) and RCP8.5 (right; red line).
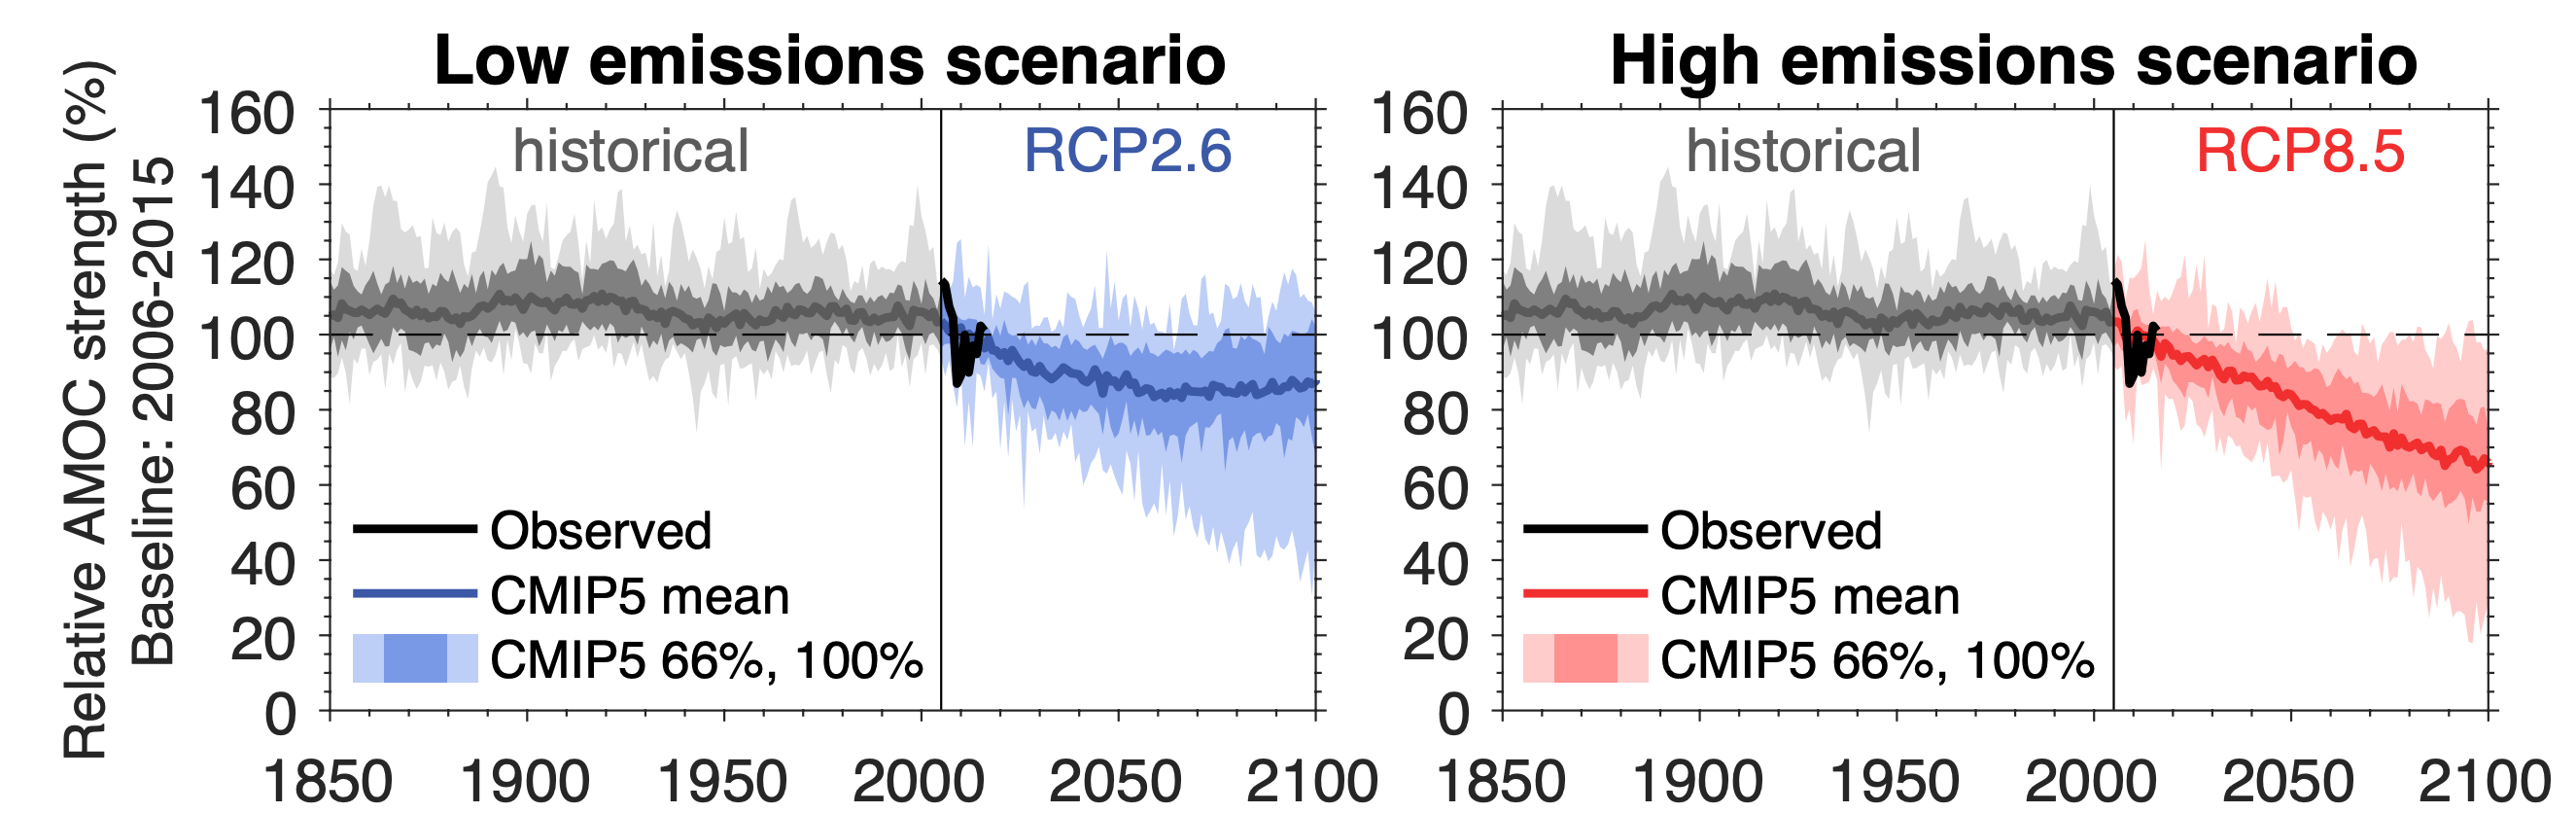
Chart shows historical (grey lines), observed (black) and projected (blue and red) AMOC changes from 1850 to 2100 – all at a latitude of 26 degrees north. The shaded ranges indicate the 66% and 100% ranges in model simulations. Projections of AMOC strength are simulated by 27 models under RCP2.6 (left; blue) and RCP8.5 (right; red). Source: IPCC: Figure 6.8 (pdf)
The models project the AMOC will weaken by around 11% in 2081-2100 (relative to the present day) under RCP2.6 and by 32% under RCP8.5. Just one model shows “a collapse (e.g., decrease larger than 80% relative to present-day) before the end of the century for RCP8.5 scenario”, the report notes.
By the end of the 23rd century, the likelihood of an AMOC collapse under the RCP8.5 scenario is approximately 44% – or “about as likely as not” in IPCC parlance. AMOC weakening “stabilises in RCP4.5”, the report says, albeit around 37% weaker. This result “suggests that an AMOC collapse can be avoided in the long term by mitigation”.
The report links “enhanced freshwater fluxes” with AMOC weakening as it suppresses formation of North Atlantic Deep Water. Freshwater contributions to the North Atlantic from melting of the Greenland ice sheet, Arctic sea ice and Canadian glaciers have increased by 50% since the mid-1990s. The increase in Greenland ice melt “is unprecedented over the last 350 years”.
The impact of Greenland ice melt was “neglected in AR5 projections”, the report says, but new model simulations suggest that it “has an impact on the AMOC, potentially adding up to around 5–10% more AMOC weakening in 2100 under RCP8.5”.
Even though the AMOC is very unlikely to collapse over the 21st century, “its weakening may be substantial”, the report says, “which may, therefore, induce strong and large-scale climatic impacts with potential far-reaching impacts on natural and human systems”.
These include “a cooling of the North Atlantic, a warming of the South Atlantic, less evaporation and, therefore, precipitation over the North Atlantic, and a shift of the ITCZ”. (The ITCZ, or Intertropical Convergence Zone, is a huge belt of low pressure that encircles the Earth near the equator.)
A large potential decline in the AMOC strength would also reduce global surface warming, the report says, “due to changes in the location of ocean heat uptake and associated expansion of the cryosphere around the North Atlantic, which increases surface albedo”.
The graphic below illustrates some of the knock-on impacts around the world of a substantial weakening of the AMOC. The IPCC’s caption for the graphic describes some of these impacts:
“Changes in circulation have multiple impacts around the Atlantic Basin, but also include remote impacts in Asia and Antarctica. Reductions in AMOC lead to an excess of heat in the South Atlantic, leading to increased flooding, methane emissions and drought, and a concomitant negative impact on food production and human systems. In the North Atlantic region hurricane frequency is decreased on the western side of the basin, but storminess increases in the east. Marine and terrestrial ecosystems, including food production, are impacted while sea level rise is seen on both sides of the Atlantic.”
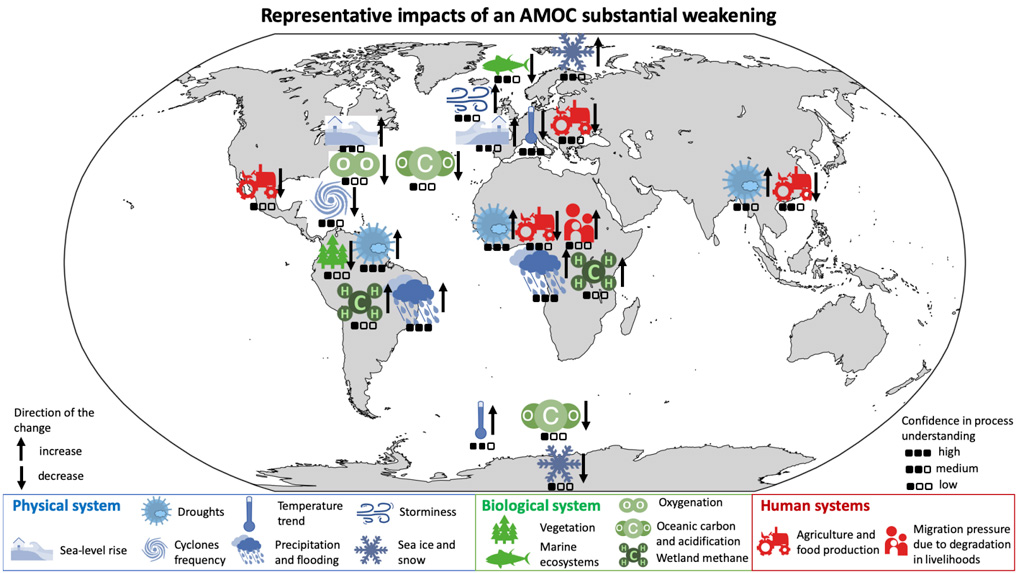
Infographic on teleconnections and impacts due to AMOC collapse or substantial weakening. The arrows indicate the direction of the change associated with each icon and is put on its right. An assessment of the confidence level in the understanding of the processes at play is indicated below each icon. Source: IPCC: Figure 6.10 (pdf)
What is happening to permafrost?
The report describes permafrost as “ground (soil or rock containing ice and frozen organic material) that remains at or below 0C for at least two consecutive years”. The chapter generally focuses on the northern hemisphere, which has an area of permafrost three orders of magnitude larger than Antarctica’s.
It occurs “on land in polar and high-mountain areas, and also as submarine permafrost in shallow parts of the Arctic and Southern oceans”. The thickness of permafrost ranges from less than one metre to more than a kilometre. Typically, it sits beneath an “active layer” that thaws and refreezes every year.
![]()
The fate of permafrost is particularly important because it is a “large, climate-sensitive reservoir of organic carbon”, the report says. This is carbon which has accumulated from dead plants and animals over thousands of years. (There is approximately twice as much carbon in permafrost than is currently in the Earth’s atmosphere.)
A warming climate raises the “potential for some of this pool to be rapidly decayed and transferred to the atmosphere as CO2 and methane as permafrost thaws”, the report warns, “thus accelerating the pace of climate change”.
Permafrost is one of a number of changes to the Earth system that are “expected to be irreversible on timescales relevant to human societies and ecosystems”, the executive summary for chapter one (pdf) says. It also notes:
“Ice melt or the thawing of permafrost involve thresholds (state changes) that allow for abrupt, nonlinear responses to ongoing climate warming (high confidence).”
The report says there is “very high confidence” that record high temperatures at ~10–20m depth in the permafrost have been “documented at many long-term monitoring sites in the northern hemisphere circumpolar permafrost region”. In some places, these temperatures are 2-3C higher than 30 years ago. It adds:
“During the decade between 2007 and 2016, the rate of increase in permafrost temperatures was 0.39C for colder continuous zone permafrost monitoring sites, 0.20C for warmer discontinuous zone permafrost, giving a global average of 0.29C across all polar and mountain permafrost.”
While temperature and rainfall changes act as “gradual” and “continuous” pressures on permafrost, it is also affected by “abrupt” or “pulse” disturbances, such as fire, and soil subsidence and erosion resulting from ice-rich permafrost thaw (thermokarst)”. The most widespread of these pressures is wildfire, the report says:
“There is high confidence that area burned, fire frequency, and extreme fire years are higher now than the first half of the last century, or even the last 10,000 years. Recent climate warming has been linked to increased wildfire activity in the boreal forest regions in Alaska and western Canada where this has been studied. Based on satellite imagery, an estimated 80,000 km2 of boreal area was burned globally per year from 1997 to 2011.”
There is high confidence that “changes in the fire regime are degrading permafrost faster than had occurred over the historic successional cycle”, the report notes, “and that the effect of this driver of permafrost change is under-represented in the permafrost temperature observation network”.
Overall, “there is medium evidence and low agreement that this warming is currently causing northern permafrost regions to release additional methane and CO2,” the report concludes.
The report has “high confidence” in projections of “widespread disappearance of Arctic near-surface permafrost…this century as a result of warming, with important consequences for global climate”. It notes:
“By 2100, near surface permafrost area will decrease by 2-66% for RCP2.6 and 30-99% for RCP8.5. This is projected to release 10s to 100s of billions of tonnes [or gigatonnes, GtC], up to as much as 240 GtC, of permafrost carbon as CO2 and methane to the atmosphere with the potential to accelerate climate change (medium confidence).”
The projection for RCP4.5 is a 15-87% decrease, the report adds. The carbon emissions estimates above are from expert assessment and laboratory soil incubation studies. They are supported by model simulations, which give an average estimate of 92GtC under RCP8.5, with range of 37-174GtC.
The chart below illustrates historical and future permafrost area change.
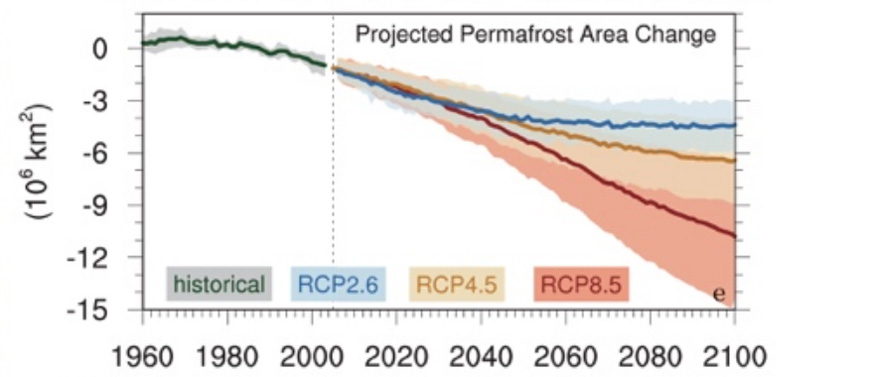
Historical (black line) and projected (coloured lines) area of Arctic permafrost out to 2100. Projections show CMIP5 multi-model average and +/ one standard deviation range for RCP2.6 (blue), RCP4.5 (orange) and RCP8.5 (red). Source: IPCC: Figure 3.10 (pdf)
An estimate using a subset of the CMIP5 models projects a 90% loss of permafrost area by 2300 for RCP8.5 and 29% loss for RCP4.5, “with much of that long-term loss already occurring by 2100”.
These projections do not include “pulse disturbances”, the report notes, and “there is high confidence that fire and abrupt thaw will accelerate change in permafrost relative to climate effects alone, if the rates of these disturbances increase”.
Methane will contribute a small proportion of the carbon released from permafrost, the report says – “on the order of 0.01-0.06 GtC per year”. However, it could contribute 40-70% of the total warming impact from permafrost emissions because of methane’s higher warming potential.
The report notes that there is the potential for “stimulated plant growth” in permafrost areas – from warmer conditions and CO2 fertilisation – that could “offset some or all of these losses, at least during this century, by sequestering new carbon into plant biomass and increasing carbon inputs into the surface soil”.
Future carbon emissions from permafrost “would be a significant fraction of those projected from fossil fuels with implications for allowable carbon budgets that are consistent with limiting global warming”, the report says, “but will also depend on how vegetation responds (high confidence)”. It also notes:
“Furthermore, there is high confidence that climate scenarios that involve mitigation (e.g. RCP4.5) will help to dampen the response of carbon emissions from the Arctic and boreal regions.”
Similarly, there is “high confidence that mitigation of anthropogenic methane sources could help to dampen the impact of increased methane emissions from the Arctic and boreal regions”.
Finally, the report also warns that permafrost thaw, along with a decrease in snow, “will affect Arctic hydrology and wildfire, with impacts on vegetation and human infrastructure (medium confidence)”. For example, “about 20% of Arctic land permafrost is vulnerable to abrupt permafrost thaw and ground subsidence, which is expected to increase small lake area by over 50% by 2100 for RCP8.5”.
It adds:
“By 2050, 70% of Arctic infrastructure is located in regions at risk from permafrost thaw and subsidence; adaptation measures taken in advance could reduce costs arising from thaw and other climate-change related impacts such as increased flooding, precipitation, and freeze-thaw events by half (medium confidence).”
What do the latest projections indicate for future sea level rise?
The report’s 169-page chapter four discusses past, current and future global sea level rise (SLR). This is accelerating and has already reached a level likely to be “unprecedented” over the past century.
The current rate of SLR is now “larger than the mean rate of the previous two millennia”. And there is “high confidence” that human-caused climate change is “very likely” to have been the “dominant cause” of SLR seen since 1970.
Looking to the future, the report’s worst-case projections for SLR this century are higher than those in the IPCC’s 2013 AR5. This is due to accelerating “dynamic” loss from the vast Antarctic ice sheet, as well as improved understanding of why and how fast this loss might increase.
The fate of the world’s giant ice sheets is hugely significant – given the amount of water they contain – but is likely to play out over many centuries, as the report explains:
“The vast ice sheets in Antarctica and Greenland currently hold about 66 metres of potential global sea level rise, although the loss of a large fraction of this potential would require millennia of ice sheet retreat.”
The report says there is only “low confidence” that accelerating Antarctic flows are a sign of “irreversible retreat associated with ice sheet instability”. It adds that while ice sheet collapse in the Antarctic could add “several metres” to sea levels, this would take “a few centuries” to happen.
As discussed in Carbon Brief’s new in-depth explainer, there are several factors behind changing global sea levels. These are “thermal expansion” as the ocean warms, changes in the amount of water stored on land in reservoirs and groundwater, and the melting of glaciers and ice sheets.
At a local and regional level, these contributions can be amplified or counteracted by other changes, caused by human activity and natural factors. For example, subsidence due to excess water abstraction can cause land to sink, increasing the relative rate of SLR. This is currently the most important driver in many river deltas, the special report notes.
Other local factors affecting relative SLR include changes in the Earth’s gravitational field due to glacier or ice sheet melt, shifting ocean circulation patterns and wind, and land uplift as the surface adjusts in regions previously covered by ice during the last ice age.
The relative contributions to SLR have changed, with melting ice responsible for the majority of global increases and thermal expansion now only the second largest factor, according to today’s report. For example, it suggests “the contribution of Antarctica ice sheet dynamics to SLR has been small, if any before the 1990s”.
The acceleration in SLR can be seen in records from tide gauges (coloured lines in the Carbon Brief chart, below) and satellite “altimeters” (black). Global average sea levels rose by 1.4mm each year from 1901-1990, the report says. This increased to 2.1mm per year from 1970-2015 and then to 3.6mm a year from 2005-2015, some 2.5 times faster than the rate seen during the 20th century.
Change in global mean (average) sea level 1900-2018, in millimetres, relative to the average during 1992-2006. The coloured lines show various tide gauge records while data from satellite altimeters is shown in black. Chart by Carbon Brief using Highcharts.There is “very high confidence” that the recent acceleration in SLR is due to increasing melt from the Greenland and Antarctic ice sheets. In Antarctica, the rate of ice loss tripled in the decade 2007-2016, compared with the previous one. Similarly, ice loss from the Greenland sheet doubled compared to 1997-2006.
This accelerating ice loss – and the more rapid SLR it causes – will continue to gather pace over the course of the 21st century, the report warns, regardless of whether greenhouse gas emissions are reduced or how quickly the world succeeds in doing so.
Valérie Masson-Delmotte, Co-Chair of IPCC Working Group I, presenting the Special Report on the Ocean and Cryosphere in a Changing Climate #SROCC in Monaco🇲🇨
today#climatechange #globalgoals pic.twitter.com/Vo0vRgTQer— IPCC (@IPCC_CH) September 25, 2019
If emissions during the rest of the century are low and track the “RCP2.6” scenario (left panel in the chart, below), where global temperatures are limited to well-below 2C in 2100, then the rate of SLR will still increase from around 4mm per year today to 4-9mm/year by 2100 and 0.43m in total, relative to the late 20th century average, with a “likely” range of 0.29-0.59m.
If emissions are very high, in line with the RCP8.5 scenario (right panel), then the rate could reach 10-20mm/year by 2100 and the total 0.84m, with a “likely” range of 0.61-1.1m. This would be around 10 times faster than the average rate across the 20th century.
The “likely” maximum rise of 1.1m by 2100 is some 10cm above the top-end estimate from AR5 (coloured line and range, SROCC, versus black line and grey range, AR5). But there is also a 17% chance that SLR “will exceed” this – and “[a rise] of 2m cannot be ruled out”.
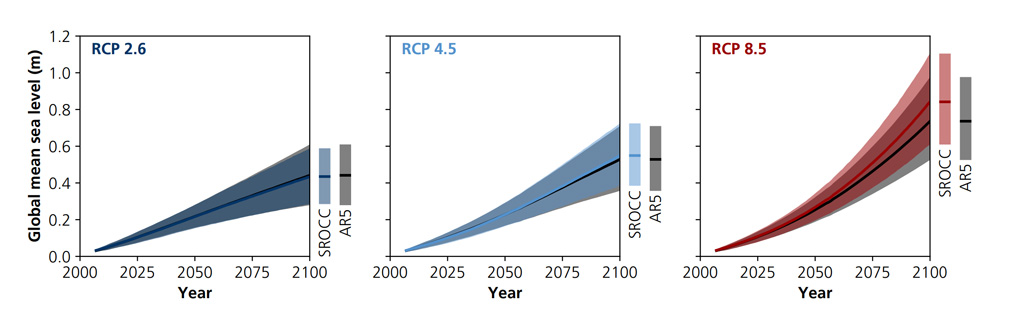
Projected change in global average sea level during the 21st century (metres), relative to the average for 1986-2005. Each panel shows projections from the current report (SROCC, coloured line and area) relative to the projections made in AR5 (black line and grey area). Left: The low emissions RCP2.6 scenario. Centre: The medium emissions RCP4.5 pathway. Right: The very high emissions RCP8.5 scenario. Source: IPCC SROCC figure 4.9.
The increase in worst-case projections for SLR is due to larger-than-expected losses from the Antarctic, the summary report explains. In contrast, the projected contributions from Greenland melt, thermal expansion or glacier loss are all unchanged since AR5.
Scientific understanding of the processes by which rapid Antarctic ice loss could occur – and the likelihood of it happening – has evolved and improved since AR5, the report says.
The central question is the extent to which “dynamic” changes will see Antarctica’s ice flowing into the ocean at accelerating speeds as the world warms. Potential mechanisms include “marine ice sheet instability” and “marine ice cliff collapse”, discussed in the section on ice sheets, above.
Dynamic ice sheet changes of this sort were included for the first time in AR5’s projections of SLR, pushing them higher than those in the IPCC’s previous fourth assessment report.
Yet as the report explains, the AR5 projections for dynamic ice sheet loss were based mainly on “extrapolation of existing observations”. And despite improvements in the evidence base since then, the potential for ice sheet collapse is, nevertheless, given as an example of “deep uncertainty”, where experts do not know – or cannot agree on – the best way to model the key driving forces, or the probabilities and uncertainty that should be attached to different outcomes.
These uncertainties are particularly large looking further into the future, yet sea levels will rise for centuries and “will remain elevated for thousands of years”, under all emissions scenarios, as the chart below shows.

Global mean sea level rise, metres, by 2300, under the low-emissions RCP2.6 scenario (blue lines, dots and range) and the high-emissions RCP8.5 pathway (red). Source: IPCC SROCC figure 4.2.
If emissions are very high, then SLR “could exceed several centimetres per year in the 22nd century” and could exceed 5m in total by 2300, as the chart above shows.
Reflecting the “deep uncertainty” around Antarctic ice sheet loss, some newer research into the potential for even more rapid “dynamic” melt was not included in the special report’s projections, as it remains tentative.
What are the wider impacts for coastal regions and small island states?
Sea level rise is one of the most consequential impacts of climate change and is discussed in the 169-page chapter four as well as in a separate 23-page “cross-chapter box 9” on low-lying islands and coasts.
Some 680 million people – around 10% of the world’s population – live in coastal zones less than 10m above sea level and this figure is expected to reach one billion by 2050, the report says, posing questions around displacement and migration.
“There is high agreement that climate change has the potential to drastically alter the size and direction of migration flows but we have low confidence in quantitative projections of migration in response to sea level rise and extremes of sea level.”
This low confidence is reflected in the fact that an estimate suggesting warming of 2C could “submerge the homeland of 280 million people by the end of the century” has been removed from the SPM. It had appeared in an earlier draft, which was leaked and reported on widely.
The number remains in the report’s underlying “cross-chapter box 9”, as quoted above, which incorrectly adds a 2100 timeframe. Instead, the study from which the 280 million figure is drawn relates to future sea level rise that could be “locked in” this century – but which might still take centuries to play out.
Vulnerable coastal communities will be affected not only by rising average sea levels, but also by increasingly severe extreme events such as storm surges, discussed in the section below.
Low-lying coasts and islands, including small island developing states, already face “cascading and compounding risks” due to changes in the climate and sea levels to date. These risks are expected to get “disproportionately higher” later this century, as accelerating sea level rise combines with ocean warming and acidification to melt permafrost and change ecosystems.
“More than 80% of small island residents live near the coast where flooding and coastal erosion already pose serious problems…[T]here is growing concern that some island nations as a whole may become uninhabitable due to rising sea levels and climate change, with implications for relocation, sovereignty and statehood.”
The SPM notes that some island nations are “likely” to become uninhabitable if emissions this century are high, but that thresholds for habitability “remain extremely difficult to asses”.
Climate-related risks are also compounded by human drivers, including the concentration of people and economic activities at the coasts, “coastal squeeze”, degradation of ecosystems, changes to sediment transport in rivers, “poor” planning and other societal choices.
Coastal “megacities” with over 10 million inhabitants and lying within areas less than 10m above sea level include “New York City, Tokyo, Jakarta, Mumbai, Shanghai, Lagos and Cairo”, as shown in the figure, below. Without adaptation, sea level rise, population growth and subsidence could push flood losses in the 136 largest coastal cities from $6bn per year today to $1tn by 2050.
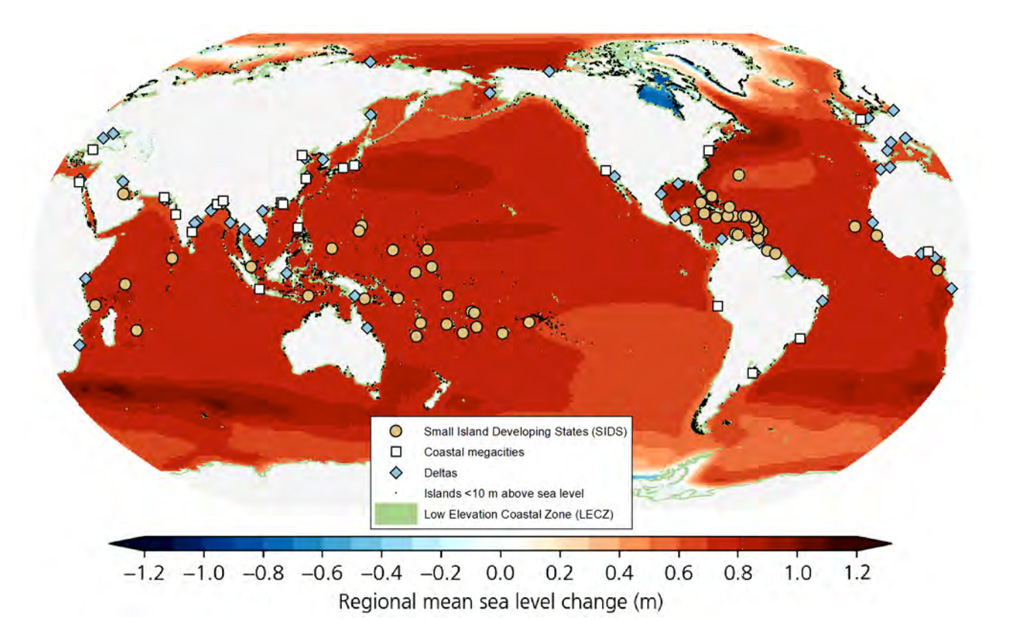
Low-lying islands and coasts particularly at risk from regional sea level rise by late this century if emissions are very high, shown with shading from blue through red. Small island developing states are highlighted with circles, coastal megacities with squares and river deltas with diamonds. Source: IPCC SROCC figure CB9.1.
The potentially huge increase in flood damages this century extends beyond major cities, to all of the coastal areas in the figure above that are at risk from sea level rise.
“In the absence of adaptation, more intense and frequent extreme sea level events, together with trends in coastal development will increase expected annual flood damages by 2-3 orders of magnitude by 2100 [increase by multiples of 100s to 1,000s].”
Options for responding to the threat of rising seas range from hard engineering measures, such as sea walls, through to ecosystem-based coastal protection or “relocating” people and their assets. But these potential adaptation responses have limits, even if warming is kept below 1.5C:
“Reinforcing the findings of the IPCC special report on global warming of 1.5C, vulnerable human communities, especially those in coral reef environments and polar regions, may exceed adaptation limits well before the end of this century and even in a low greenhouse gas emission pathway.”
Those communities potentially at risk even if warming is limited to 1.5C include “urban atoll islands and some Arctic communities”. If emissions are high, then worst-case projections imply “high to very high risks are expected in all low-lying coastal settings”.
There are also challenges to each of the adaptation options available. For example, hard engineering is generally thought to be effective, but is “often unaffordable” and can still fail with “possibly disastrous consequences”.
“[W]ell-designed coastal protection is very effective in reducing expected damages and cost efficient for urban and densely populated regions, but generally unaffordable for rural and poorer areas…Effective protection requires investments on the order of tens to several hundreds of billions of US$ per year globally.”
For ecosystem-based adaptation – for example, using coral reefs or mangroves – other aspects of climate change may impede their longer-term effectiveness in protecting from rising seas.
Managed retreat – where land is given up to the sea – as well as wholesale relocation, is already underway, but is “largely restricted to small communities”. It also poses societal challenges beyond the practical effort required, including the need to integrate communities into their new homes.
How else is climate change affecting the ocean and marine life?
The polar regions are not the only areas where warming waters are taking their toll on ecosystems.
According to the report, it is “virtually certain” that the global ocean has been warming unabated since 1970 and it is “likely” the rate of warming has doubled since 1993. Overall, the oceans are thought to have taken up more than 90% of the excess heat in the climate system.
Marine heatwaves around the world have doubled in frequency since 1982, becoming “longer-lasting, more intense and more extensive,” according to the SPM.
While some extreme events are difficult to attribute to anthropogenic factors, the case is clearer for heatwaves. In chapter six, the report says it is “very likely” that up to 90% of the events that took place between 2006 and 2015 bore the fingerprints of human-induced global warming.
Monthly global ocean heat content (in zettajoules – billion trillion joules, or 10^21 joules) for the 0-700 metre and 700-2000 metre layers. Data from Cheng et al 2017, updated through March 2019. Chart by Carbon Brief using Highcharts.At the same time, the pervasive effects of climate change in the oceans extend beyond rising water temperatures. Changes in salinity, oxygen content and acidification are among the shifts that are already impacting the creatures inhabiting the world’s oceans and, by extension, the millions of people who rely on them for food and income.
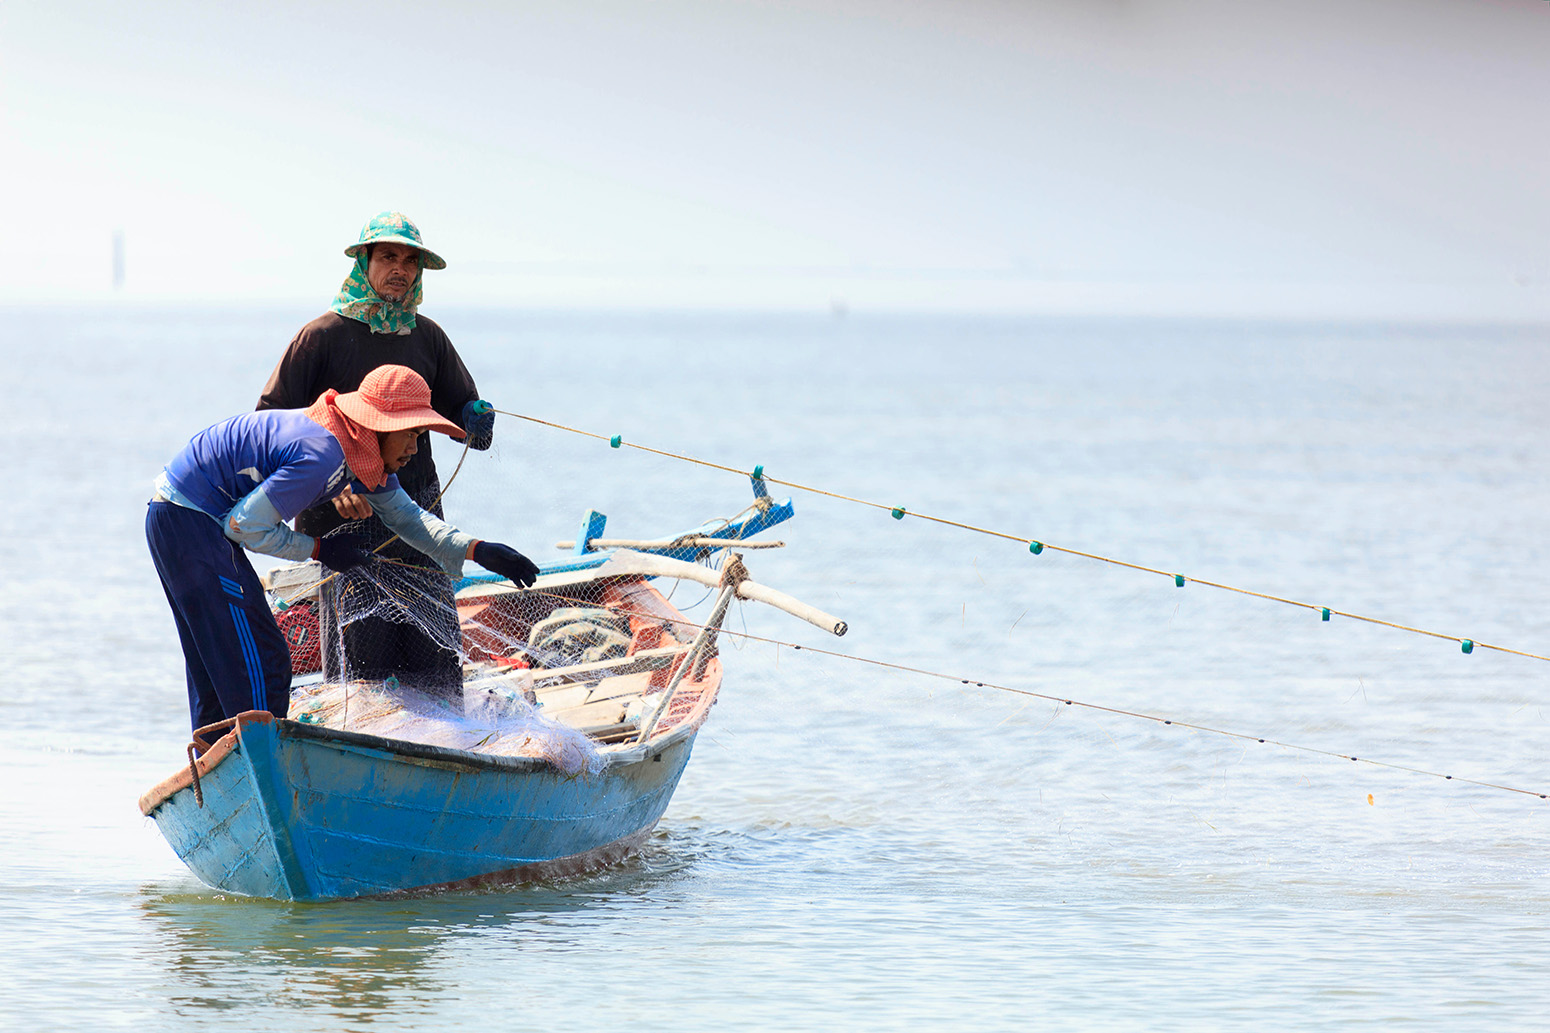
Fishermen with a cast net in the South China Sea, Kampot, Cambodia. Credit: John Michaels / Alamy Stock Photo.
The report makes it clear that all of these changes in the ocean have been “extensively discussed in previous assessments” and that both global ocean warming and acidification are “readily detectable in oceanic observations” and “well understood scientifically”. It lays out these issues in chapter five:
“Each of these has been directly attributed to anthropogenic forcing from changing concentrations of greenhouse gases and aerosols. These trends in the global average ocean temperature will continue for centuries after the anthropogenic forcing is stabilised.”
By the end of the century, even under a comparatively low-emissions scenario, the ocean is “very likely to warm by two to four times as much…compared with the observed changes since 1970”. This projection increases to “five to seven times as much” under a high-emissions scenario.
Surface warming combined with a surge in freshwater runoff entering the top layer of the oceans is making the oceans more stratified – meaning the top is less dense than the deeper parts, and there is less mixing between the different levels.
Over the course of decades, changes in the salinity of the oceans are expected to vary depending on location, “with an increasingly salty tropical and subtropical Atlantic and Mediterranean contrasting with a freshening Pacific and polar Arctic”.
“In general, future increases in stratification will trap nutrients in the ocean interior and reduce upper ocean nutrient levels,” the report says, noting there will also be additional changes at local scales.
While there is evidence that the Atlantic Meridional Overturning Circulation (AMOC) is weakening, the report determines there is “insufficient evidence” to gauge either how serious this problem is or to what extent it is linked with anthropogenic factors (see Q6 for more information on the AMOC and other “tipping points”.)
There are already significant changes underway in the water chemistry of the world’s oceans as a result of increasing CO2 emissions. As the greenhouse gas is pumped into the atmosphere, the ocean responds by absorbing it in large quantities. Since the 1980s, it is thought to have absorbed between 20-30% of anthropogenic emissions.
The result is an ocean with an ever lower (and, therefore, more acidic) pH, and the consequences for ocean life are potentially severe.
This is particularly true In the Arctic, Southern, North Pacific and Northwestern Atlantic oceans, if the world takes a high-emissions pathway. There, the falling pH is expected to make the water “corrosive for the major mineral forms of calcium carbonate” that many animals use to build their shells.
However, the report notes this undesirable outcome is “virtually certain” to be avoided if emissions are kept within the lower emissions scenario.
As more CO2 has entered the oceans, shifts in ocean stratification, ventilation and biogeochemistry have led to a “growing consensus” that the open ocean has lost between 0.5-3.3% of the oxygen from its upper levels over the course of the four decades beginning in 1970.
The areas known as oxygen minimum zones, where only specially adapted organisms can survive, are projected to grow larger in the future as the overall levels of oxygen in seawater drops.
These chemical changes are posing a particular threat to some Eastern Boundary Upwelling Systems, highly productive areas of the ocean where nutrient rich waters are brought up from the depths. The two upwelling systems expected to be negatively threatened are the California Current and Humboldt Current.
The combined effect of these stressors on the oceans, when accounted for by climate models, results in projections of “net primary productivity” (the rate at which plants and algae produce organic materials by photosynthesis) declining by 4-11% under a high-emissions scenario.
In turn, this is expected to contribute to a decline of around 15% in the total mass of marine animals by the end of the century and up to a 25.5% drop in “maximum catch potential” of fisheries. These effects are significantly smaller under a lower emissions scenario, which is projected to trigger a roughly 4% decline in biomass and no more than 9.1% reduction in catch potential.
Shifts in distribution and abundance of specific, valuable food species, such as albacore, Atlantic and southern bluefin tuna, are highlighted in the main report. The SPM emphasises that these warming-related changes “have already contributed to reduced fisheries catches”.
Furthermore, the report says that “the increase in climatic hazards beyond thresholds of tolerance of deep-sea organisms will increase the risk of loss of biodiversity and impacts on functioning of deep water column and seafloor”. It notes that these are “important” for supporting ecosystem services such as carbon sequestration.
Coastal ecosystems, such as kelp forests and seagrass meadows, are also highly vulnerable, even at just 1.5C of warming. This is exacerbated by “pervasive human coastal disturbances”, which place additional pressures on them and limit their ability to adapt. However, it is coral reefs that are singled out as particularly threatened:
“Almost all coral reefs will degrade from their current state, even if global warming remains below 2C, and the remaining shallow coral reef communities will differ in species composition and diversity from present reefs. These declines in coral reef health will greatly diminish the services they provide to society, such as food provision, coastal protection and tourism.”
All of these conclusions about coral are reached with “high” or “very high” confidence (apart from the impact on tourism which is “medium confidence”). The combination of factors including warming, deoxygenation and lower organic carbon flux are expected to prevent coral communities from thriving.
The report also discusses potential ways to respond to the considerable challenges it has laid out. In particular, it emphasises the role that conserving and restoring “blue carbon” ecosystems, such as mangroves, salt marshes and seagrass meadows, can play:
“Some 151 countries around the world contain at least one of these coastal blue carbon ecosystems and 71 countries contain all three. Below-ground carbon storage in vegetated marine habitats can be up to 1000 tonnes of carbon per hectare, much higher than most terrestrial ecosystems.”
However, it notes that “the potential climatic benefits of blue carbon ecosystems can only be a very modest addition to, and not a replacement for, the very rapid reduction of greenhouse gas emissions”. The total global scope is likely no more that 2% of current emissions being offset.
The report also casts doubt on the likelihood of “human interventions to enhance marine carbon uptake” playing a significant role. For example, the feasibility of open ocean fertilisation – a controversial climate engineering technique that would involve adding large amounts of nutrients to the ocean – is described as “limited to negligible”.
Finally, it also discusses the importance of adaptation in the face of myriad changes to the oceans and particularly emphasises the importance of ecosystem-based approaches besides “hard engineering responses”.
What does the report say about extreme events?
Rather than the incremental impacts of rising seas and warming temperatures, it is typically the extreme events associated with climate change that attract the greatest public attention.
The special report devotes its 94-page chapter six to such extremes, as well as the potential climate “tipping points” already discussed above. Extremes include tropical cyclones, marine heatwaves and extreme wave heights, some of which have already seen increases in frequency and intensity as a result of human-caused climate change.
“[C]limate change…is increasingly driving extreme climate and weather events across the globe including compound events (high confidence)…[T]he number of recent studies and wide range of phenomena addressed suggests increasing influence of climate change on extreme events.”
The report says such extremes will cause “unavoidable loss and damage” – a touchstone phrase for vulnerable countries used within UN climate negotiations, the Paris Agreement itself and wider international political debate:
“Impacts from further changes in tropical and extra-tropical cyclones, marine heatwaves, extreme El Niño and La Niña events and other extremes will exceed the limits of resilience and adaptation of ecosystems and people, leading to unavoidable loss and damage.”
For example, it says that climate change will reduce the value of coastal properties, particularly in small island developing states, through “loss and damage caused by sea level rise, increased storm intensity, heatwaves, floods, droughts and other extreme events”.
Turning to specific types of extreme, the report says there is “medium confidence” that human-caused climate change has already increased the amount of rainfall associated with some cyclones, as well as “low confidence” around increased wind speeds and “high confidence” of increases in their associated extreme sea level events.
Together, there is “high confidence” that these changes have “increased [the] intensity of multiple extreme events and associated cascading impacts”.
There is also some evidence that the strongest cyclones are becoming more prevalent but “low confidence” that this global shift is due to human activity.
“There is emerging evidence for an increase in [the] annual global proportion of Category 4 or 5 tropical cyclones in recent decades (low confidence).”
This is broader than the assessment of AR5, which was, in turn, wider than AR4 published in 2007. For example, AR4 had said an increase in intense tropical cyclone activity was “likely, in some regions, since 1970”. In AR5 this became “virtually certain in [the] North Atlantic since 1970”, but it found “limited evidence for other regions and the globe”.
Today’s report extends the finding globally, albeit describing the evidence for an increase in the proportion of the most intense cyclones as “emerging” and assigning it “low confidence”.
Other changes already being observed – such as an increase in the number of severe cyclones making landfall in East and Southeast Asia, and an increasing frequency of “moderately large” storm surges in the US – are attributed to human-caused warming on a similarly tentative basis in that there is “low confidence that these represent detectable anthropogenic signals”.
Looking to the future, there is “medium confidence” that the proportion of the most damaging Category 4 and 5 tropical cyclones “will increase” globally; that the average intensity of all cyclones will increase by 1-10%, if warming reaches 2C; and that the rainfall associated with each storm will also rise, by at least 7% per degree of warming at the sea surface.
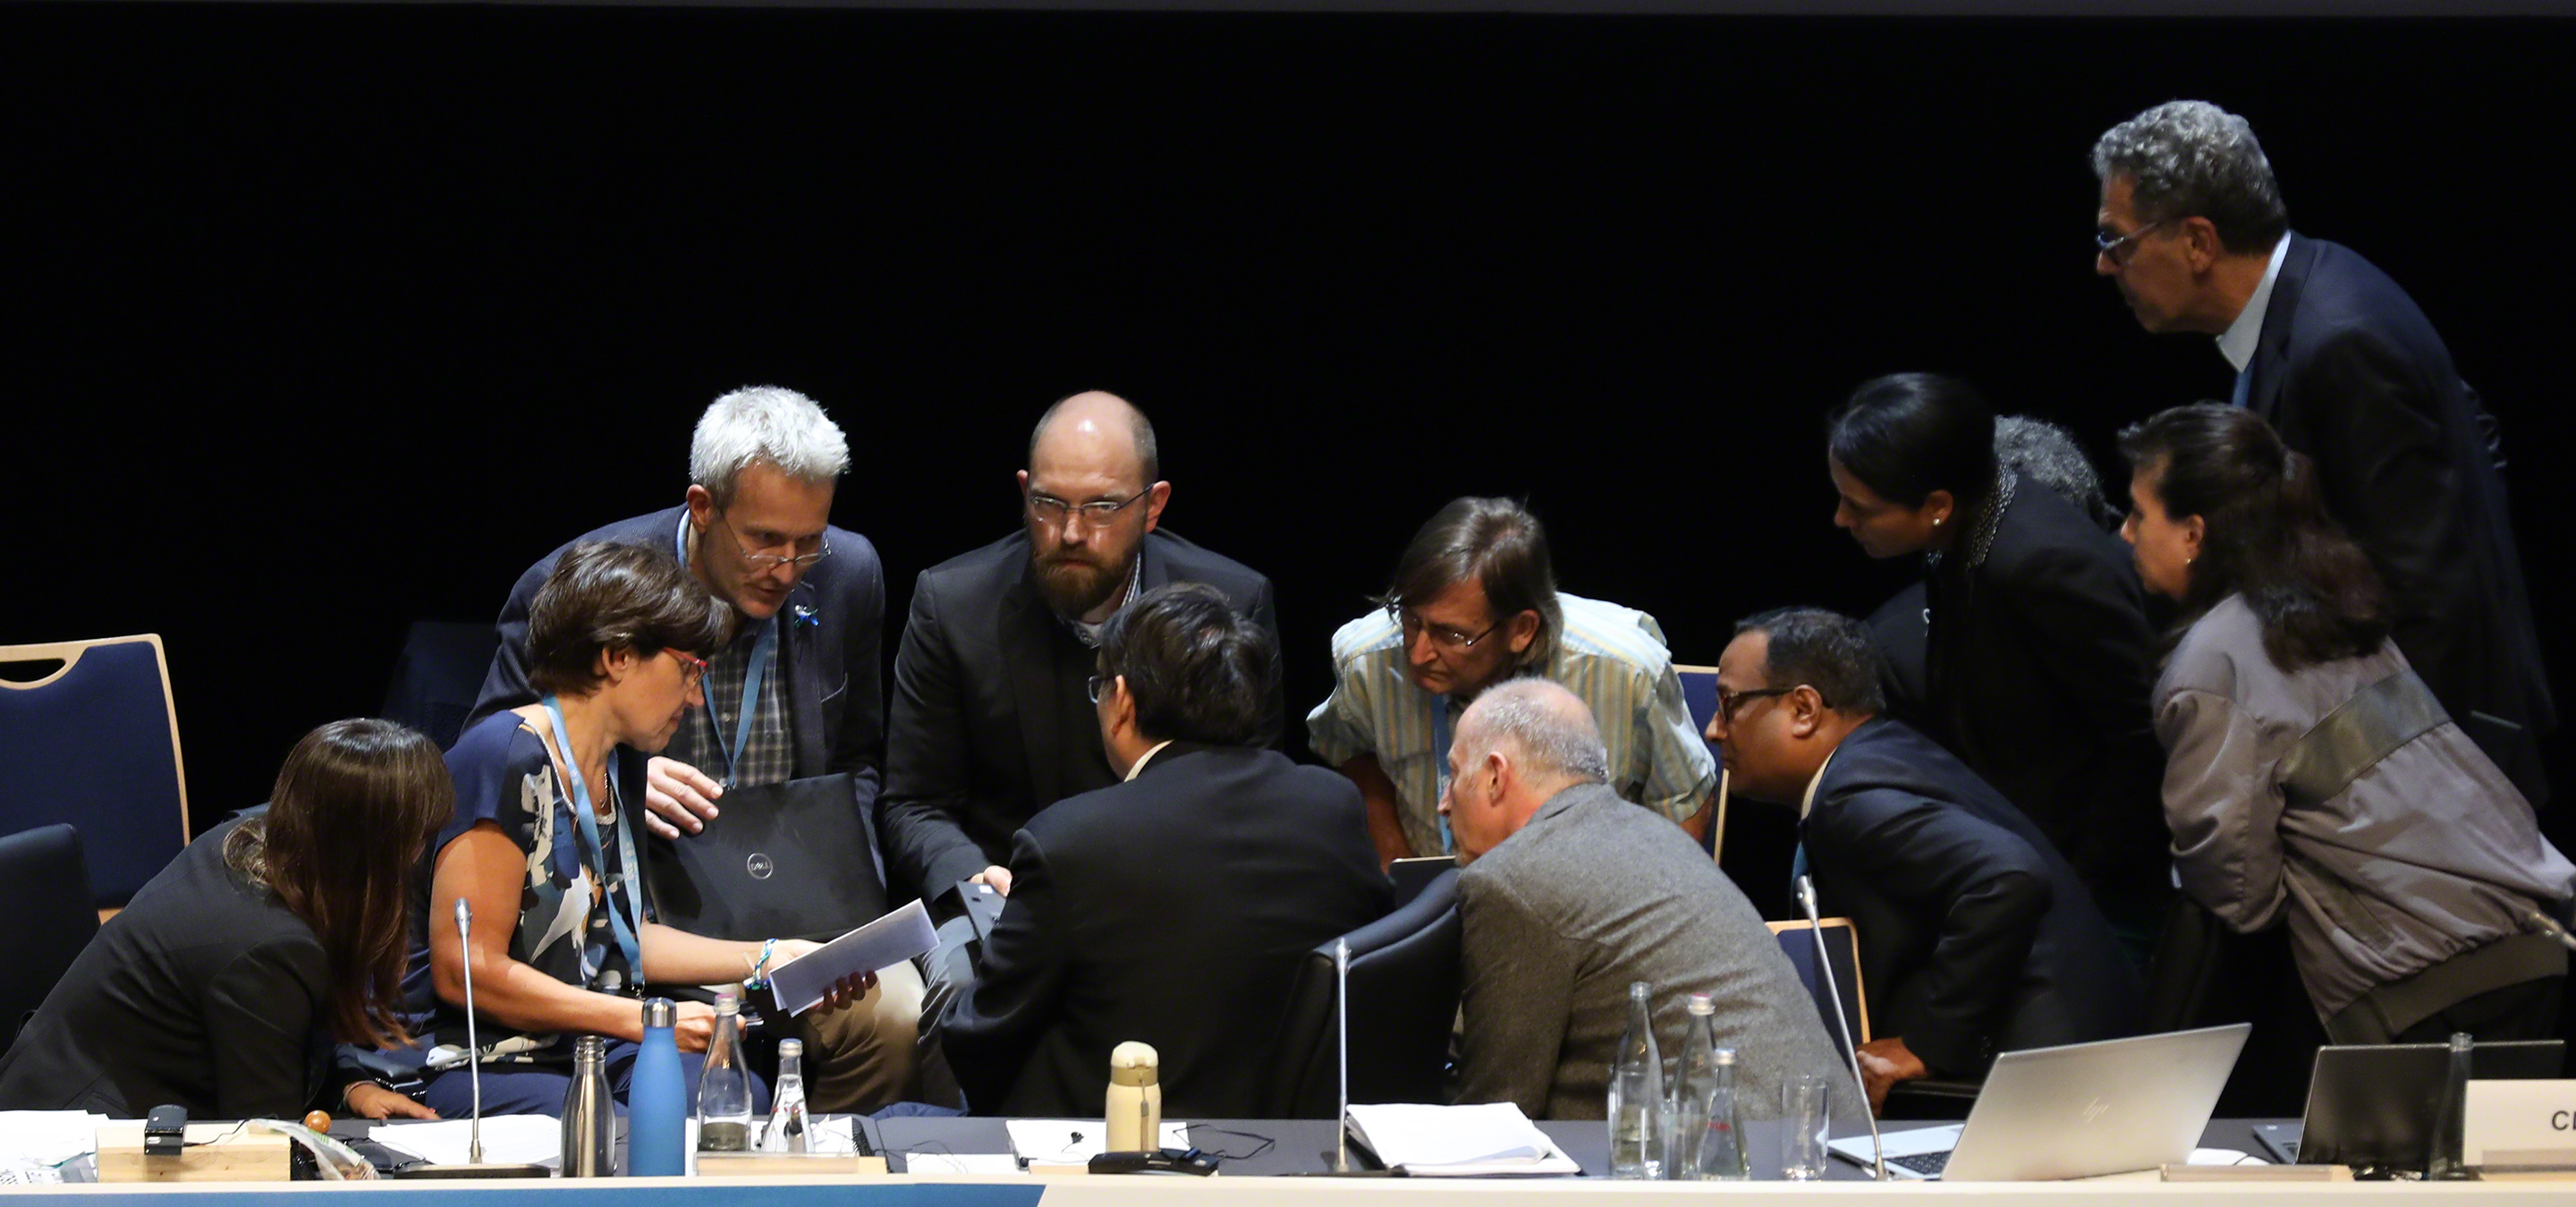
51st Session of the Intergovernmental Panel on Climate Change, 24 September 2019. Credit: IISD/ENB | Mike Muzurakis.
There is “low confidence” in how the frequency of cyclones might change in the future, but “most modelling studies project some decrease”. For those cyclones that do occur, there is “very high confidence” that sea level rise “will lead to higher storm surge levels”.
Extreme high waters, due to combinations of rising sea levels, tides, storm surges and increasing wave height, have already increased in frequency since the 1970s.
There is “high confidence” that extreme sea level events, which would historically have been seen only once per century, “are projected to occur frequently (at least once per year) at many locations by 2050”, regardless of the pathway of future greenhouse gas emissions.
Turning to marine heatwaves, where extremely high ocean heat is sustained for days or months, these have “very likely doubled in frequency since 1982” and have become “longer-lasting, more intense and more extensive”.
It is “very likely” that 84-90% of the marine heatwaves during 2006-2015 can be attributed to human-caused warming. And these heatwaves have “negatively impacted marine organisms and ecosystems in all ocean basins over the last two decades”.
While limiting greenhouse gas emissions would “substantially reduce” the increase in severity, “there is high confidence that marine heatwaves will increase in frequency, duration, spatial extent and intensity in all ocean basins under future global warming”.
If emissions are low, then marine heatwaves could still become 20 more frequent by the end of the century, relative to pre-industrial times. If emissions are high, such heatwaves could become 50 times more frequent.
One of the most important drivers of marine heatwaves, according to the report, is the El Niño southern oscillation (ENSO). Here, too, climate change is expected to “likely increase” the frequency of extremes this century and is “likely to intensify existing hazards”.
“Extreme El Niño events are projected to occur about twice as often under both RCP2.6 and RCP8.5 in the 21st century when compared to the 20th century (medium confidence).”
The report also notes that “the strongest El Niño and La Niña events since the pre-industrial have occurred during the last fifty years”.
There is “low confidence” in detecting links between rapid Arctic warming and extreme weather events in northern hemisphere mid-latitudes, such as northern Europe.
Finally, the chapter explores the concept of “compound events and cascading impacts”, where several types of extreme combine and amplify the risks. Despite their significant potential consequences, this is another example of “deep uncertainty”, due to a lack of data.
“The body of literature on compound risks and cascading impacts is growing, but is still rather small. One area where there seems to be a serious lack of literature is in the assessment of the economic impacts of extreme and abrupt/irreversible events.”
To give one example, the report says that coasts are “experiencing larger changes to multiple phenomena simultaneously such as sea level rise and cyclone intensity”. It continues: “Failing to account for the multiple factors responsible for extreme events will lead to an underestimation of the probabilities of occurrence (high confidence).”
What are the socioeconomic implications of a changing ocean?
The report makes it clear that extensive changes to the marine biodiversity and ecosystem services provided by the world’s oceans will trigger a variety of socioeconomic changes in the coming years.
Sea level rise (see Q8) and melting glaciers (Q2) are two of the most significant shifts expected to impact lives and livelihoods, driving changes in agriculture, tourism and other key sectors involving millions of people.
But there are also more specific issues that are likely to emerge, ranging from water-borne diseases to cultural impacts, many of which are discussed in chapter 5 of the report:
“Human communities heavily depend on the ocean through the goods and services provided by marine ecosystems. The values of ocean-based economic activities are estimated to be trillions of USD, generating hundreds of millions of jobs.”
So varied are the knock-on effects of changes to the state of the oceans and cryosphere that, as the SPM notes, it “interacts with each aspect of sustainability reflected in the UN Sustainable Development Goals”. The report makes it clear these changes will, therefore, hamper the ability of societies to achieve sustainable development.
Changes to fisheries are discussed at length in the report (see Q5 and Q10). Gross revenues from the world’s marine fisheries were around $150bn in 2010 USD, providing jobs for around 260 million people. As stocks are depleted and critical species are forced to migrate, there will be a need to adapt to a less reliable future.
Seafood is an essential contributor to humanity’s health, as “over 4.5bn people in the world obtain more than 15% of their protein intake from seafood, including algae and marine mammals as well as fish and shellfish”. Many of the populations at risk from climate-related marine food insecurity, such as in the Pacific Islands and West Africa (see figure below), reside in areas “where land-based food production is also at risk”.
Strong dependence on seafood and limited alternatives mean these risks are likely to increase, according to the report. “Although direct evidence from attribution analysis is not available, climate change may have already contributed to malnutrition” in vulnerable and Indigenous communities, it notes.
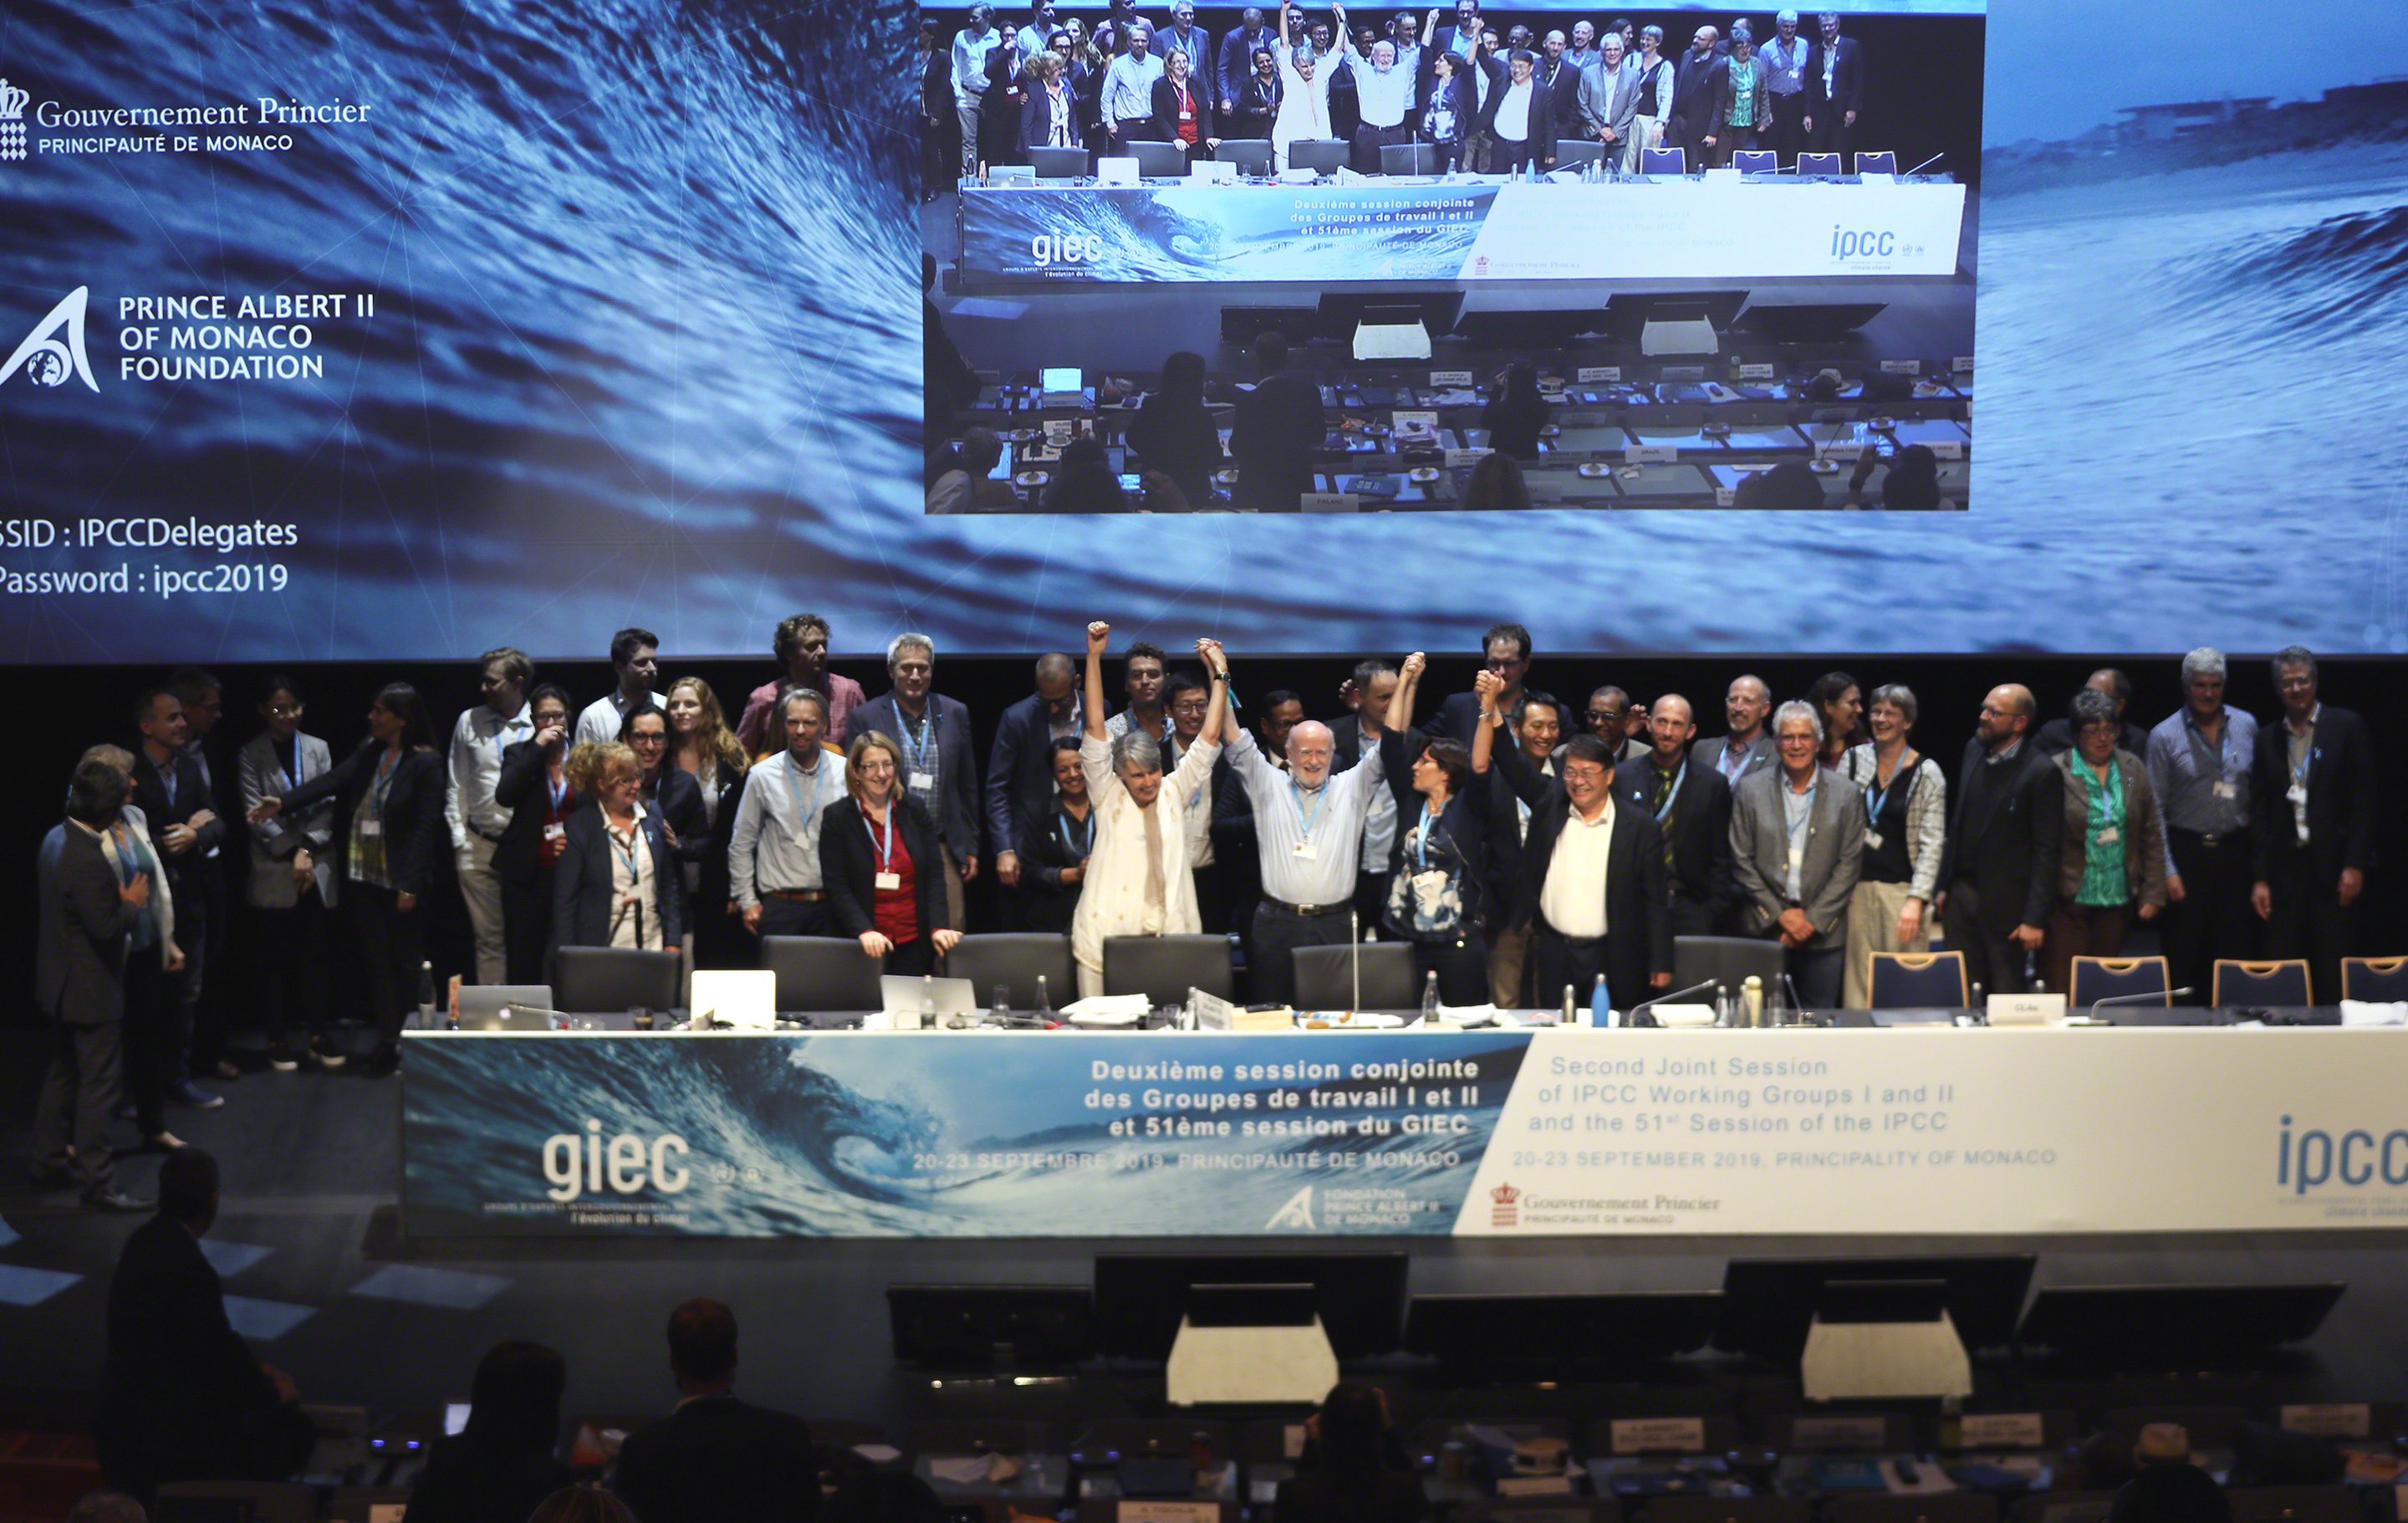
51st Session of the Intergovernmental Panel on Climate Change, 24 September 2019. Credit: IISD/ENB | Mike Muzurakis.
On fisheries, in particular, the report also notes potential for conflicts resulting from climate change, particularly as certain species move into waters controlled by different territories.
The SPM says “strengthening precautionary approaches”, such as attempting to rebuild overexploited stocks, will make those fisheries less vulnerable to climate change.
“Coastal tourism and other marine-related recreational activities contributes substantially to the tourism sector,” the report notes, citing an estimate that around 121 million people each year participate in ocean-based tourism, spending $47bn in 2003 USD and supporting one million jobs.
Extreme events and coral bleaching are among the climate-related issues placing tourism at risk, particularly for nations such as the many Caribbean islands that rely on it as their main source of foreign revenue. However, the report does note that due to the high carbon footprint of tourism, “any reduction in the intensity of this sector would help mitigate climate change”.
The report also notes that there is “high confidence” that sea level rise, including increases in storm intensity and other extreme events will devalue coastal properties, particularly on small tropical islands.
Warming waters are also expected to expand the range of certain bacteria and harmful algal blooms, with potentially severe consequences for human health. Cholera is highlighted as one disease likely to become more of a threat. It is spread by bacteria that inhabit warm waters and have already been observed spreading to the poles and being dispersed during extreme events.
The report also touches on the the impact changing oceans can have on cultures, ranging from traditional customs based on specific seafood items to the aesthetic value of the Great Barrier Reef:
“There are no effective substitutions for, or adequate compensation for, lost sites of significance. As sensitivity marine ecosystems such as coral reefs and kelp forest are impacted by climate change at rapid rate, these can lead to the loss of part of people’s cultural identity and values beyond the rate at which identify [sic] and values can be adjusted or substituted.”
Besides directly absorbing CO2 from the atmosphere, oceans can also contribute indirectly to emissions reductions by serving as sites for marine renewable energy projects. Offshore winds, tides, waves, ocean thermal gradients, currents and salinity gradients all provide means to extract energy and replace fossil fuels.
However, the report notes that “while such approaches offers a way to mitigate climate change, changes in climatic conditions (such as waves and winds) may impact marine renewable energy installations and their effectiveness”.
What has the reaction been?
The report has been the subject of extensive media coverage (see Carbon Brief’s full media summary in today’s daily briefing newsletter).
Several publications lead their coverage on the IPCC’s projections of sea level rise. For example, the Guardian states that: “Extreme sea level events that used to occur once a century will strike every year on many coasts by 2050, no matter whether climate heating emissions are curbed or not.”
Like many other outlets, it also says the IPCC’s updated projections of sea level rise by 2100 are “higher than those it made in 2014, due to unexpectedly fast melting in Antarctica”. This is not quite correct, as the IPCC has only raised its projections for sea level rise if emissions are very high. The Guardian also incorrectly states that the IPCC does not consider “the worst-case scenario” for sea levels.
Other coverage, including that of the Press Association and the Washington Post, focuses on the wider array of “unprecedented” and “monumental” changes global warming is driving for oceans and ice. BBC News says “around 70% of the near surface permafrost [is] set to thaw if emissions continue to rise”, according to the report, potentially releasing “10s to 100s of billions of tonnes” of carbon.
The New York Times says “climate change is heating the oceans and altering their chemistry so dramatically that it is threatening seafood supplies, fuelling cyclones and floods and posing profound risks to the hundreds of millions of people living along the coasts”.
BuzzFeed News picks out the IPCC’s finding that some island nations could become “uninhabitable” as a result of rising seas. The Daily Express says sea-level rise “will impact as many as one billion people by 2050”, which misinterprets the IPCC’s finding that this many people will live in low-lying coastal areas by 2050. Reuters says the report “found that radical action may yet avert some of the worst possible outcomes of global warming”.
Nature’s headline says the “world’s oceans are losing [their] power to stall climate change”, continuing that the seas have “long helped to stave off climate change by absorbing heat and CO2 from the atmosphere. But that is changing.”
Writing for the Conversation, the Open University’s Prof Mark Brandon (who is also one of Carbon Brief’s contributing editors) says the report is “relatively conservative with its conclusions”, noting that the “latest science is painting an increasingly grave picture for the future of our oceans and cryosphere”.
The Australian’s coverage states “major uncertainties still remain” and adds that the “worst-case scenario for sea-level increases by 2100 has been lifted to between 60cm and 110cm if greenhouse gas emissions continue to increase strongly”. (This is not the worst-case scenario in the report, which says there is a 17% chance that sea level rise could exceed 1.1m, if emissions are very high, and that an increase of more than 2m “cannot be ruled out”.)
Accompanying the media coverage is commentary from NGOs expressing concerns about the diverse climate-driven impacts outlined in the report – and their consequences for global ecosystems and people.
World leaders at this week’s UN Climate Action Summit in New York “pretended to care”, says Greenpeace UK oceans campaigner Chris Thorne, but without ambitious climate commitments “they are failing the millions of climate strikers around the world who came out onto the streets demanding radical change”.
Warning that rich countries have a “bigger responsibility” to cut carbon emissions, ActionAid’s global lead on climate change Harjeet Singh outlines the consequences of failing to do so:
“Millions living in low lying coastal areas and along riverbanks will be forced to flee, as their homes and land are washed away or swallowed up. Fresh water resources will be contaminated, crops and farmlands destroyed and this may lead to conflicts over scarce resources. The world must unite and act urgently or face total chaos.”
Dr Stephen Cornelius, chief adviser on climate change for WWF, also ties the report to the wider political situation and “weak country climate pledges”, warning that “we cannot gamble with people’s lives”:
“The politics can’t change the science. Given the stakes, leaders must act now to ensure a positive future for the planet and invest in rapid and deep cuts to greenhouse gas emissions as well as significantly increasing funding for resilience and adaptation.”
Many scientists have also weighed in on the new report. Prof Andrew Shepherd, director of the Centre for Polar Observation and Modelling at the University of Leeds, says 2019 has already “been a bad year for Earth’s ice”, but notes “these changes are not unexpected”:
“We have had satellite measurements and climate models for nearly three decades – a generation – and we are still reporting the changes as if they are news. The real concern is for Antarctica and Greenland, because it has become increasingly clear that their ice losses are tracking towards the upper range of the IPCC’s predictions.”
Prof Grant Bigg, professor of earth system science at the University of Sheffield, says one “very striking” component of the report is “the degree to which change in so many environmental characteristics will occur despite even the best efforts to control emissions”:
“Melt of the Earth’s glaciers and sea-ice will continue over the next few decades, leading to flooding hazards and ecosystem changes, sea level will continue to rise, ocean corals will continue to be stressed through increasing temperatures – these are just a selection of changes that will occur by 2050 even if the Earth’s warming is restricted to 1.5C. Environmental change will increasingly challenge governmental efforts to cut emissions and produce adaptation strategies.”
According to Prof Jonathan Bamber, director of the Bristol Glaciology Centre at the University of Bristol (who was interviewed by Carbon Brief earlier this year), the evidence is “clearer than ever” that anthropogenic global warming is driving changes in the cryosphere and oceans.
“No one who has been paying attention needs another wake-up call about how bad things could get but, if they did, there is plenty to be concerned about for the future of humanity and social order from the headlines in this report.”