
Dr Nathanael Melia
06.09.2016 | 3:41pmA guest article by Dr Nathanael Melia, a post-doctoral research assistant in the Department of Meteorology at the University of Reading.
Ever since the East India Company sailed the high seas in the days of the British Empire, international traders have sought the most cost-effective route between the world’s ports.
For many, the shortest route between the Atlantic and Pacific oceans would be through the Arctic, yet sea ice provides a formidable deterrent for all but the hardiest ships.
However, while once just a dream of early explorers such as Roald Amundsen, an Arctic shipping route may soon become a reality. The decline in sea ice cover means there is now serious speculation over commercial trans-Arctic shipping.
In our new study, recently published in Geophysical Research Letters, we consider whether this will be possible during the 21st century.
Current shipping patterns
When Portuguese explorer Vasco da Gama successfully sailed from Portugal to India in the late 15th century, he established a sea route between Europe and east Asia that would be used by international traders for hundreds of years.
Then, in 1869, the opening of the Suez Canal provided shipping companies with a shortcut. The new route, through the Red and Mediterranean seas, allowed ships to avoid the lengthy and hazardous journey via the Cape of Good Hope at the southern tip of Africa.
A substantial proportion of the world’s container shipping still uses this route today. But a passage through the Arctic would be around 40% shorter – potentially reducing journey times even further and saving fuel.
This is one reason why major shipping nations such as China, Japan, Singapore, and South Korea sought – and gained – observer status to the Arctic Council in May 2013, despite their lack of territory in the Arctic Circle.
Data from ship tracking systems suggests that a significant number of vessels are already using the Arctic. The data reveals that traffic is focused on two main routes: first, the Northern Sea Route (NSR) – through the Norwegian and Barents seas and along Russia’s northern coast – predominantly for journeys between Europe and Asia. The second, via the North West Passage (NWP) through the Canadian Archipelago, as a route from the US east coast to Asia without needing the Panama Canal.
Our analysis of routes through the Arctic, based on the observed ice conditions, reveals that the NSR and NWP have only recently become available.
You can see this in the figure below. The main map shows the routes that have hypothetically been sufficiently free of sea ice for ships to navigate during summers between 2007 and 2014. The colours of the routes indicate which year they were open.
The inset map illustrates the main Arctic transit routes, including the NSR and NWP as well as the Transpolar Sea Route (TSR), which is the shortest route straight across the Arctic Ocean.
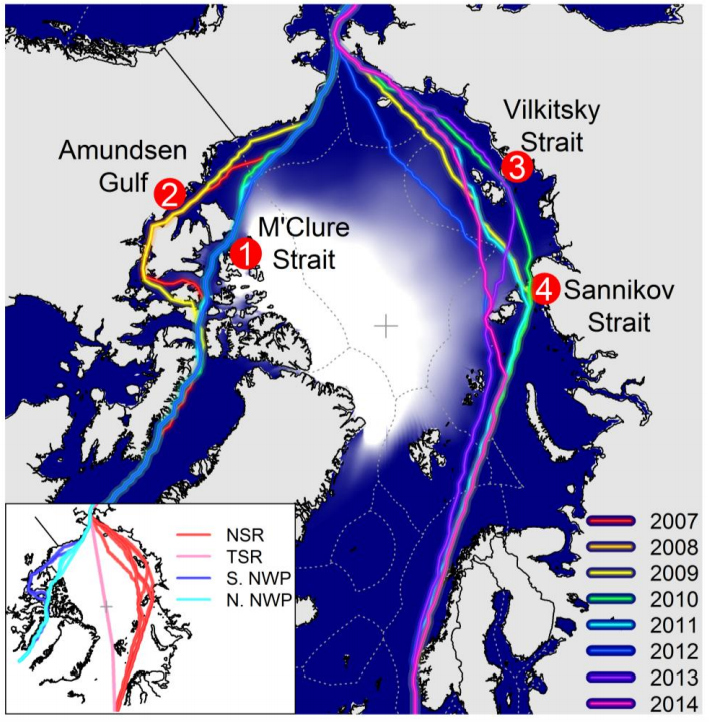
Hypothetical Open Water vessel routes sailing through the September sea ice thickness field for eight recent years from the PIOMAS reanalysis. Routes only plotted when Arctic transits are possible. Four particular points are highlighted, including: 1) M‘Clure Strait – the shortest North American route of the northern-NWP; 2) Amundsen Gulf – the longer southern-NWP; 3) Sannikov Strait, and 4) Vilkitsky Strait. Colour of routes indicates which year it was available to navigate. Inset map shows the main Arctic transit options.
It’s worth highlighting here that natural variability plays a pivotal role in the availability of these routes. For example, 2007 was a record low for summer sea ice extent in the satellite record (subsequently beaten by 2012), yet the NSR remained closed during that summer, blocked off by an ice bridge between the Russian coast and the main ice pack.
Future Arctic routes
To make projections of how Arctic shipping routes could open up in the future, we used observed data from the last 20 years to fine-tune existing climate model simulations.
We then developed a computer algorithm that finds the fastest route across the Arctic based on the future ice conditions simulated by the models.
Our algorithm found routes for two types of ship: “Polar Class 6 (PC6)” vessels that can navigate through up to 1.2m of sea ice, and “Open Water (OW)” vessels, that essentially require conditions to be completely free of ice. The algorithm takes into account slower ship speeds through thicker ice and returns the fastest route, which is not necessarily the shortest.
By using a collection of multiple model runs, our approach takes into account the natural ups and downs of sea ice conditions, as well as the long-term declining trend.
We “sailed” the two types of vessel through the projected sea ice every year for three periods in the 21st century – early (2015-29), mid (2045-59) and late (2075–2089), and for different scenarios of greenhouse gas emissions through this century.
You can see our results in the figure below, for the low (“RCP2.6”) and high (“RCP8.5”) emissions scenarios and for the three time periods. These show the average availability of routes during September – when sea ice is at its smallest extent. The pink lines show routes that only the PC6 ships can navigate, and the blue lines show the routes for the OW vessels.
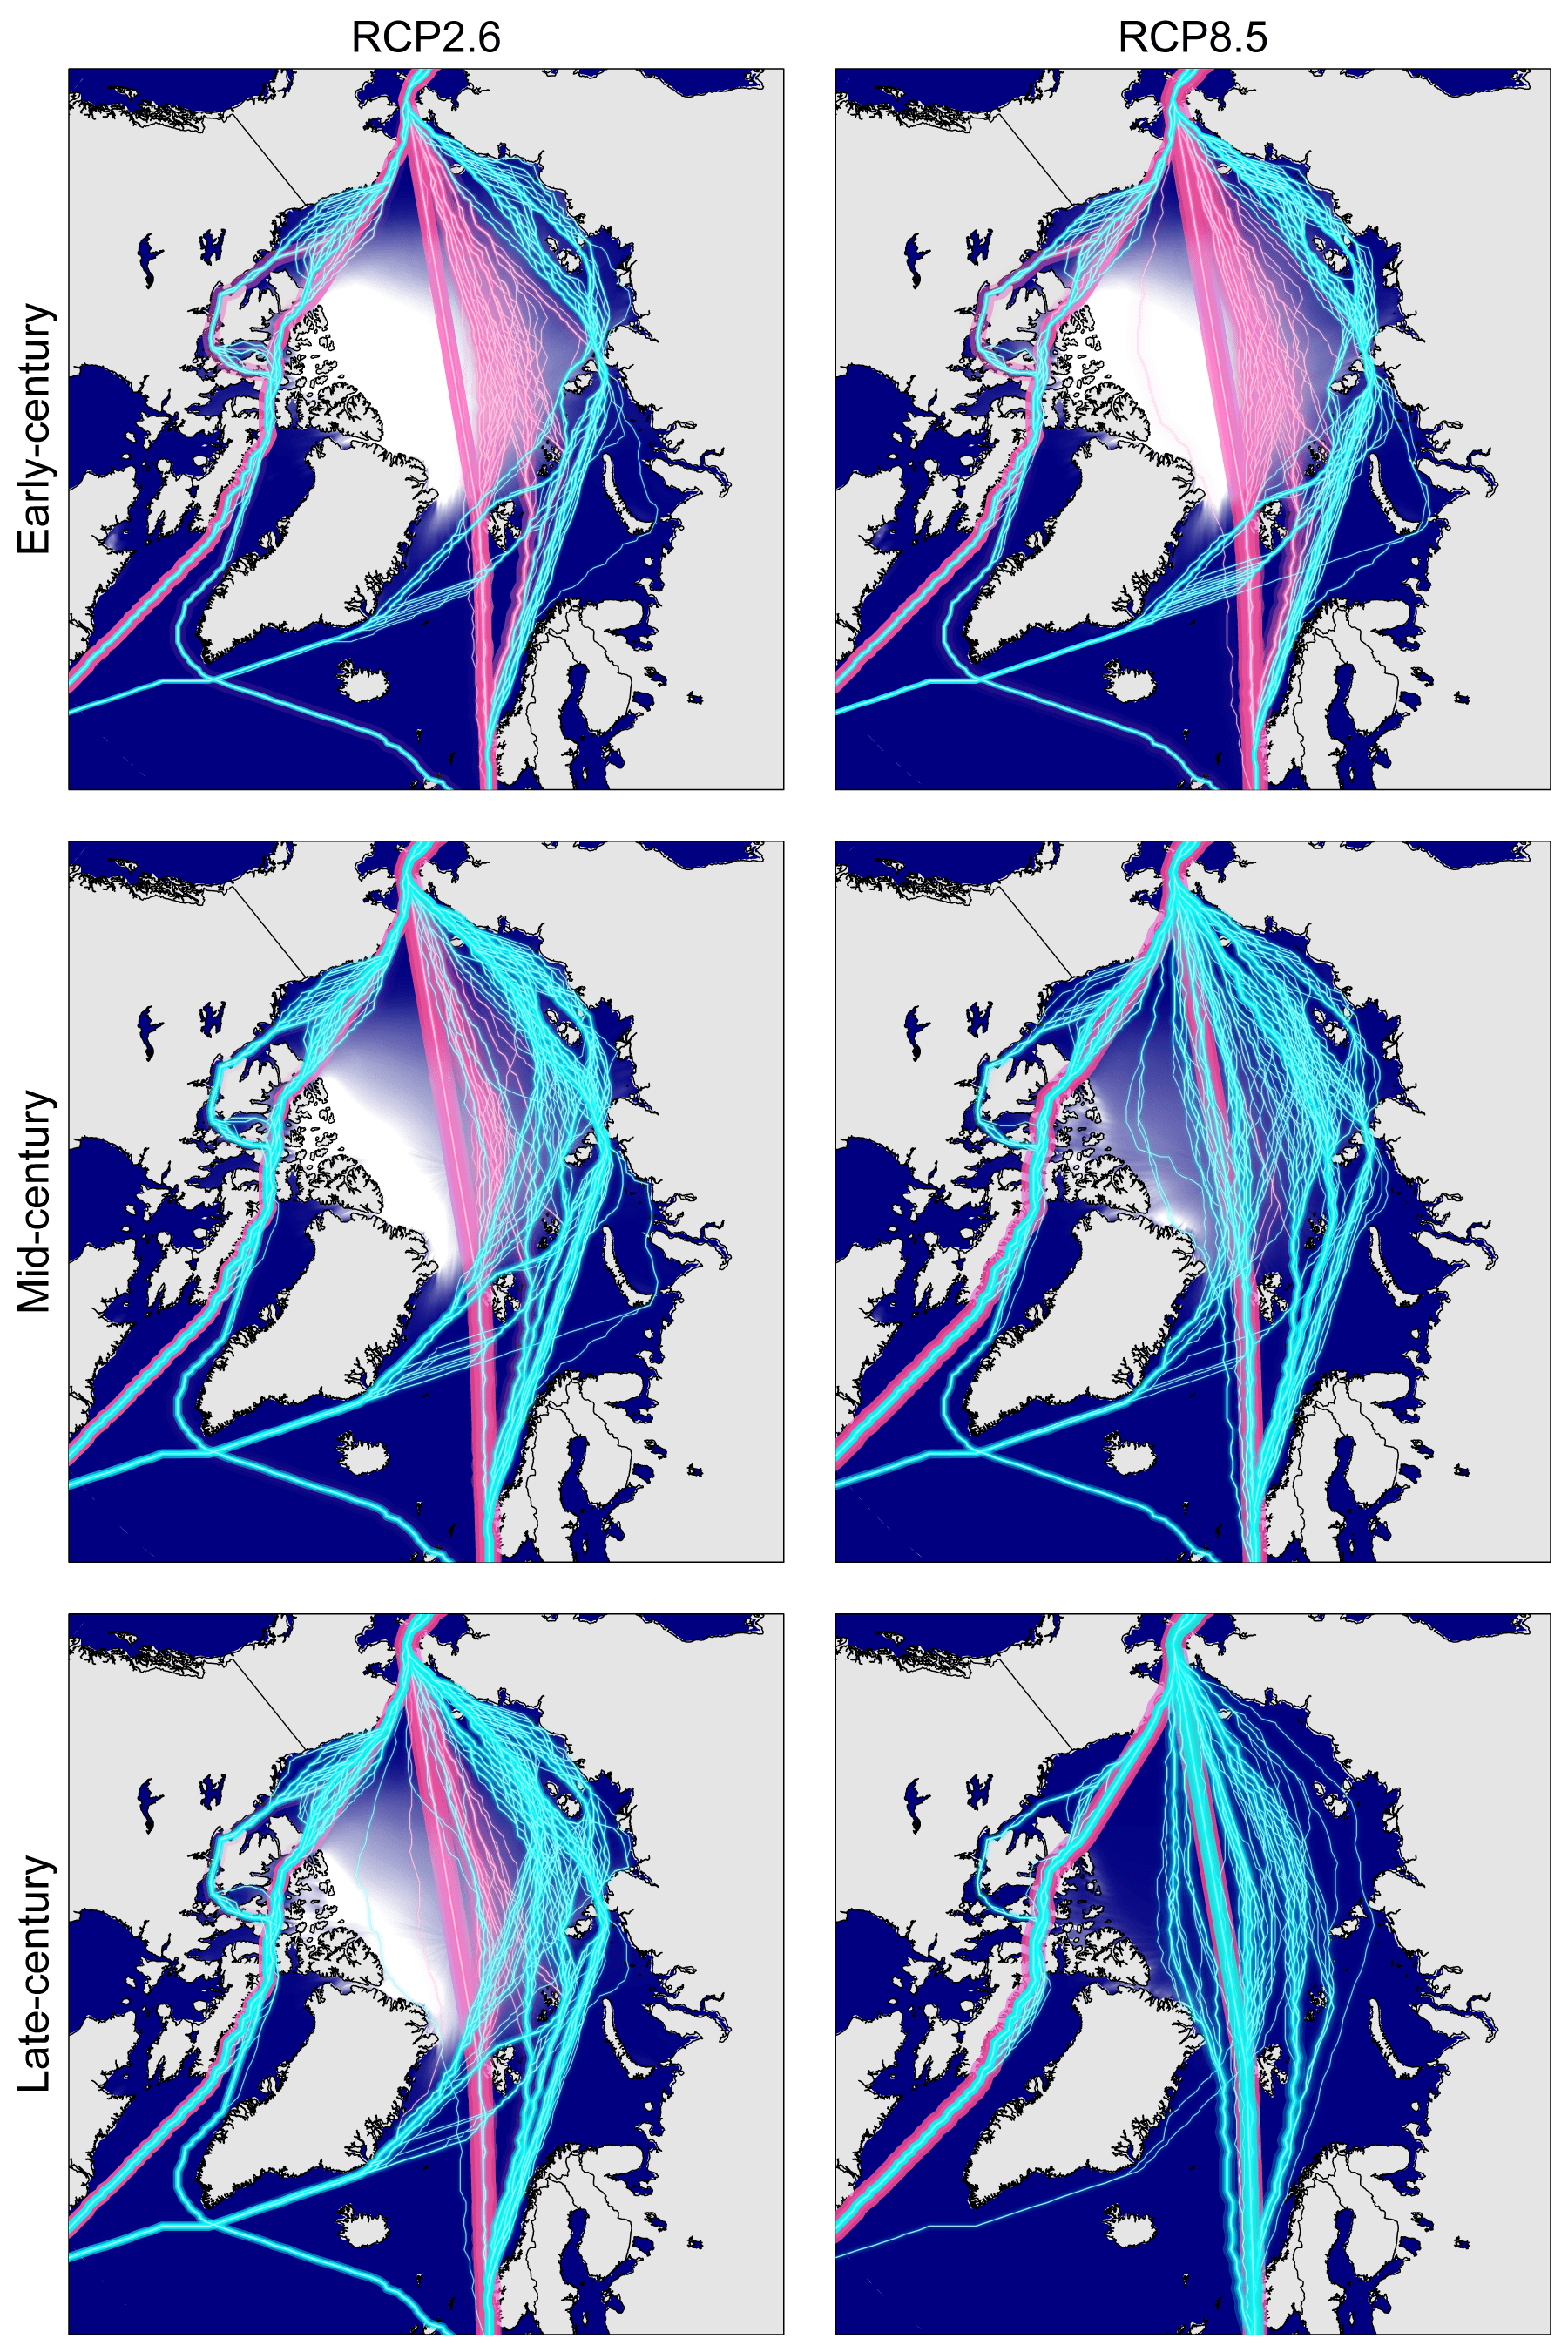
Projected changes to September Arctic routes for ice strengthened vessels (pink) and standard vessels (blue). Left-hand maps show results for the low emissions scenario (RCP2.6) and right-hand maps show results for the high emissions scenario (RCP8.5). Upper, middle and lower maps show results for the early (2015-29), mid (2045-59) and late (2075–2089) 21st century, respectively.
Projections for the near term (2015-29) under low or high emissions suggest that OW vessels could make the trip across the Arctic approximately once every three years. This is mostly around the edges of the Arctic using the NSR and NWP. In contrast, the ice-strengthened PC6 ships could make the voyage across the Arctic on the TSR for the vast majority of years.
For journey times, this would see OW and PC6 vessels make a passage from Rotterdam to Yokohama in around 20 days and 18 days, respectively. The equivalent journey through the Suez Canal would take at least 30 days – not including delays and extra time required to navigate the canal, which can be considerable.
For a shipping route between New York and Yokohama using the NWP, journey times would be reduced to 21-22 days, compared to around 25 days via the Panama Canal.
By the middle of the century, our algorithm suggests there is a dramatic change for the prospects of OW vessels. The frequency of Arctic route availability essentially doubles for both emissions scenarios, and even the TSR is often open – indicating that central Arctic sea ice occasionally disappears entirely – saving another 1-2 days of time.
For PC6 ships, they are able to use the TSR during September in virtually all years, taking journey times down to around 17 days for European shipping and about 20 days for American.
Towards the end of the century the effect of the emissions scenario becomes much more prominent. In a high emissions world, for example, there is no significant ice left on the Arctic Ocean in September, hence OW vessels can use the TSR every year. With a low emissions scenario, OW routes are regular but slower, relying on the NWP and NSR rather than the TSR.
In addition to summer routes becoming increasingly regular, accessibility is projected to increase throughout the year, with the shipping season increasing from a few summer months in the early century to the majority of the year by the end of the century.
Will they be used?
The results from this study indicate that Arctic routes will provide a viable alternative to the traditional canal routes – with the European ships potentially saving more time than North American vessels.
If human greenhouse gas emissions aren’t curbed, global shipping could realistically use Arctic routes without ice-strengthened ships, and take advantage of the substantial distance saving they afford.
If emissions are reduced in line with the Paris Agreement, then the potential for Arctic shipping will still increase, but is more likely to remain a niche market transporting goods to and from the Arctic.
However, it’s worth noting that while sea ice is the largest physical hazard for trans-Arctic shipping, there are other economic and political factors that will affect whether the routes become commercially viable.
Finally, our findings also reveal that Arctic sea ice will still be present in winter for the majority of the 21st century, implying that Arctic shipping routes will open and close at different times and for different periods each year. This enhances the need for further research in the field of seasonal Arctic climate predictions, which is the topic of a new project we are currently undertaking.
This guest article is based on the following journal paper: Melia, N et al. (2016) Sea ice decline and 21st century trans-Arctic shipping routes, Geophysical Research Letters, doi:10.1002/2016GL069315