Dead sea fan coral, Caribbean sea. Credit: Helmut Corneli / Alamy Stock Photo.
Marine heatwaves could become 41 times more likely across the globe by 2100 than in pre-industrial times if little is done to stop greenhouse gas emissions, a new study finds.
Such a surge in heatwaves could push “marine organisms and ecosystems to the limits of their resilience and even beyond, which could cause irreversible changes”, the researchers write in the journal Nature.
However, limiting global temperature rise to 1.5C above pre-industrial levels – the aspirational target of the Paris Agreement – could more than halve the rise in frequency and intensity of marine heatwaves, the lead author tells Carbon Brief.
Scorching seas
As with a heatwave on land, a marine heatwave is an extended period of unusually high temperatures.
Surges in sea temperatures can have large impacts on underwater ecosystems. The Great Barrier Reef, for example, has experienced four mass coral bleaching events caused by prolonged exposure to high sea surface temperatures (SSTs) in the past two decades.
In 2010-11, a marine heatwave caused the loss of 36% of the seagrass meadows in Shark Bay in Western Australia – an important refuge for dugongs, green turtles and manta rays.
The new research uses a combination of satellite data and modelling to investigate how climate change has influenced the frequency and severity of marine heatwaves to date. It then uses this information to, for the first time, make projections about how marine heatwaves are likely to change in the coming decades.
The results show that marine heatwaves have “already become longer-lasting and more frequent, extensive and intense in the past few decades”, says lead author Prof Thomas Frölicher, a researcher at the ocean modelling group at the University of Bern. He tells Carbon Brief:
“If temperatures were to rise by 3.5C relative to pre-industrial levels – as is predicted to result from current national policies for the reduction of global carbon emissions – the number of marine heatwave days will be 41 times higher than in pre-industrial times.”
Ocean gazing
For the study, the researchers used a set of 12 global climate models to explore how marine heatwaves have changed from pre-industrial times (starting in 1861) to 2100.
Glossary
RCP8.5: The RCPs (Representative Concentration Pathways) are scenarios of future concentrations of greenhouse gases and other forcings. RCP8.5 is a scenario of “comparatively high greenhouse gas emissions“ brought about by rapid population growth, high energy demand, fossil fuel dominance and an absence of climate change policies. This “business as usual” scenario is the highest of the four RCPs and sees atmospheric CO2 rise to around 935ppm by 2100, equivalent to 1,370ppm once other forcings are included (in CO2e). The likely range of global temperatures by 2100 for RCP8.5 is 4.0-6.1C above pre-industrial levels. The release of the Shared Socioeconomic Pathways (SSPs) has introduced a number of additional “no-new-policy” scenarios, meaning RCP8.5 is no longer the sole option available to researchers as a high-end no-mitigation pathway.
RCP8.5: The RCPs (Representative Concentration Pathways) are scenarios of future concentrations of greenhouse gases and other forcings. RCP8.5 is a scenario of “comparatively high greenhouse gas emissions“ brought about by rapid population growth,… Read More
For the future period (2006-2100), the researchers simulated heatwave frequency under two scenarios: a scenario where global warming reaches 3.5C, using a “business as usual” baseline (“RCP8.5”) and a scenario where future temperature rise is limited to 1.5-2C (“RCP2.6”).
The researchers defined a marine heatwave as any day where SSTs are in the top 1% of the local range of the current climate.
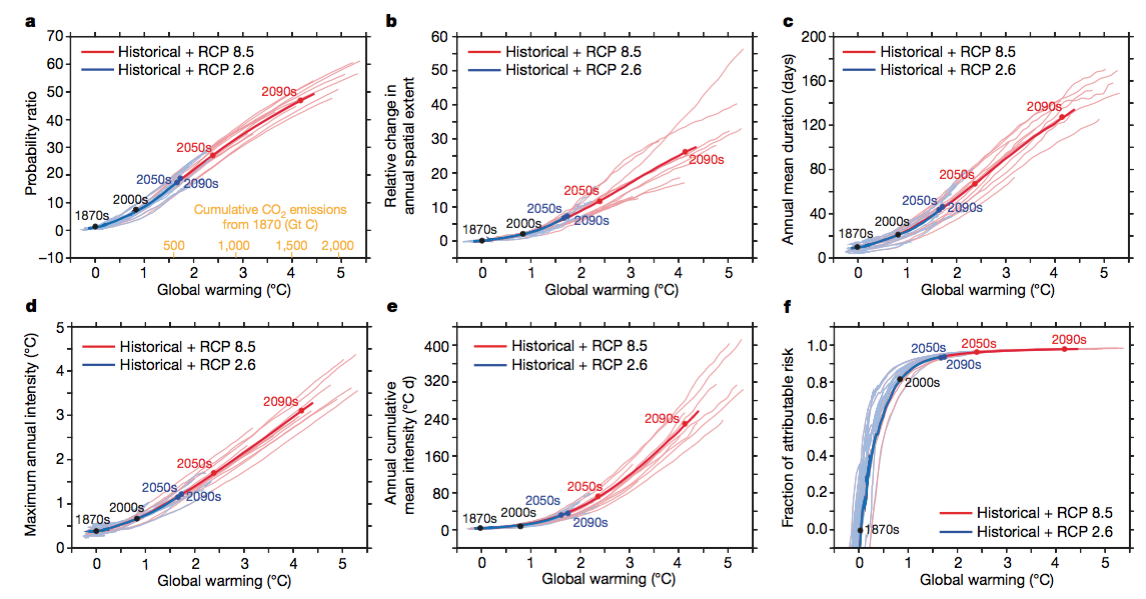
The charts below show the expected impact of global warming on: (a) the “annual probability ratio” – the fraction by which the number of marine heatwave days per year has changed; (b) the average area of an individual heatwave; (c) the average length of a heatwave; (d) the maximum temperature of a heatwave; and (e) the “annual cumulative mean intensity” of a heatwave – which is a product of the expected number of heatwave days and maximum heatwave temperature.
On the charts, the results for RCP2.6 (blue) and RCP8.5 (red) are shown.
The simulated impact of global warming on (a) the annual probability ratio for heatwave days, (b) the average area of an individual heatwave, (c) the average length of a heatwave, (d) the maximum temperature of a heatwave, (e) the annual cumulative mean intensity of a heatwave and (f) the proportion of marine heatwaves that are attributable to human-caused global warming. Results are shown for RCP2.6 (blue) and RCP8.5 (red). Source: Frölicher et al. (2018)
The results suggest that, at present (2000s on the chart), the chances of marine heatwaves occuring are nine times higher than in pre-industrial times.
Glossary
RCP2.6: The RCPs (Representative Concentration Pathways) are scenarios of future concentrations of greenhouse gases and other forcings. RCP2.6 (also sometimes referred to as “RCP3-PD”) is a “peak and decline” scenario where stringent mitigation and carbon dioxide removal technologies mean atmospheric CO2 concentration peaks and then falls during this century. By 2100, CO2 levels increase to around 420ppm – around 20ppm above current levels – equivalent to 475ppm once other forcings are included (in CO2e). By 2100, global temperatures are likely to rise by 1.3-1.9C above pre-industrial levels.
RCP2.6: The RCPs (Representative Concentration Pathways) are scenarios of future concentrations of greenhouse gases and other forcings. RCP2.6 (also sometimes referred to as “RCP3-PD”) is a “peak and decline” scenario where stringent mitigation… Read More
Under 3.5C of global warming, the likelihood of a marine heatwave day is expected to be 41 times higher than in pre-industrial times. In other words, heatwaves that were likely to occur once in every 100 days in the pre-industrial era could occur once in every three days by the end of the century.
Additionally, the average area covered by a heatwave is expected to be 21 times larger and each event is expected around 100 days longer.
However, if warming is restricted to 2C – the upper limit set by the Paris Agreement – the number of marine heatwave days per year is expected to be 23 times higher than in pre-industrial times.
If warming is limited to 1.5C, the number of heatwave days is expected to be around 16 times higher. In addition, marine heatwaves are expected to cover a smaller area (25% of the area expected under 3.5C) and last for fewer days at a time.
A sixth chart (f) shows the proportion of marine heatwaves that are attributable to human-caused global warming.
To understand the influence of global warming on present-day heatwaves, the researchers compared the modelling results to temperature data taken via satellites, ships and buoys.
They found a high degree of similarity between the observed data and the results from models that included the historical global warming trend. This suggests that global warming has played a large role in driving changes to marine heatwaves, Fröelicher explains:
“We show that this change is very likely due to human-caused global warming. That’s because the observed change is mostly outside the range of the changes expected from natural internal variability.”
Their calculations show that, at present, around 87% of marine heatwaves are attributable to climate change. However, this figure could rise to nearly 100% with more than 2C of warming, they add.
Sweltering Arctic
The researchers also explored how the distribution of marine heatwaves is likely to change by the end of the century.
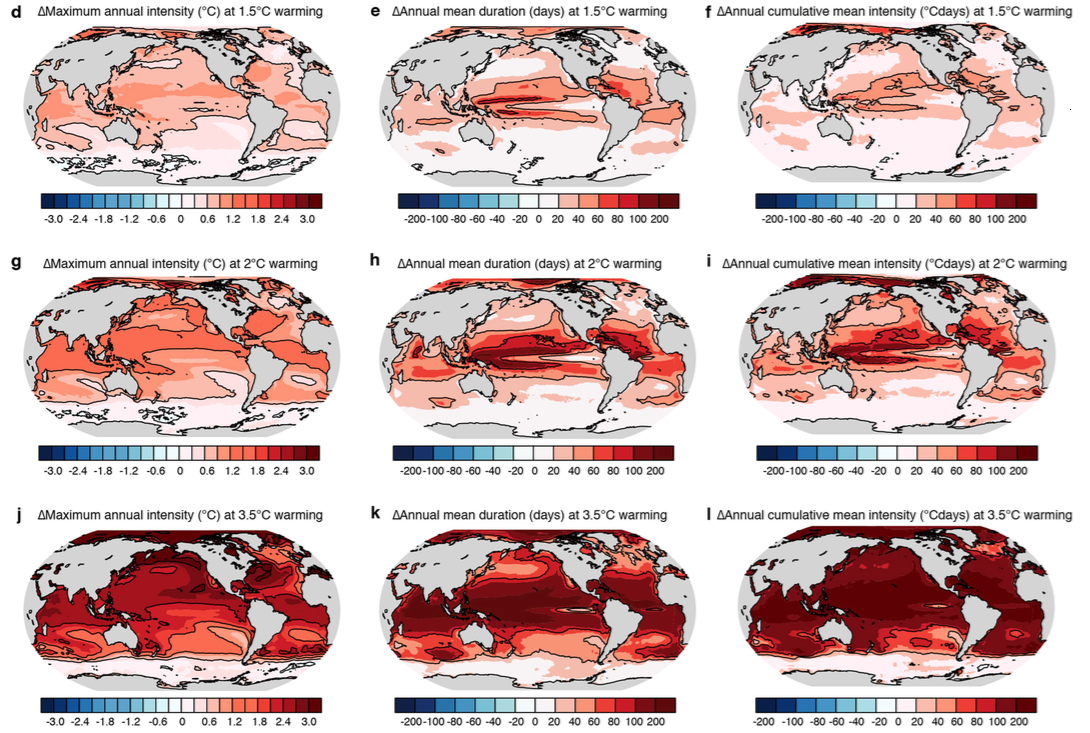
The maps below show the expected changes to maximum temperature, length and mean intensity of marine heatwaves in different parts of the world under 1.5C (top), 2C (middle) and 3.5C (bottom) of warming. On the maps, dark red is used to show large increases while white shows little to no change.
The expected changes to maximum temperature (left), length (middle) and mean intensity (right) of marine heatwaves under 1.5C (top), 2C (middle) and 3.5C (bottom) of global warming. Dark red is used to show large increases while white shows little to no change. Source: Frölicher et al. (2018)
The maps show how, under 1.5-2C, marine heatwaves are expected to more frequent and severe in the tropics. This is because, in the tropics, SSTs vary little throughout the year, the researchers say:
As a result, the same changes in annual mean SST lead to much larger changes in the probability of exceeding the 99th percentile.”
Under 3.5C, marine heatwaves are expected to increase in length and intensity across the tropics and northern mid-latitudes, as well as in the Arctic, the results show.
These changes correspond to the expected large changes to global temperatures, the researchers say. In a similar way to the tropics, the Arctic could be vulnerable to extremes because it currently faces very little sea temperature variability, they add.
Ecosystem meltdown
A large increase in marine heatwaves is likely to have “severe and long-lasting impacts” on marine life, Frölicher says. However, marine heatwaves are relatively poorly studied – and so understanding what the scale of these impacts could be is difficult, he says:
“So far, our understanding of the impacts of marine heatwaves on marine ecosystems has been gained opportunistically following a few recent events.
“The warm blob in the Pacific in 2013-2015 caused increased mortality of sea lions, whales and seabirds. In addition, a coast-wide bloom of toxigenic diatom [algae] was observed, which resulted in elevated toxins in marine mammals.”
Marine heatwaves could also have large impacts for humans, he adds:
“The heavy rain associated with the Peruvian marine heatwave in 2017 triggered landslides and flooding, which resulted in a death toll of several hundred, widespread damage to infrastructure and civil works and significant economic losses.”
The findings provide “an important step forward in understanding how humans are changing what extreme events look like in the ocean,” says Hillary Scannell, a PhD student at the School of Oceanography at the University of Washington, who was not involved in the research. She tells Carbon Brief:
“Although these types of studies usually have a doomsday ending, it is important to remember that these projections are dependent on the degree of expected warming. Curbing CO2 emissions now would certainly help steer us away from catastrophic ecological damage in the future.”