Guest post: Overshooting 2C risks rapid and unstoppable sea level rise from Antarctica

Guest authors
05.05.21
Guest authors
05.05.2021 | 4:00pmIn 2015, governments from across the world committed to the Paris Agreement and its goal of limiting global warming to 1.5C or 2C. Yet, the emissions pledges that those governments have since proposed put the world on course for as much as 3C of warming.
Such a mismatch between ambition and action could have huge ramifications for the world, not least for global sea level rise, which is already accelerating.
In a new modelling study, published in Nature, we show what the difference between meeting the Paris goals and overshooting them could mean for the melting ice of Antarctica.
At 1.5C or 2C, we find that Antarctic ice melt continues at similar levels as today – albeit a contribution that would continue for centuries.
However, at 3C, we find significant risks of rapid, irreversible sea level rise before 2100. Our model incorporates glaciological processes observed over the past several decades, including the impact of ice shelf loss on outlet glaciers and subsequent marine-based “ice cliff” collapse.
We also show that our model is able to accurately reproduce sea level changes in Earth’s ancient past, which increases confidence that they can simulate long-term impacts beyond 2100. Significantly, our model demonstrates threshold behaviour once warming passes 2C, revealing the risks of overshooting the Paris goal and the apparent limits of carbon removal to halt these processes once they have started.
Past + present = future
The past million years of the Earth’s history has seen a series of ice ages broken up by relatively short periods of warmer temperatures, known as “interglacials”.
Proxy data has revealed that, during the last of these – approximately 125,000 years ago – global average temperatures were about the same as today, but sea levels were around 6-9 metres higher.
The data suggest that large sections of the Greenland ice sheet – which has a modern volume equivalent to 7.4 metres of sea level rise – survived. This indicates that some portion of the West Antarctic ice sheet (WAIS) must have melted, even at today’s temperatures.
However, global temperatures today are rising, which means we need to find another analogue in the Earth’s distant past for clues about what might happen to sea levels in the future.
Current commitments to cut emissions under the Paris Agreement put the world on course for 2.5C of warming by 2100 (with a range of 1.9-3.0C). The mid-Pliocene, about 3m years ago, makes an appropriate period for comparison. Geologists think CO2 levels were about the same as today at 400 parts per million (ppm), with temperatures ranging between 2-3C above pre-industrial levels.
Recent geological data suggests sea levels were episodically much higher than today – and imply a contribution of about 11-21 metres from Antarctica. This means that some portion of East Antarctica would have lost ice, in addition to Greenland and West Antarctica. The message is clear: the Antarctic Ice Sheet – Earth’s single largest source of potential sea level rise – is sensitive to temperature rise somewhere around 2C.
It is, therefore, important that the models we use to make projections of future sea level rise correctly capture the changes seen in both the Earth’s distant and recent past.
We find that our model can only replicate these geological observations only by including “dynamic” ice sheet processes based on our observations over the past few decades. These are the sudden break up of buttressing ice shelves when they become covered in meltwater; and the collapse of tall, unstable ice cliffs that emerge at the edge of the ice sheet when the ice shelves are lost.
Floating buttresses
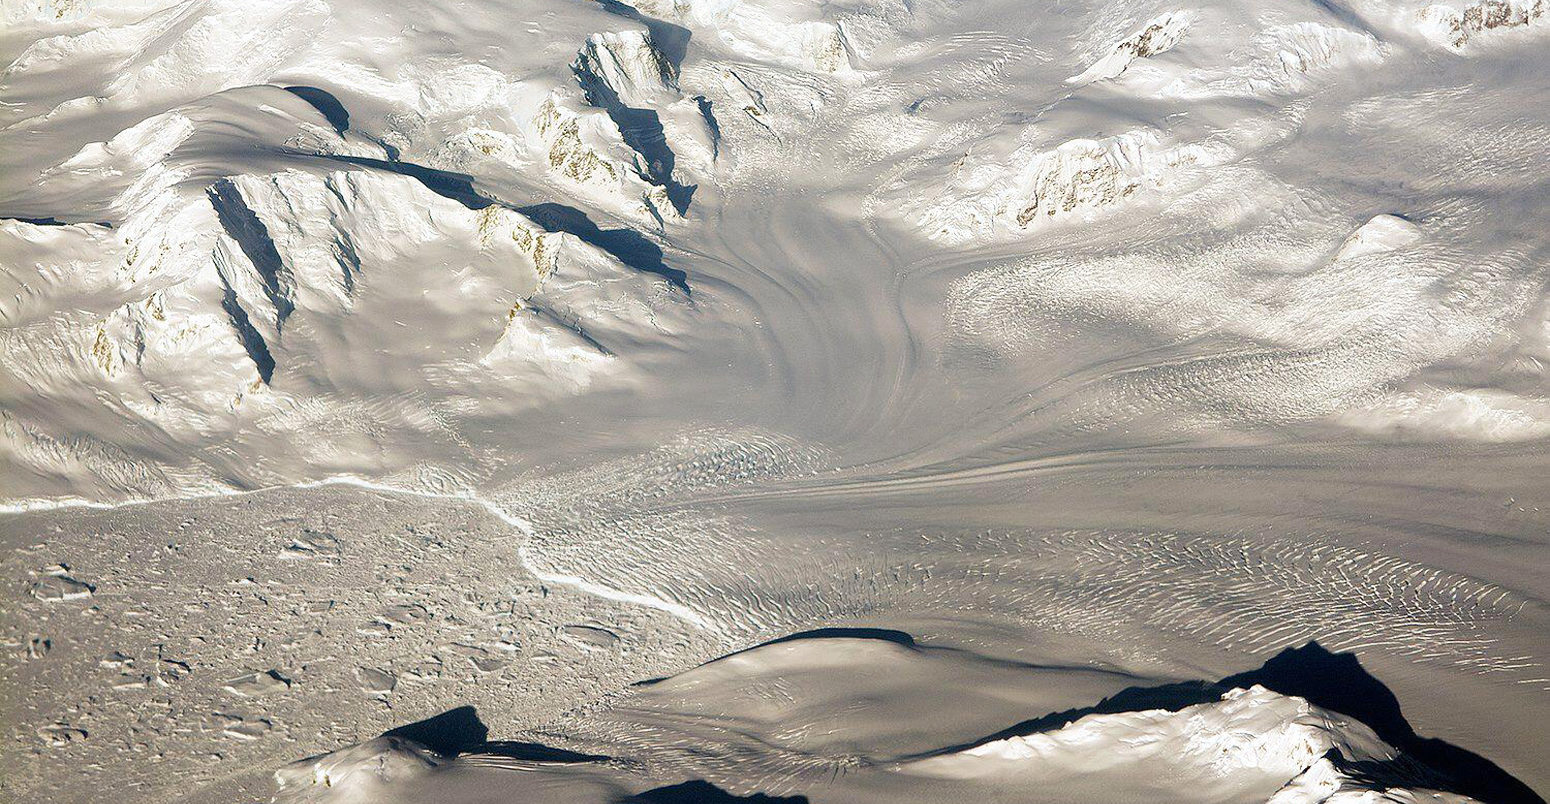
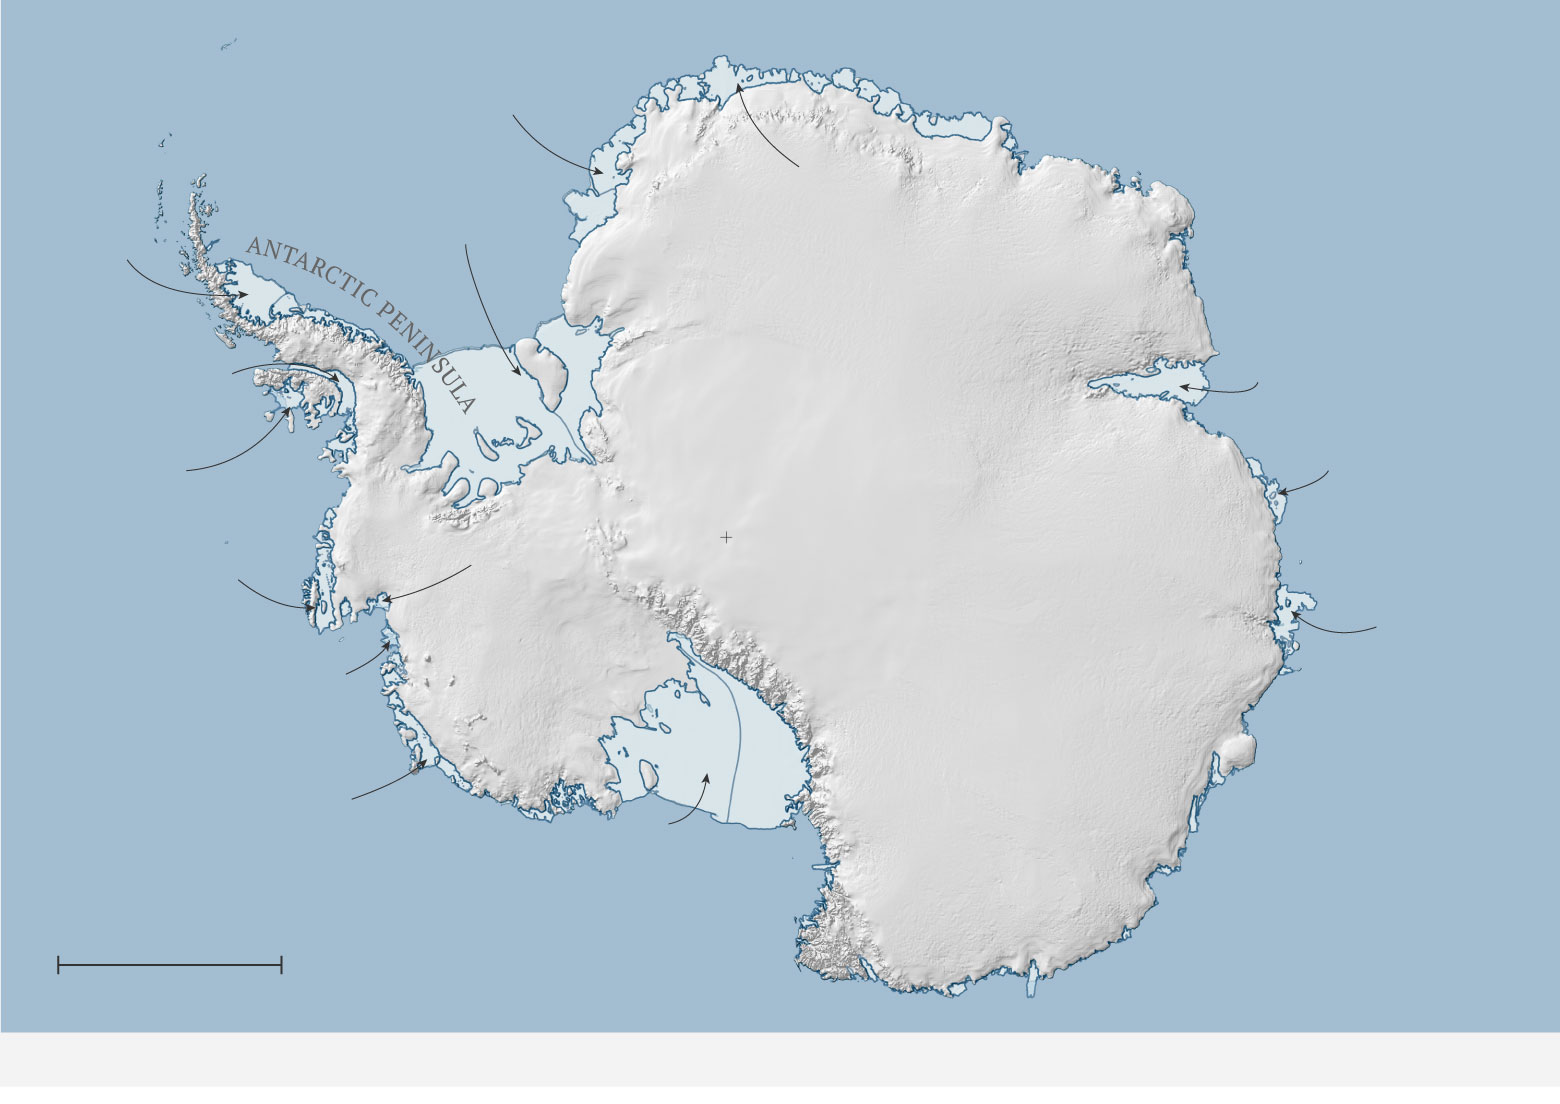
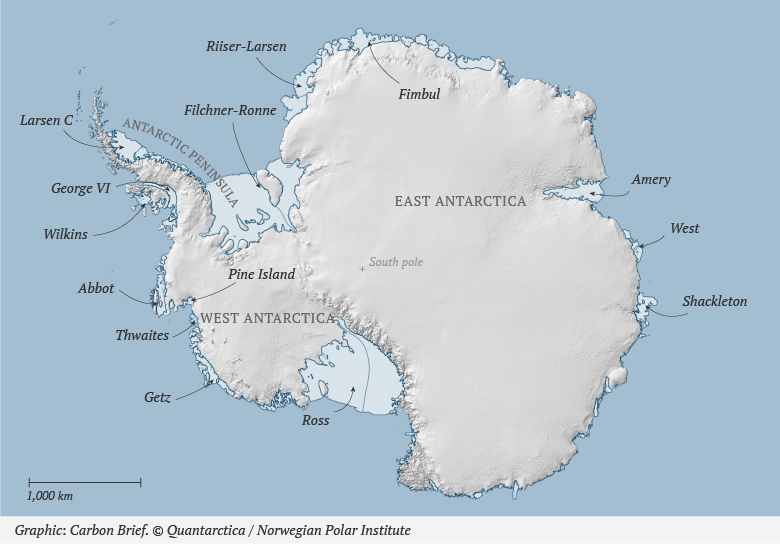
Antarctica’s ice sheet, which holds 57 meters of potential sea level rise, flows down to the surrounding Southern Ocean, with a large protective ring of ice shelves extending out over the water.
Friction between these ice shelves and their sides and local peaks in the seafloor holds back these ice shelves, which in turn “buttress” – or hold back – the ice sheet, greatly slowing its discharge to the ocean. In this manner, although the ice shelves themselves (because they float on water) do not contribute to sea level rise, they play a crucial role in slowing the loss of ice from Antarctica and the sea level rise that it would cause.
Riiser-Larsen
Fimbul
Filchner-Ronne
Larsen C
Amery
George VI
EAST ANTARCTICA
West
Wilkins
South pole
Pine Island
Abbot
Shackleton
WEST ANTARCTICA
Thwaites
Getz
Ross
1,000 km
Graphic: Carbon Brief. © Quantarctica / Norwegian Polar Institute
Ice shelves in a warming climate are vulnerable to both melt from the ocean below and surface melting from above. Increasingly, ice shelves are thinning, making them prone to sudden collapse, especially during sustained temperature spikes above freezing when melt water can accumulate on their surfaces, wedging open existing deep cracks known as “crevasses’.
Two striking instances of sudden ice shelf collapse occurred in the Arctic last summer, when Canada’s last remaining ice shelf, the Milne, collapsed in July, followed by Spalte in northeast Greenland less than a month later. Spalte formed part of the Arctic’s largest remaining ice shelf.
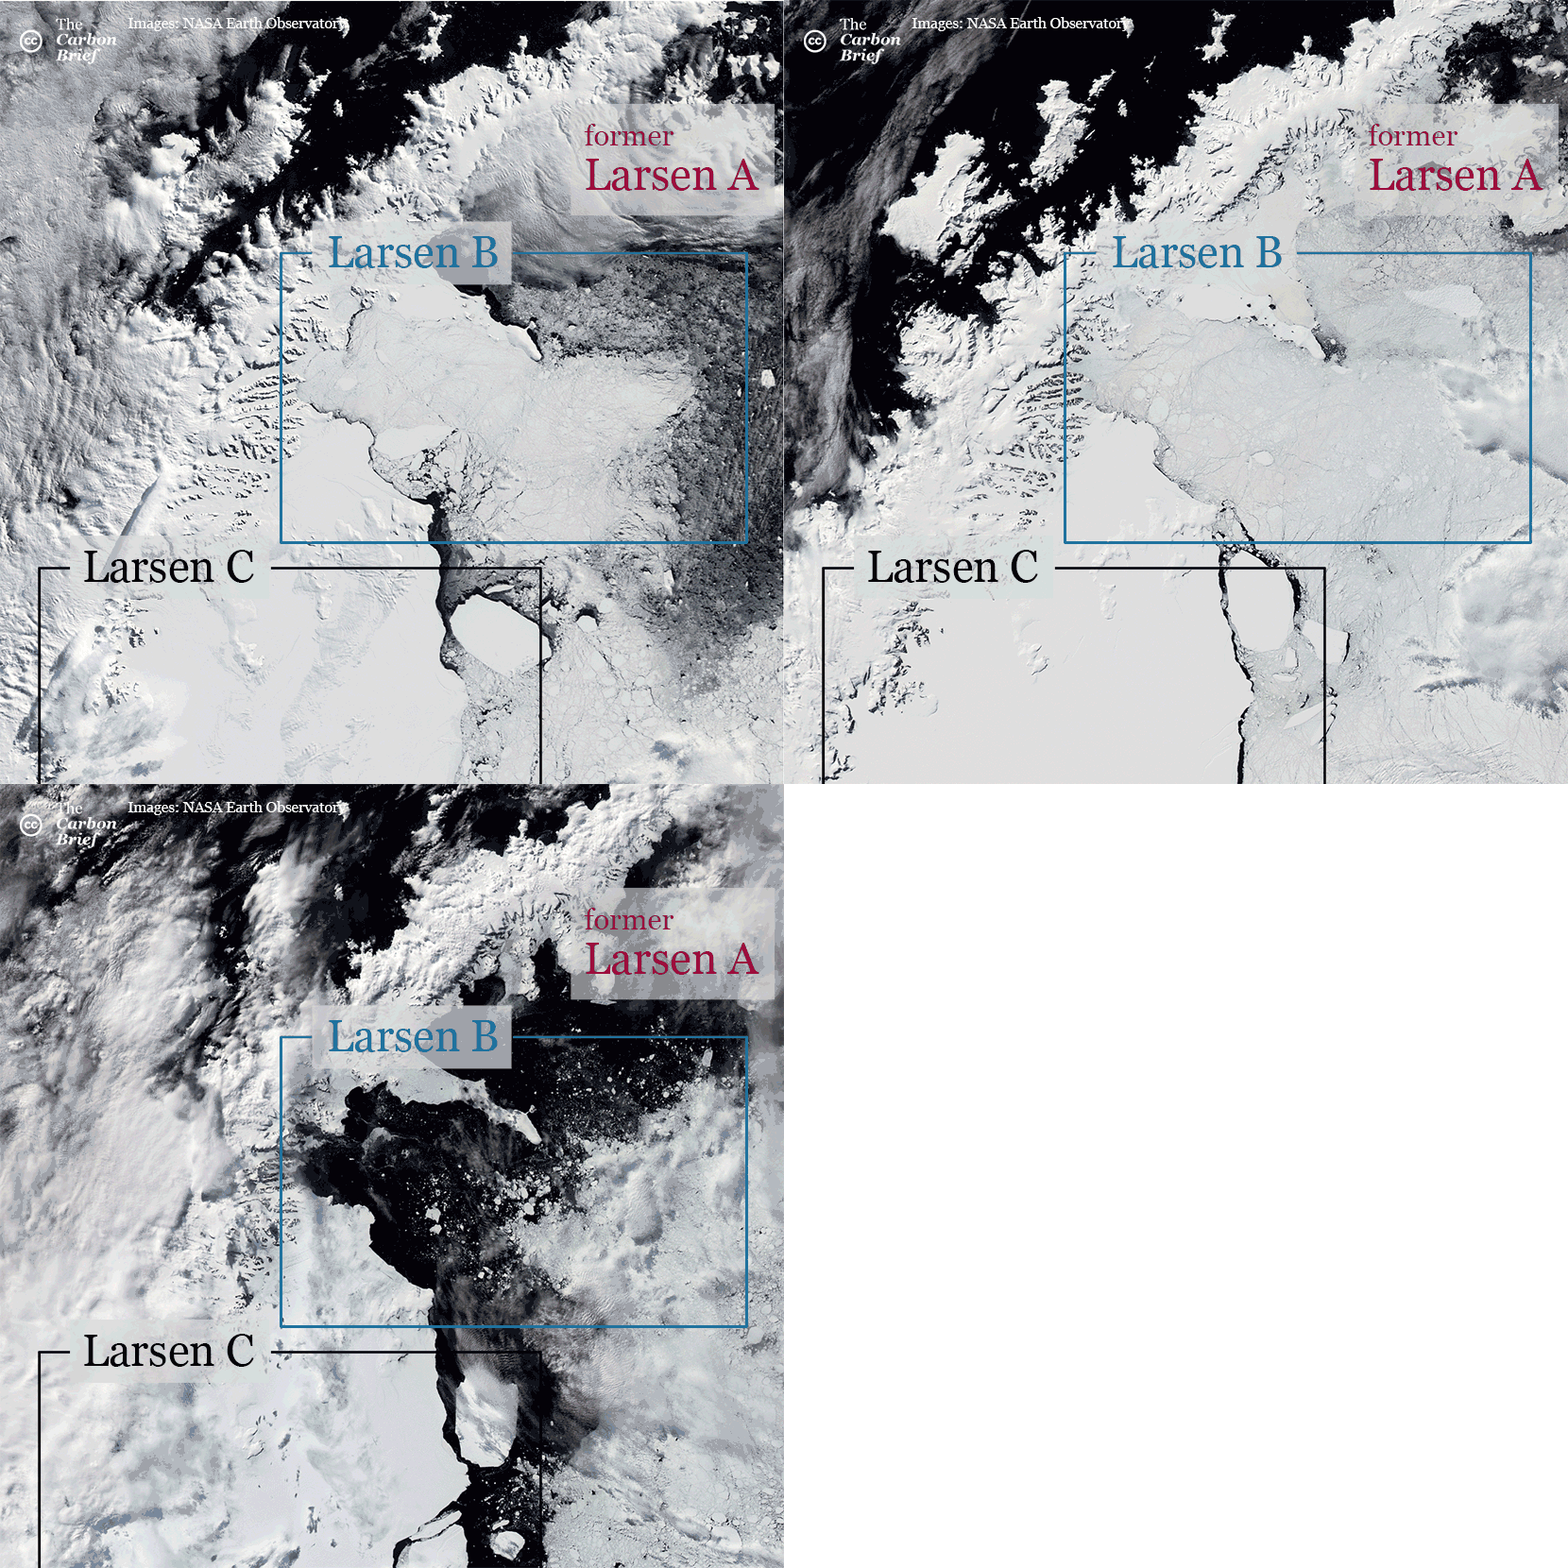
Another spectacular ice shelf collapse was seen on the Antarctic Peninsula in 2002, when Larsen B fractured after becoming covered with meltwater. The Antarctic Peninsula has warmed faster than the rest of the continent, but such collapse events may begin to occur all around Antarctica with additional warming; and our model takes that into account.
Can ice shelves re-form and, once again, hold back the ice sheet? Theoretically, yes; but in all observed collapses during the past decades on both Greenland and the Antarctic Peninsula, they have not managed to do so.
Therefore, it appears to be harder to build an ice shelf, than to break one. At least in part, this is because the ocean also is warming – it holds heat far longer than the atmosphere, preventing new ice shelves from emerging.
For the collapsed ice shelves mentioned above, none was holding back a lot of ice that would contribute to sea level rise, but that is not the case for the giant buttressing ice shelves that exist around Antarctica today. These can be thought of as relicts of the last ice age, and once they are gone, they might not reemerge for thousands of years after cool temperatures are again established.
A massive, deep bowl of ice
Much of the Antarctic “continent” actually consists of islands, similar to southeast Asia with its great archipelagos. As a result, fully a third of Antarctica’s ice sheet rests on the seabed – by as much as 2.5km below sea level in places. In other words, it is a “marine-based” ice sheet.
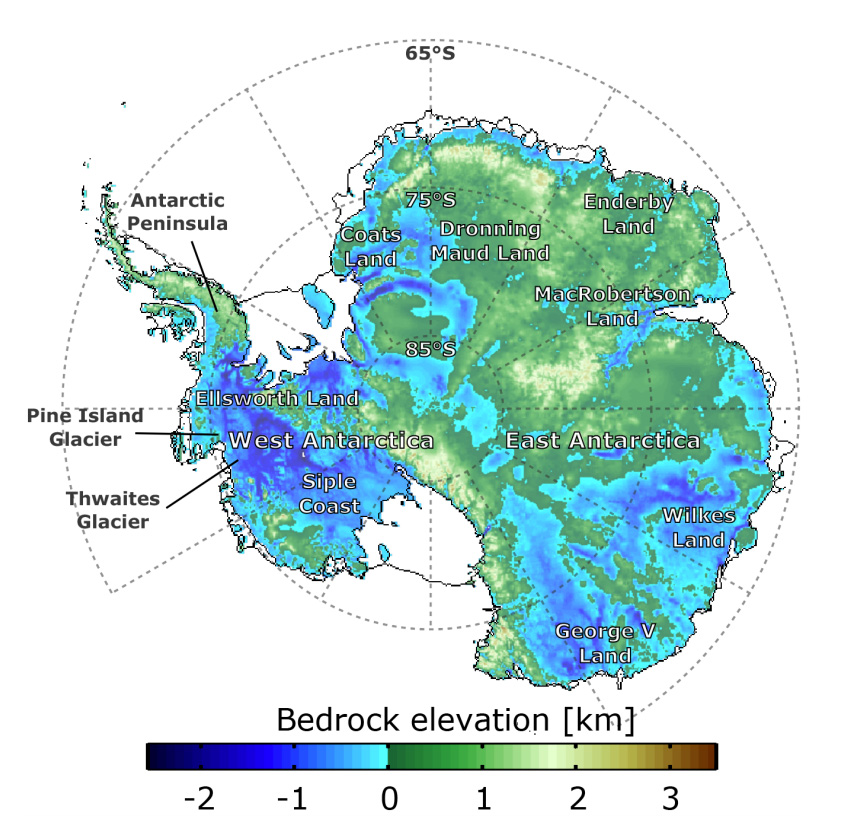
Such ice is far too thick to float and so its loss can contribute to sea level rise. But the deep bed sets the stage for the onset of instabilities in the ice sheet that can produce rapid ice loss, making it less stable.
One instability included in many models is “marine ice sheet instability” (MISI), which relates to the areas of the ice sheet resting on bedrock that has a reverse, or “retrograde”, slope – that is, the underlying bed gets deeper farther inland. Because the pace of seaward ice flow at grounding lines – the transition point between grounded and floating ice – increases as they back into thicker ice, an initial retreat on reverse-slope bedrock can trigger a self-sustaining, positive feedback loop, causing faster and faster ice loss.
Researchers in West Antarctica have already observed evidence of this phenomenon, especially at Thwaites glacier, which drains an area the size of France and connects through deep interior basins to the rest of the West Antarctic ice sheet. Increasing confidence in MISI as a viable process is largely responsible for the uptick in sea level projections in the special report on the ocean and cryosphere in a changing climate by the Intergovernmental Panel on Climate Change (IPCC) in 2019.
Collapsing cliffs
If kilometre-thick ice flowing into the ocean loses its supporting ice shelf entirely, the fraction of ice above sea level (about 10% of the total thickness) can form a massive “ice cliff” exposed above the ocean surface.
These already occur at the termini of Greenland’s largest, streaming outlet glaciers, which have lost their buttressing ice shelves in recent decades. The photo below shows an example of the Helheim glacier in southeast Greenland.
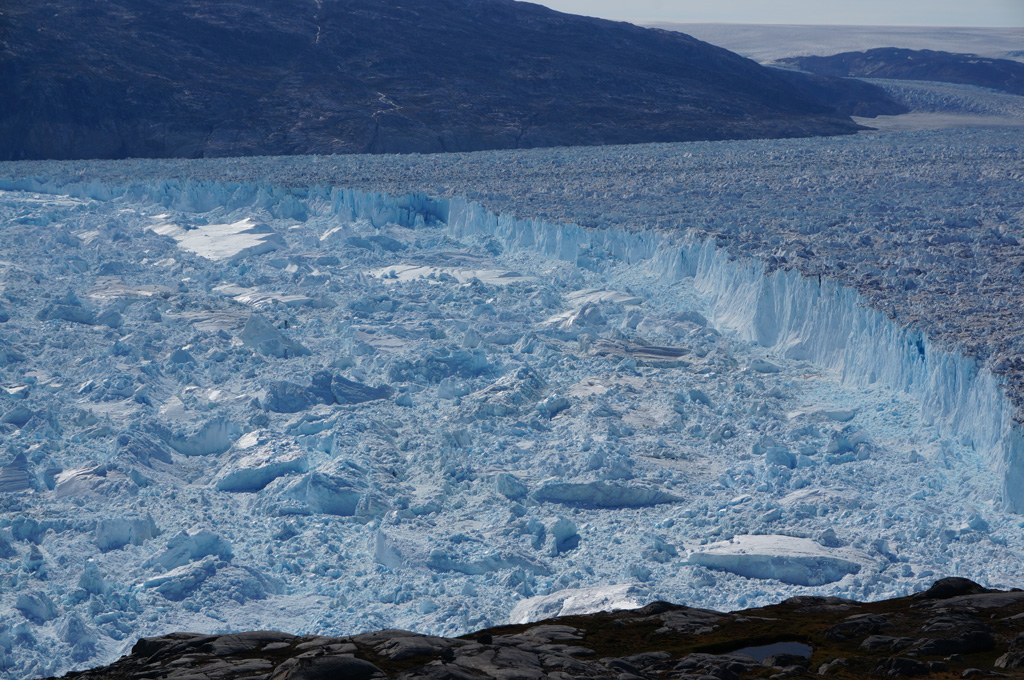
Such floating cliffs of ice can be inherently unstable. The unsupported ice above sea level produces stresses that can exceed the strength of the ice, especially where the ice is heavily damaged and crevassed. The result is slumping and “calving” – or breaking off – of the ice front into icebergs.
The calving front reaches further and further back into the ice in a process called “marine ice cliff instability” (MICI). This continues until the edge regains stability – most easily by resting on shallow bedrock again – or is buttressed by the (unlikely) regrowth of an ice shelf. After Greenland’s largest glacier, Jakobshavn, lost its protective ice shelf in the late 1990s, the glacier’s 100-metre ice cliff retreated inland more than 12 kilometres between 2002 and 2015.
On the Antarctic Peninsula, Crane Glacier suffered a similar fate with the 2002 collapse of the Larsen B ice shelf. Crane’s flow suddenly tripled in speed and it formed a persistent 100-metre ice cliff, retreating from its original 5-8km wide outlet until reaching a narrower and shallower uphill fjord (as shown in the image below).
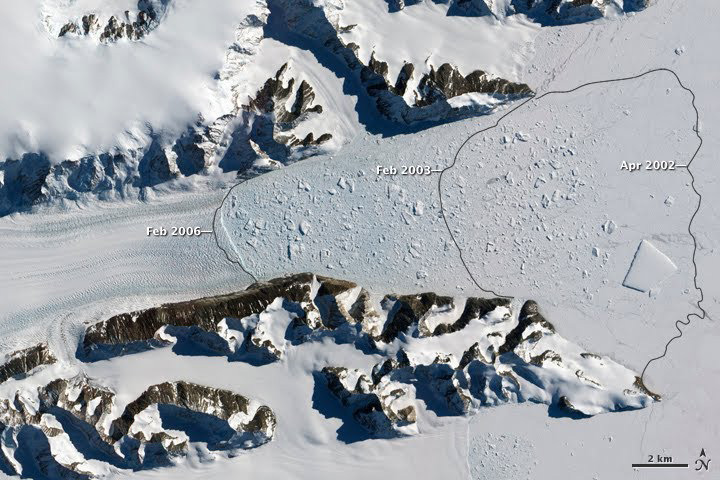
Onset of MICI and its potential impact on future sea levels was put forward in a 2016 Nature study by two of the authors on our new paper. In response, some researchers countered that these ice cliffs may not be so unstable – for example, that such emerging marine-based cliffs might be stronger than anticipated and reach 500 metres in height before failing.
However, our latest work summarises evidence showing that natural glacier ice is full of pre-existing flaws, cracks and deep crevasses and is, thus, not likely to be so strong, especially under conditions of rapid ice flow.
Uncertainties about how fast these calving dynamics can deliver ice to the ocean remain, but based on observations in Greenland, it is clear that 100-metre ice cliffs collapse repeatedly and can cause glaciers to retreat upstream despite very fast seaward ice flow.
Fortunately, such rapid calving is not widespread in Antarctica today, because most of Antarctica’s major outlet glaciers flow into supporting ice shelves. But this could change with enough future warming. Importantly, some glaciers in Antarctica, such as Thwaites glacier in West Antarctica, are vastly wider and thicker than their Greenland counterparts.
Thwaites is about 10 times the width and twice the thickness of Jakobshavn, reaching upstream into West Antarctica’s deepest bowl. Water is currently eating away at the underside of the glacier’s ice shelf, helping drive retreat of the grounded terminus at a rate of around 1km a year in some places. The retreating terminus of Thwaites currently is not thick enough to produce a crumbling ice cliff, but, if it continues to back into thicker and thicker ice, it could begin to resemble calving glaciers on Greenland, only on a grander scale.
In our study, we chose to limit calving rates to those observed on Greenland, but on Antarctica, calving might go faster than that.
In short, MICI remains a key wild card for Antarctica’s contribution to global sea level rise.
1.5-2C – the long, slow melt
We incorporated these observations of real-world glacier behaviour and ice loss, triggered when buttressing ice shelves disintegrate – with both MISI and MICI causing sudden rapid retreat – into our new modeling study of how Antarctica’s ice sheet will respond to additional warming.
We tested the model against both present-day (the past 30 years) behaviour, as well as Antarctica’s likely contribution to sea level rise 125,000 years ago (the end of the last Ice Age, at around 1C of warming) and around 3m years ago (the mid-Pliocene, at 2-3C of warming).
The model performed well in reproducing these past conditions – but only when dynamics associated with breakup of water-covered ice shelves and MICI were included.
What then does this new dynamic model tell us about Antarctica’s contribution to sea level rise in a warming future? Put simply, as temperatures rise, ice loss from Antarctica increases, occurs more rapidly and could reach irreversible conditions relatively soon. We find that the current commitments under the Paris Agreement lock in – as early as around 2070 – massive sea level rise for centuries to millennia.
The charts below show the projected contribution of Antarctica to sea level rise under scenarios consistent with 1.5C (top) and 2C (bottom) of warming out to 2100 (left) and 2300 (right). The blue shading and black lines indicate the model spread and median, respectively, for Antarctica’s total contribution to sea level rise. The red line shows the median rate of this contribution.
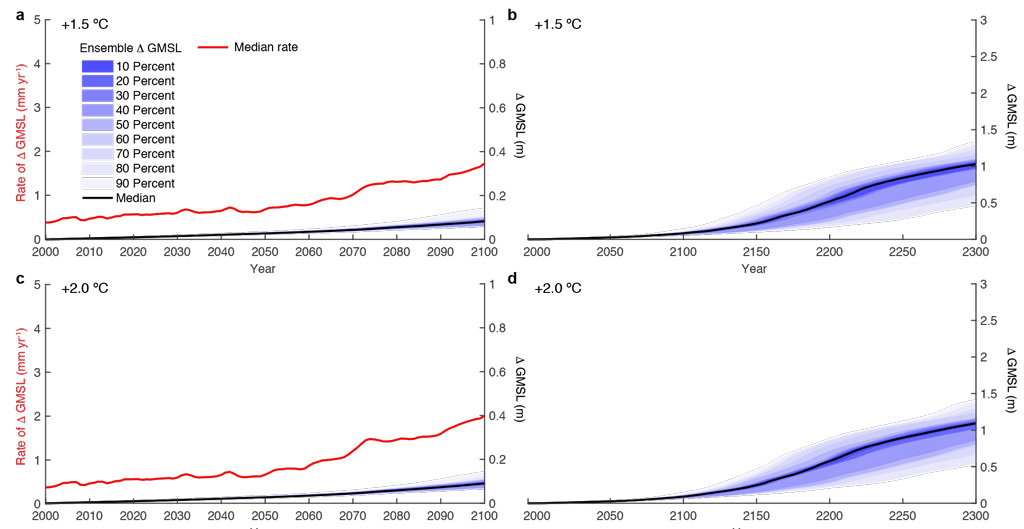
We find that, at these temperatures, Antarctic ice loss and contribution to sea level rise continues at rates seen today, reaching a “likely range” of 6-11cm by 2100. Beyond this century, the contribution continues at a similar pace, accelerating only slightly by 2300.
It is important to note that, even if global warming remained at today’s 1.1C, sea level rise from Antarctica does not cease. Instead, it continues – slowly – for centuries without stopping. That is consistent with what we know about Earth’s past. In the last interglacial, for example, when sea levels stabilised at 6-9 metres higher than today – it took several thousand years to reach those levels.
Our study also looks at whether other factors might slow Antarctica’s ice loss, including rebounding bedrock, increasing freshwater in the nearby ocean as ice sheets melt, and the surface runoff of meltwater on top of ice shelves. However, we find that these negative feedbacks either have little effect or occur too late to prevent irreversible loss and sea level rise.
3-4.5C – rapid and long-term melt
In scenarios consistent with 3C of warming, our modelling suggests that Antarctica sees a sharp jump in its rate of sea level rise, triggered by the rapid retreat of Thwaites, which destabilises much or all of the West Antarctic ice sheet.
Our model simulations suggest that this acceleration begins around 2060, reaching 5mm (0.5cm) per year by the end of this century. By comparison, today’s rate from all sources (including Greenland, land glaciers and thermal expansion) is about 3-4mm per year. Total sea level rise might then well exceed 1cm per year, posing huge challenges for adaptation efforts.
An even sharper and more catastrophic jump occurs with warming above 3C. Using the very high emissions scenario RCP8.5 – resulting in warming of around 4.5C in 2100 – we find that sea level rise from Antarctica is nearly double that of 3C scenarios, reaching 34cm by 2100. The rate of sea level rise increases greatly soon after – exceeding 6cm per year by 2150, as the West Antarctic ice sheet fully disintegrates. In this scenario, ice sheet instability is also triggered in East Antarctica; and by 2300, sea level rise from Antarctica alone reaches nearly 10 metres – 10 times the amount we would see from a 1.5C scenario.
These projections are shown in the chart below, for 3C (top) and 4.5C (bottom).
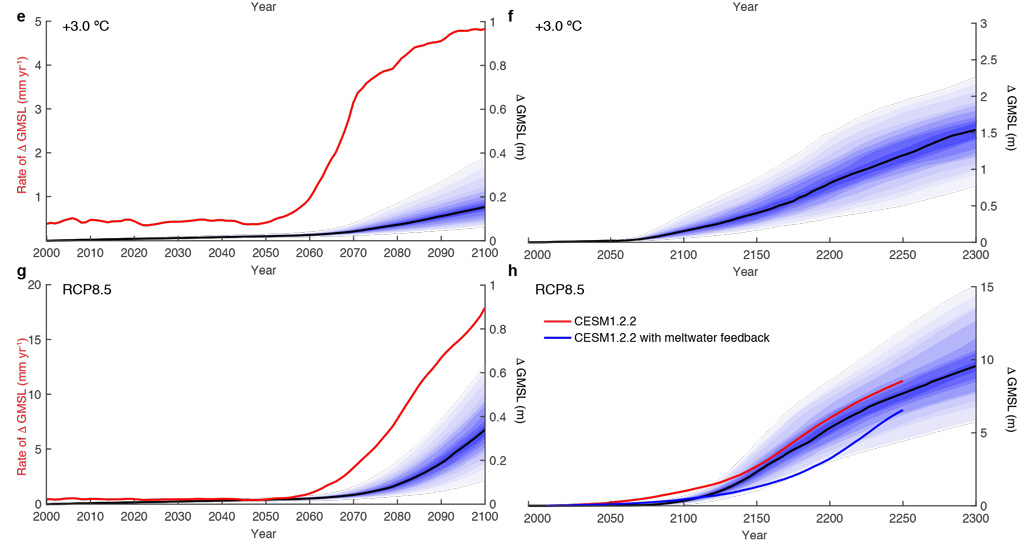
As in the 1.5C and 2C scenarios, this Antarctic ice loss and sea level rise would continue for many centuries. Again, data from the Earth’s past suggests that total sea level rise (caused by all sources) between 2C and 3C was as much as about 20 metres higher than today.
Carbon dioxide removal – too little, too late
In our study, we also consider the impact of carbon dioxide removal (CDR) on sea level rise.
CDR – also known as negative emissions – encompasses a range of measures to remove CO2 from the atmosphere and store it underground. It is often put forward as a way to offset emissions should these continue past the allowable limits for the 1.5-2C Paris goals.
Many of these techniques remain unproven, but our study optimistically assumes they could rapidly bring CO2 levels down to pre-industrial levels (about 280ppm) within a few centuries.
Using the moderate warming scenario of 3C, we assess the impact of CDR at points in time ranging from 2030 to 2200. We find that starting CDR at any point after 2060 does not appreciably slow ice sheet loss, with every decade of delay causing an additional jump in sea level rise.
Once begun in earnest – after temperatures hit 2C at mid-century – Antarctic sea level rise becomes essentially unstoppable, even with a quick return toward pre-industrial temperatures. The loss of buttressing ice shelves and a warmer ocean holding its heat for many centuries prevents refreezing of Antarctica’s ice shelves. The results show that CO2 removal can slow, but cannot halt this massive ice loss once it begins.
Current Paris commitments and overshoot
It must be remembered that this is one study, with one model. Climate research is built on developing consensus through the development and testing of many models. Therefore, once other models include more of the known physics, they may find less, or more, sea level rise.
Nevertheless, our findings indicate that overshoot of Paris Agreement goals – including those of current commitments – hold exceptional risks for long-term sea level rise from Antarctica.
These risks grow with higher and longer overshoot. In particular, assuming huge Antarctic glaciers will never lose ice any faster than their smaller Greenland counterparts is a very optimistic assumption. And then another, even more dramatic mode of calving and ice loss could emerge in thicker Antarctic ice – on a scale that we’ve never observed before.
DeConto, R. et al. (2021) The Paris Climate Agreement and future sea-level rise from Antarctica, Nature, doi:0.1038/s41586-021-03427-0
This article includes contributions from Dr Richard Alley, Evan Pugh University professor of geosciences at Pennsylvania State University and participant in multiple IPCC Assessment Reports.
-
Guest post: Overshooting 2C risks rapid and unstoppable sea level rise from Antarctica

