Guest post: A ‘Rosetta Stone’ for bringing land-mitigation pathways into line
Scientists know that the world’s land surface absorbs nearly a third of human-caused CO2 emissions each year. This carbon “sink” – mostly from forests – is a crucial buffer for the emissions that human activity churns out every year.
But working out how much of the land sink is entirely “natural” and how much is “anthropogenic” – that is, affected by humans – is much trickier.
To answer this question, different approaches have been developed for modelling groups and for the national “inventories” that countries use to estimate the greenhouse gases (GHGs) that are emitted and absorbed within their borders each year.
And these two approaches come with quite different definitions and estimates. It may sound like a small detail, but, under the Paris Agreement, it makes a difference for monitoring collective progress towards global emissions reductions.
In our new paper, published in Nature Climate Change, we present a “Rosetta Stone” adjustment for translating model-based land-use mitigation pathways to estimates that are more comparable with country-level GHG inventories.
While our approach does not change the existing global decarbonisation pathways, it does reallocate part of the model-based land sink to be consistent with GHG inventories.
This adjustment lowers the original model-based pathways, slightly anticipating the point when net-zero emissions is to be reached. As a result, the cumulative allowable global emissions until then – that is to say, the remaining GHG budget – is reduced, under the national inventory definition, by about 12-13% relative to the original model pathways for meeting the 1.5C or 2C limits.
The global remaining carbon or GHG budget in itself does not change, but its perceived size depends on which accounting system is used for emissions.
If we use the system applied by models in global decarbonisation pathways, there is no change compared to earlier estimates. But, if we use country-level GHG inventories, our adjustment ensures a like-with-like comparison with models’ pathways and can change the perception of countries regarding the level of net emissions they need to achieve.
- Why are estimates of CO2 ‘removals’ so important?
- Why do global models and countries differ in their land CO2 estimates?
- How to ensure a consistent comparison?
- Does the relocation of fluxes change our understanding of the global carbon budget?
- What are the implications of this adjustment?
Why are estimates of CO2 ‘removals’ so important?
The Paris Agreement sets out that meeting its goal of holding global warming to “well below 2C” while aiming for 1.5C requires achieving “a balance between anthropogenic emissions by sources and removals by sinks of greenhouse gases (GHG) in the second half of this century”.
As a result, countries are now announcing a flurry of net-zero targets. Achieving these goals will require a combination of reducing emissions and boosting CO2 “removals” – processes that take CO2 out of the atmosphere, which currently rely entirely on the land sector.
[contentbox id=”21551″]
Progress towards the Paris Agreement goals is checked periodically by a five-yearly “global stocktake”. The first iteration of this process, which relies explicitly on the best available science, will start in 2022-23. It involves countries’ historical and planned mitigation efforts being compared with what science indicates is necessary to reach the agreed goals. Any gap that is identified is expected to be acknowledged and should hopefully motivate stronger climate action.
Historical progress is monitored through country GHG reporting under the Paris Agreement, hereafter collectively called “national GHG inventories” (NGHGIs). Assessments of planned future effort uses countries’ pledged climate targets, which include “National Determined Contributions” (NDCs) in 2025 or 2030 and long-term strategies for mid-century or thereafter. Scientific estimates of emission pathways consistent with limiting warming to 1.5C and well-below 2C are provided by integrated assessment models (IAMs).
While this plan looks sound, there is a tricky detail in the concept of “anthropogenic removals” in the land sector in IAMs and NGHGIs. That is, how to allocate the CO2 uptake from lands influenced by human activity.
And the amount of CO2 involved is significant. For example, the differences between model and country-level estimates of land CO2 net flux – where “flux” is the exchange of CO2 between the land and atmosphere – is currently equivalent to more than 10% of global anthropogenic CO2 emissions.
Why do global models and countries differ in their land CO2 estimates?
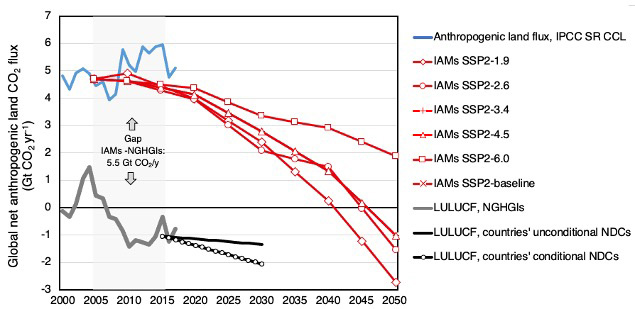
The figure below highlights the gap between estimates of global anthropogenic land CO2 “net flux” – a positive flux indicates that more CO2 is being emitted to the atmosphere than removed, while the opposite applies for a negative flux.
The blue line represents estimates of historical net flux from models used in the special report on climate change and land by the Intergovernmental Panel on Climate Change (IPCC), while the red lines show projections from IAMs under different scenarios. The grey line shows flux estimates from NGHGIs and the black lines show projections under the NDCs.
The gap between the red and blue lines and the grey and black ones stands at around 5.5bn tonnes of CO2 per year (GtCO2/yr). This mismatch hampers an accurate assessment of progress under the Paris Agreement.
Our study identifies a major and resolvable reason for this gap, linked to the conceptual inconsistencies between IAMs and NGHGIs in estimating the anthropogenic CO2 sink.
Emissions from fossil fuels and industry are unmistakably caused by humans and, thus, are classed as “anthropogenic”. However, for land CO2 fluxes, things are far more complicated – they involve both human-caused and natural processes that can be difficult to disentangle.
These processes include direct human-induced effects – such as deforestation, forest harvest and regrowth – but also the indirect effects. These include CO2 fertilisation and warming-induced changes to temperatures and rainfall patterns, which tend to stimulate plant growth.
Two largely independent scientific communities have developed different approaches to estimate the anthropogenic CO2 flux from land – with different purposes and scope – which are valid in their own specific context.
The first community concerns scientific modelling on global carbon-cycle and integrated assessment, including IAMs. Through complex models, they developed methods to approximately separate anthropogenic fluxes (direct human-induced effects only) from natural fluxes (including indirect human-induced effects), with the aim to provide globally consistent estimates that are included in IPCC assessment reports.
The other community is linked to the development of IPCC methodological guidelines for NGHGIs – with the aim to provide pragmatic and consistent methodologies that are applicable by all countries for reporting their GHG emissions.
In this practical, real-world context, where this second community operates, the separation of direct and indirect anthropogenic effects on CO2 net fluxes is impossible in managed forests that remain largely unchanged – that is, those that are not subject to deforestation or afforestation. This is because, when measuring the changes of forest biomass over time through direct observations – such as national forest inventories upon which NGHGIs are typically based – one cannot say how much of the biomass change is due to better management and how much is due to environmental factors.
Therefore, IPCC guidelines for NGHGIs adopted a compromise, where all GHG fluxes in lands that are defined as “managed” by humans are considered anthropogenic. GHG fluxes from “unmanaged” land are then not considered anthropogenic and, thus, are not reported in NGHGIs. While this proxy is clearly imperfect, several IPCC expert groups have concluded that, currently, there is no better and widely applicable alternative for NGHGIs.
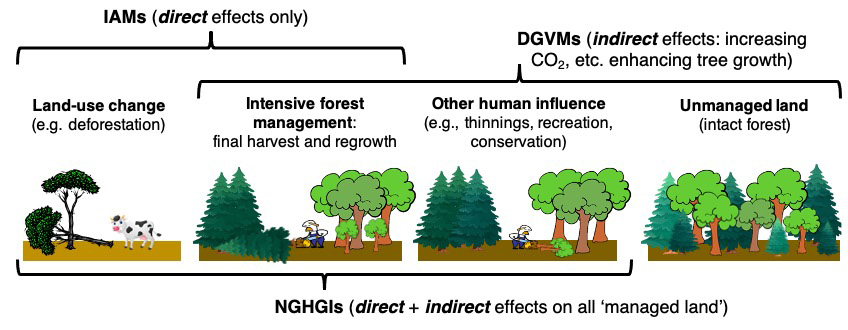
In practice, in a forest that remains unchanged in area, IAMs only consider the CO2 fluxes associated with intensive harvesting activities and the subsequent regrowth (direct effects) to be anthropogenic. This is a relatively limited area globally. NGHGIs, on the other hand, include all CO2 fluxes on a broader managed area – including, for example, less intensively managed forest – such as areas subject to thinning and selecting logging – or protected areas. And, importantly, the NGHGIs consider both the direct and the indirect human-induced effects on this larger area, in line with the IPCC “managed land” compromise.
There is a considerable difference between the managed forest areas considered by the IAMs – around 0.5bn hectares – and the NGHGIs – around 3bn hectares. These differences are summarised in the figure below, which also include intact forests, which we use as a proxy for countries’ unmanaged forests.
This mismatch in anthropogenic land CO2 fluxes represents a key barrier to the use of IAMs in assessing progress and the need for greater ambition in targets under the Paris Agreement.
This issue has been acknowledged at the highest levels, such as in the recent IPCC special reports (on global warming of 1.5C and on climate change and land) and during a 2019 plenary session of the UN Framework Convention on Climate Change (UNFCCC).
A viable solution is needed by both the IPCC and policymakers. Yet, the issue is not to decide which approach is better, nor to force one community or the other to use a specific approach, but being able to translate their estimates so that they can be compared.
How to ensure a consistent comparison?
While changing the approach of countries in a way to split direct and indirect effects would be desirable, it is impractical in the short term. Therefore, we explore how the output of global models could be used to facilitate a like-with-like comparison.
In essence, the problem is that countries call “anthropogenic” the part of the land CO2 sink that IAMs call “non-anthropogenic”. Luckily, these emissions are not “lost” in the overall calculations by IAMs, but are captured by other kinds of models, such as dynamic global vegetation models (DGVMs) and Earth system models (ESMs).
These models specifically estimate the natural response of land to human-induced environmental change (indirect effects) – that is, those CO2 fluxes that most countries typically class as “anthropogenic”. While most IAMs do not explicitly model these fluxes, they are taken account of – using information from ESMs and DGVMs – in developing their emission pathways consistent with specific temperature limits.
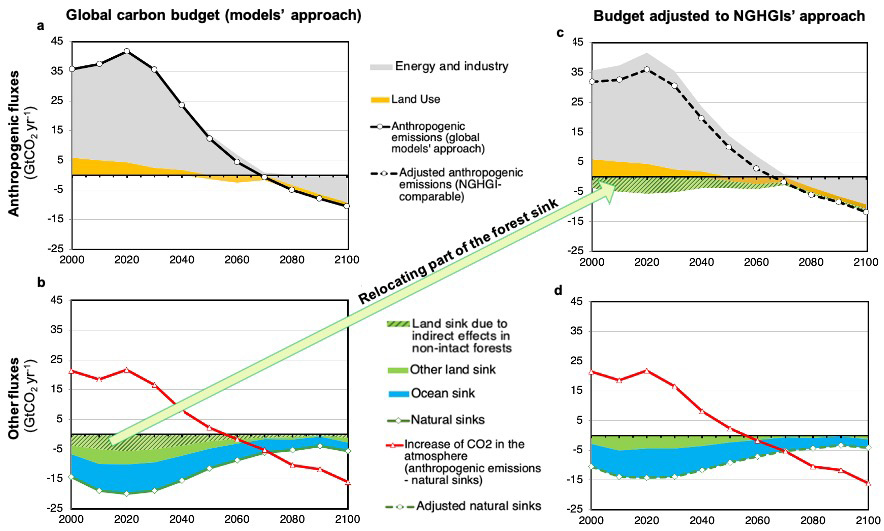
Since it is largely an issue of how fluxes are labelled, a more consistent comparison can be achieved simply by reallocating part of the land sink. This is illustrated in the charts below.
The left-hand charts (a and b) show the modelling approach for anthropogenic (top) and natural fluxes (bottom), while the right-hand charts (c and d) show the models’ results adjusted to the NGHGIs approach. To make the modelling of anthropogenic fluxes conceptually more comparable with NGHGIs, we relocate part of the global models’ natural sinks – due to indirect human-induced effects on non-intact forests (the dashed green area in chart b) – to the anthropogenic component (chart c).
It is important to note that our approach relocates part of the forest sink by global models (from the non-anthropogenic to the anthropogenic component), but does not change the emission pathways for energy and industry, nor the land-use emissions due to direct effects (grey and yellow areas in the figure below, respectively). In addition, because the changes in natural and anthropogenic fluxes fully compensate, the CO2 remaining in the atmosphere (red lines in b and d) also remains unchanged.
Does the relocation of fluxes change our understanding of the global carbon budget?
Our proposed adjustment ensures an appropriate like-with-like comparison between IAMs and NGHGIs, but does not change the scientific understanding of the current and future remaining global carbon or cumulative GHG emissions (that is, the emissions until net-zero carbon or GHG emissions consistent with a certain climate target). However, it does have implications for understanding the required mitigation effort by countries.
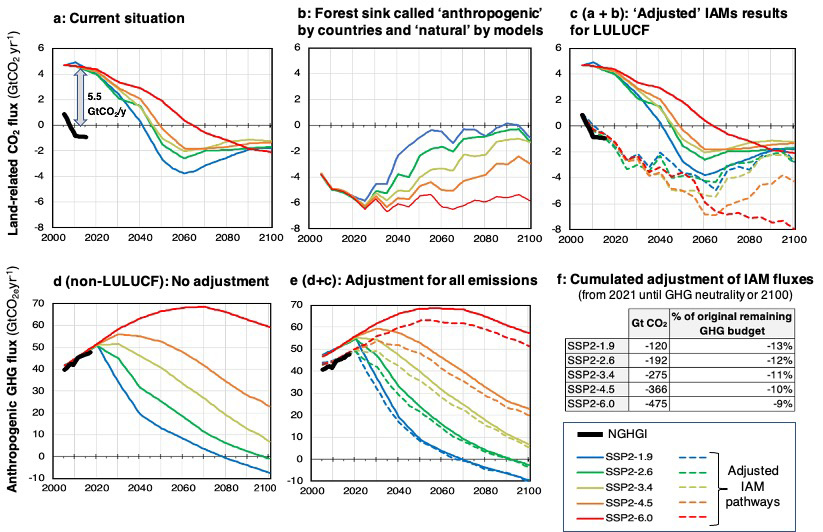
The figure below summarises all the steps outlined above. Starting from a large gap in anthropogenic land CO2 fluxes (chart a) between NGHGIs (black line) and IAMs (coloured lines, representing different emissions pathways), our approach adds the fluxes from indirect effects estimated by DGVMs on non-intact forests (chart b) to the original IAMs’ results (chart c). The resulting “adjusted” IAMs estimates (dotted lines in chart c) are then conceptually and quantitatively more comparable with NGHGIs (black line in chart c).
These changes do not affect non-LULUCF (land use, land-use change and forestry) emissions (chart d). However, the sum of LULUCF and non-LULUCF emissions (that is, “economy-wide” emissions) does change, and the NGHGI-comparable mitigation pathways for economy-wide emissions (dotted lines in chart e) are lower than the original ones (solid lines). The same reasoning applies to cumulative GHG emissions.
For example, for the scenarios SSP2-1.9 and SSP2-2.6 – which represent pathways keeping warming to about 1.5C and 2C, respectively – cumulative GHG emissions until net-zero expressed in an NGHGI-comparable way are 120-192 GtCO2 lower compared to how they are described by IAMs (chart f). This means that, although our solution does not change the original decarbonisation pathways, it reduces the total anthropogenic emissions and the amount of allowable economy-wide cumulative net emissions for a given warming limit when considered through the lens of NGHGIs, relative to the original IAM pathways.
What are the implications of this adjustment?
Our proposed adjustment does not suggest that indirect effects should or should not be included in climate targets, but simply facilitates a like-with-like – and, thus, scientifically more accurate – comparison of different country climate targets against IAM pathways.
In the absence of these adjustments, comparing IAM-based pathways to current emissions based on NGHGIs would give the impression that collective progress is more on-track than it actually is.
However, the adjusted IAM pathways become harder to interpret, because the CO2 sink due to indirect effects depends on the level of climate change. For example, under more ambitious pathways, the CO2 fertilisation effect decreases and therewith also the CO2 sink (see the blue and green lines in chart b above). As a consequence, the adjusted LULUCF pathways do not include this clear dependency on the level of climate action and, thus, the effort required is less visible compared to the original LULUCF pathways (chart c).
IAMs mitigation pathways have enormous importance for climate policy, as benchmarks and points of comparison for assessing collective progress under the Paris Agreement. However, to serve this role, they should be conceptually comparable with NGHGIs and climate targets.
Overall, two messages can be taken from our study. First, that reconciliation of anthropogenic land CO2 fluxes between global models and country-level GHG inventories is possible: when a like-with-like comparison is made, the original large gap disappears.
Second, since most countries consider emissions and climate targets through the lens of their NGHGI accounting system, these need to be compared to the adjusted, NGHGI-compatible pathways and remaining cumulative GHG emissions. This adjustment enables a more accurate assessment of the collective climate progress under the Paris Agreement’s global stocktake, thus improving countries’ understanding of the global level of emission they can still emit for specific temperature goals.
Article information
Grassi, G. et al. (2021) Critical adjustment of land mitigation pathways for assessing countries’ climate progress, Nature Climate Change, doi:10.1038/s41558-021-01033-6