
Q&A: How ‘integrated assessment models’ are used to study climate change
Multiple Authors
10.02.18Multiple Authors
02.10.2018 | 4:31pmWorking out the best ways to tackle climate change is one of the key challenges facing policymakers both today and in the decades ahead.
To inform these decisions, scientists and economists have developed a suite of tools known as “integrated assessment models” (IAMs). These models are used to answer central questions about climate change, from how the world could avoid 1.5C of global warming at the lowest cost, through to the implications of countries’ current pledges to cut emissions.
They combine different strands of knowledge to explore how human development and societal choices interact with and affect the natural world. This includes the physical laws driving natural systems, as well as the changing habits and preferences that drive human society.
This complex task introduces many uncertainties and limitations. Yet IAMs still offer valuable insights how the world’s energy and land-use systems would need to change to respond to the climate challenge.
In this detailed Q&A, Carbon Brief has spoken to a range of scientists and researchers to find out how IAMs work, why we use them and what they can tell us about climate change.
What is an IAM?
Integrated assessment models (IAMs) are designed to help us understand how human development and societal choices affect each other and the natural world, including climate change. They are “integrated” because they combine different strands of knowledge to model human society alongside parts of the Earth system.
(The term “IAM” is broad and different types are also used in other fields, unrelated to climate.)
Confusingly, “IAM” is used to describe a wide range of models, which vary enormously in the way that they work and the questions they can answer. Broadly, however, there are two main types – simple and complex IAMs.
First, there is a group of “simple” IAMs that can compare the costs and benefits of avoiding different levels of warming. Typically, these are run in a spreadsheet using highly simplified equations. They do not model the detailed processes and relationships of the economy, energy and Earth systems.
These simple IAMs – such as “DICE”, “FUND” and “PAGE” – are often used to calculate the “social cost of carbon”, a measure of the quantifiable costs and benefits of emitting one additional tonne of CO2 in monetary terms. See Carbon Brief’s explainer on the social cost of carbon for more.
Second, there is a group of more complex IAMs, which are the focus of this article. These look at the energy technologies, energy use choices, land-use changes and societal trends that cause – or prevent – greenhouse gas emissions. They do this using linked “modules” representing the global economy, as well as its energy, land and climate systems (see below for more details).

Yangshuo, Guangxi, China. Vladimir Grigorev / Alamy Stock Photo.
The need to represent human systems, as well as natural ones, means that IAMs are very different beasts compared to climate models. When modelling the climate system, scientists can draw on unchanging physical principles and laws to model, say, the convection of heat through the atmosphere, or the way it absorbs solar radiation. The same cannot be said for the buying and selling of different fuels, or the relationships between income, diets and transport use.
Instead, researchers rely on economic theories and evidence from historical data as they work to develop equations able to capture energy demand and socioeconomic behaviour.
“The most appropriate representations of human preferences are changing and contested,” notes a 2017 paper evaluating IAMs. It adds that modelling results might even influence decision makers so that assumptions become self-fulfilling, or self-defeating: “Decision makers may even respond reflexively to modelling analysis, changing the relationships enshrined within the models.”
This “uncertainty” about how to model socioeconomic behaviour means it is impossible to define the “right” approach to use in an IAM. Moreover, it is all but certain that human relationships, social norms, habits and preferences will change, meaning the “right” approach for 2018 might misrepresent the future. This and other limitations of IAMs are discussed later in the article.
Another implication of this diversity is that complex IAMs defy simple explanation. This means general descriptions of the workings of IAMs and the ways that they can be used – including those in this article – are likely to be contradicted by exceptions.
These complex IAMs are used to answer a series of “what if?” questions, Dr Joeri Rogelj tells Carbon Brief. Rogelj is an energy researcher at the International Institute for Applied Systems Analysis (IIASA), a lecturer in climate change at Imperial College London’s Grantham Institute and a coordinating lead author on the upcoming Intergovernmental Panel on Climate Change (IPCC) special report on 1.5C.
These questions can be general. For example, what if the world takes no action to limit climate change? Or how can the world meet the 1.5 or 2C targets?
The questions asked of IAMs can also be very specific. What if countries impose a universal price of $100 per tonne of CO2 emissions by 2020? What if certain technologies, such as nuclear or carbon capture and storage (CCS), are not available?
There are some example results from different types of IAM experiment in the following sections.
In the video, below, Rogelj explains a central feature of complex IAMs. This is the ability to trace the feedbacks and tradeoffs between choices about the economy, energy system and environment.
The linkages built into complex IAMs means they can explore cascading effects, co-benefits and unintended consequences, tracing how choices in one area affect the rest of the modelled world.
This ability to explore feedbacks and tradeoffs depends on the design of individual IAMs, with some able to study certain interactions in more detail and others not at all.
One crucial feedback is currently missing from almost all complex IAM research, however. They generally do not measure economic damages and reduced growth due to climate change, such as flood losses or adaptation costs due to rising sea levels.
Adding these climate feedbacks to the complex IAMs is “one of the big frontiers” for the modelling community, says Dr Céline Guivarch, senior researcher on the impacts and mitigation of climate change at CIRED in Paris. “A big part of the picture is not being captured,” she says.
Another core issue for IAMs is their basis in economic theory, which assumes markets and society are rational and make decisions using perfect information. Most model scenarios also start from the assumption that the economy is “optimised”, meaning there is no unemployment or wasted investment. This means policy interventions almost inevitably reduce economic activity and are seen as a cost.
In its most recent assessment report, the IPCC’s Working Group III (WG3) describes IAMs as follows, noting their assumptions and key limitations:
“Integrated models are simplified, stylised numerical approaches to represent enormously complex physical and social systems…Important input assumptions include population growth, baseline economic growth, resources, technological change, and the mitigation policy environment. [However, they] do not structurally represent many social and political forces that can influence the way the world evolves…
“The models use economics as the basis for decision making. This may be implemented in a variety of ways, but it fundamentally implies that the models tend toward the goal of minimising aggregate economic costs of achieving mitigation outcomes…[The models also] typically assume fully functioning markets and competitive market behaviour.”
(Section 6.2 of this IPCC chapter is worth reading in full, for a comprehensive overview of IAMs.)
The types of questions that can be asked – and answered – using IAMs are explored in more detail in the following sections. As noted by the IPCC, it is worth repeating that IAM results come with significant caveats relating to the way the models are designed and the things they leave out.
How do IAMs work?
IAMs draw on scientists’ best understanding of the workings of the global economy, along with the world’s energy, land use, agricultural and climate systems. In general, these sectors are modelled using separate “modules” that are linked in some way.
IAMs have been built by many research groups around the world. Each model takes a different approach and often, its structure is a reflection of its evolution.
Some IAMs started life as economic models, for example, meaning this module is the largest and most detailed part of the overall package. It might look at trade in a range of goods across multiple sectors of the economy – the cement industry, for example – and between many world regions.
Other IAMs developed from energy models, matching supply and demand for energy based on detailed representations of different fuels and technologies. Yet others were designed from the start to address environmental problems, modelling the Earth’s land system down to grid scale.
In addition to these historical factors, time and computing power are limited. This means each part of an IAM tends to be simplified compared to a dedicated sector-specific economic model, say, or a state-of-the-art Earth system climate model. This sacrifice means IAMs can join the modules together to explore how they interact, while still running in a reasonable amount of time.
Some parts of an IAM are – like climate models – based on physical laws. Many others are based on economic theory or attempts to reproduce (“simulate”) historical data for a particular socioeconomic relationship. As noted above, there may be many different ways to do this.
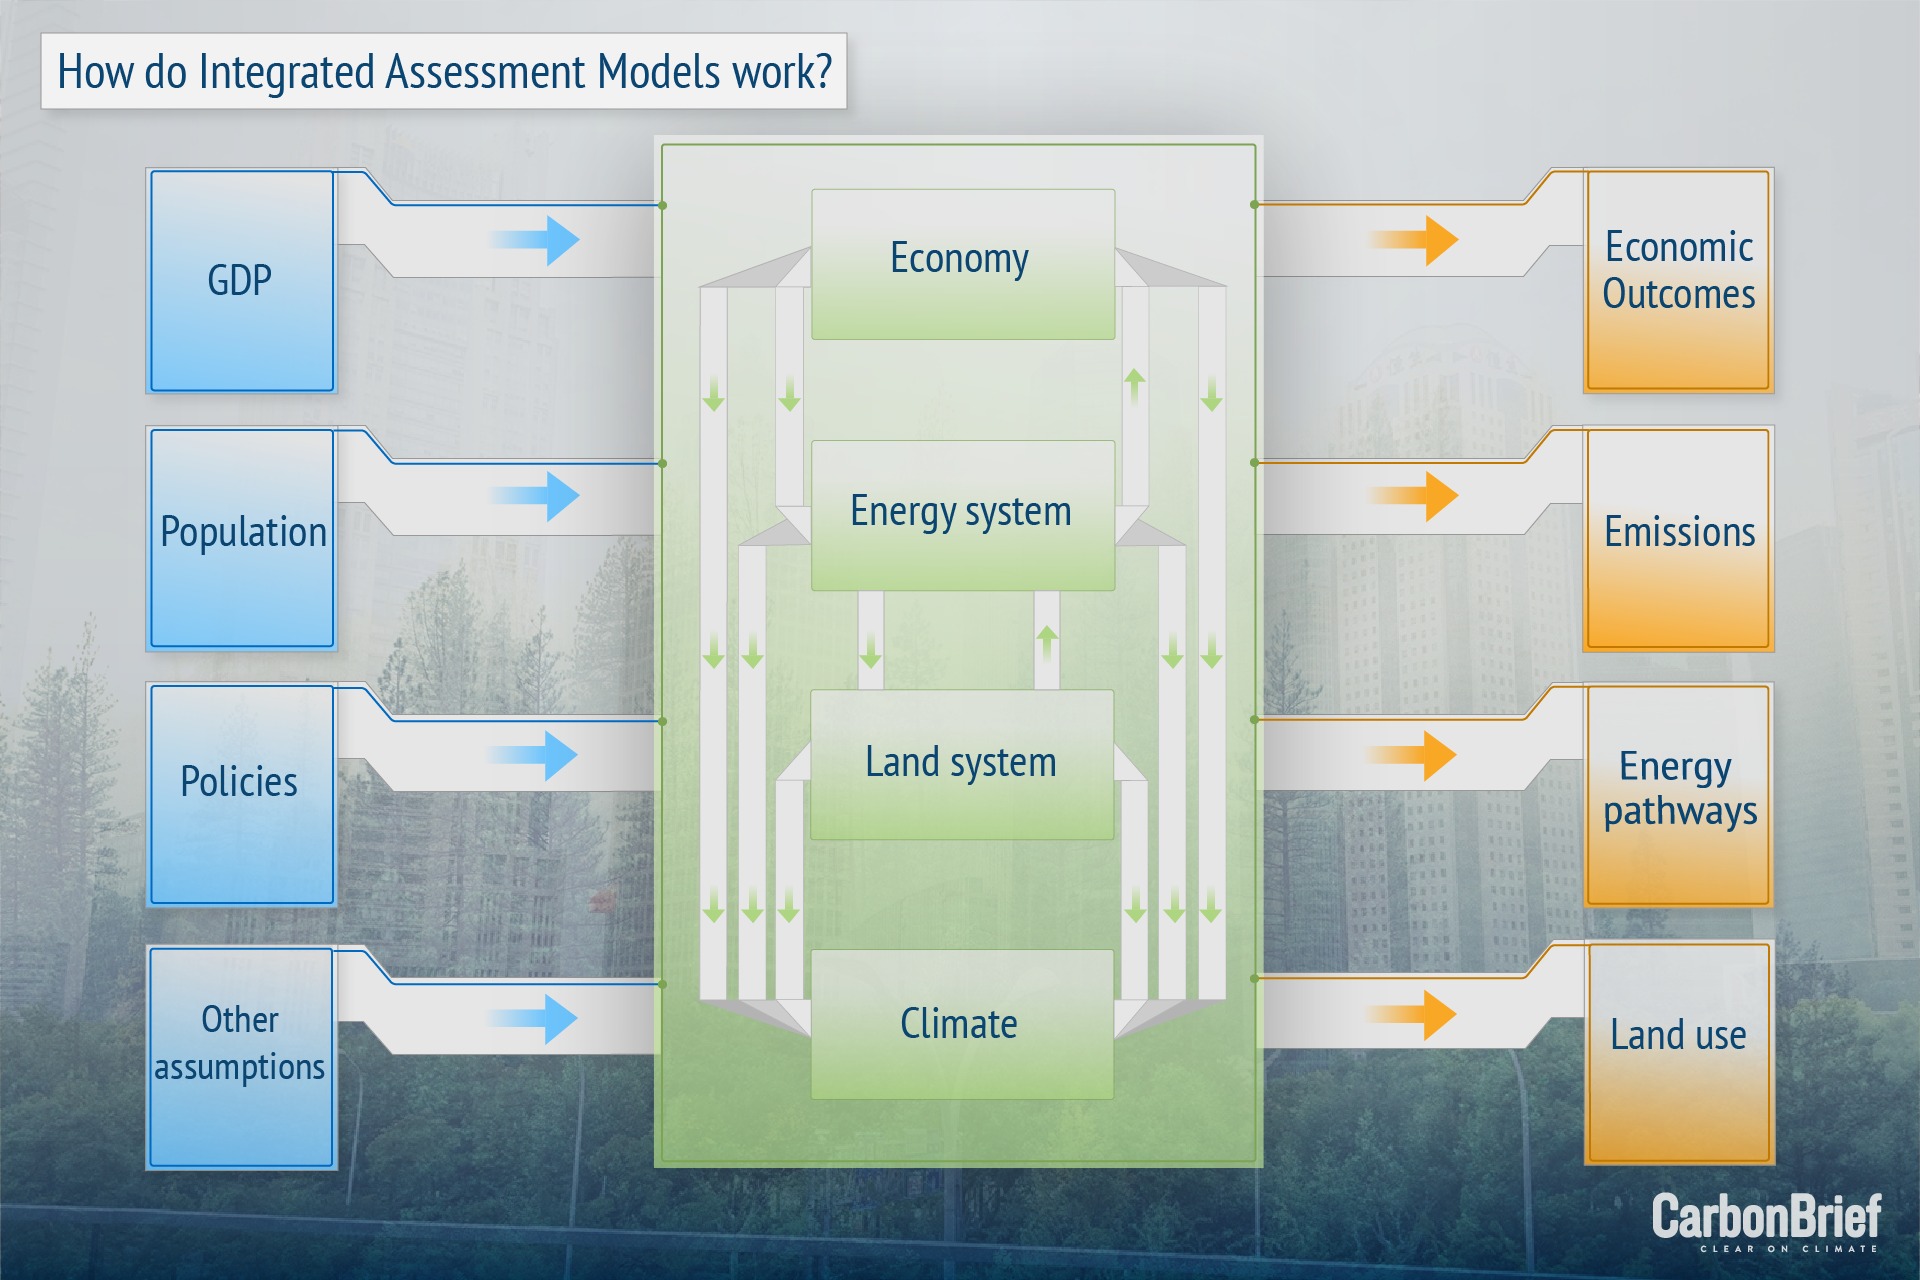
The basic structure of an IAM is shown in the graphic, below.
Reading from left to right, the process starts with model inputs – essentially a long list of assumptions about how the world works and how populations and societies will change.
In the centre is the model itself, typically including separate modules that represent the economy, energy system, land use and agriculture, and the climate. On the right are outputs from the model, including economic outcomes, land-use changes, greenhouse gas emissions and pathways of energy use and future human development.
Each of the model’s parts is more or less separate, with the different modules either “hard-linked” via their computer code, or “soft-linked” using data files to exchange information. This means results from one module can be passed back to others, depending on the model structure.
For example, rising energy demand in the economy module might cause fuel prices to rise in the energy system module. This might be fed back into the economy and, in turn, depress demand. Similarly, a rise in food demand might increase the need for land in the agriculture module, leading to deforestation, rising prices and increased greenhouse gas emissions.
The links and feedbacks inside IAMs mean they can be used to study such cascading consequences – including potentially unexpected side-effects – to pick up trade-offs and co-benefits that might otherwise be missed.
Researchers can explore wider questions with additional modules, which use output data from the core IAM. These might model air pollution, health, flood risk or biodiversity loss, for example.
Depending on the IAM, researchers must answer myriad questions before they can start their work. The answers to these questions are the assumptions that regulate how the model behaves.
For example, what is the relationship between income and energy use? How does demand for private transport change over time, as incomes increase and as populations move away from rural areas towards urban centres? What can we say about average diets in relation to wealth?
Modellers use equations that reflect the ways these relationships have changed in the past, along with their best understanding of how they might change in future. For example, they might assume that per capita demand in developing nations will gradually converge with western lifestyles. They might make alternative assumptions, too, and test how this would change their results.
Researchers must also answer more specific questions, such as how much it would cost to build a coal-fired power station and how quickly this cost might change. They must say how much it will cost to extract oil and how much is available, using what is known as a “supply curve”.
Another “critical” assumption relates to how quickly low-carbon technologies can be deployed by the model, says Prof Valentina Bosetti, an environmental economist at Milan’s Bocconi University and a lead author for the IPCC’s fifth assessment report.
Some of the assumptions in IAMs will be fixed, whereas others can change within the model. For example, in some IAMs wind and solar get cheaper as they become more widespread. This is called “induced technology change” by modellers and reflects the “learning by doing” that has seen renewable costs drop dramatically in recent years.
Integrated Assessment Models (IAMs) help us understand how human development and societal choices affect the natural world, including climate change.
They are highly complex tools (interlinked boxes, below) built on a v. long list of assumptions (blue boxes around the outside). pic.twitter.com/4nqy1qRkTT
— Simon Evans (@DrSimEvans) September 26, 2018
Yet many of the assumptions that drive IAMs are deeply uncertain, depending on changing and unknowable forces, such as habits, social mores, political shocks, or disruptive innovation.
Researchers use “scenarios” or “storylines” to ask questions of their models and to explore plausible alternative futures. These might range from fast to slow economic growth, or use modified assumptions that simulate different attitudes to the environment. Other scenarios might restrict the outputs of the model – for example, with a limit on emissions or warming.
“Shared Socioeconomic Pathways” (SSPs, follow the link for Carbon Brief’s detailed recent explainer) drawn up by the IAM community help formalise these futures into storylines where, for example, the world focuses collectively on sustainability, grows without regard for the environment, or continues much as things are today.
By running each SSP through multiple IAMs, scientists can explore the implications of each storyline, in terms of changes in the global energy mix, emissions or land use.
Despite looking at the same SSP storyline, however, these “runs” can differ substantially depending on the characteristics – or “personality” – of each model, which reflect the way it has been built and the underlying assumptions it uses. Areas of agreement and differences between IAM pathways are set out in the sections, below.
GDP and population growth are two very influential assumptions driving IAM results. This is explained in the book-length 370-page documentation for IMAGE, a prominent IAM developed by the Netherlands Environmental Assessment Agency (PBL). These paragraphs describe how the IMAGE energy module works
“The model determines demand for energy services with population and income as primary drivers and assumptions on lifestyle. Demand is met by final energy carriers [such as liquid fuels or electricity], which are produced from primary energy sources [such as coal, oil or the wind].
“The mix of final energy carriers and the technologies to produce them [coal plants, wind turbines] are chosen on the basis of their relative costs. Key processes that determine these costs include technology development and resource depletion, and also preferences, fuel trade assumptions and policies.”
Although the details vary, most IAMs follow a similar logic, such that rising GDP and population tends to drive rising demand for energy. This may be tempered, depending on assumptions about how efficiently energy gets used, but remains a strong underlying force in the majority of IAM runs.
Similarly, larger and richer populations are generally assumed to demand more food and increasingly western diets.
See how GDP and population drive IAM results in the illustrative graphic, below.
As well as shared pathways for GDP and population, the SSPs describe consistent storylines about the future reflected in a long list of additional assumptions. These include technology costs, energy demand, societal attitudes, existing climate policies and fossil fuel availability.
Note that many of these shared assumptions are qualitative – “low”, “medium” or “high” technology costs, for example – as you can see in the table, below. Note also how the pathways include a measure of “social acceptance”, in addition to assumptions about cost. In practical terms, however, this “acceptance” will usually be modelled as an addition to, or reduction from the base cost.
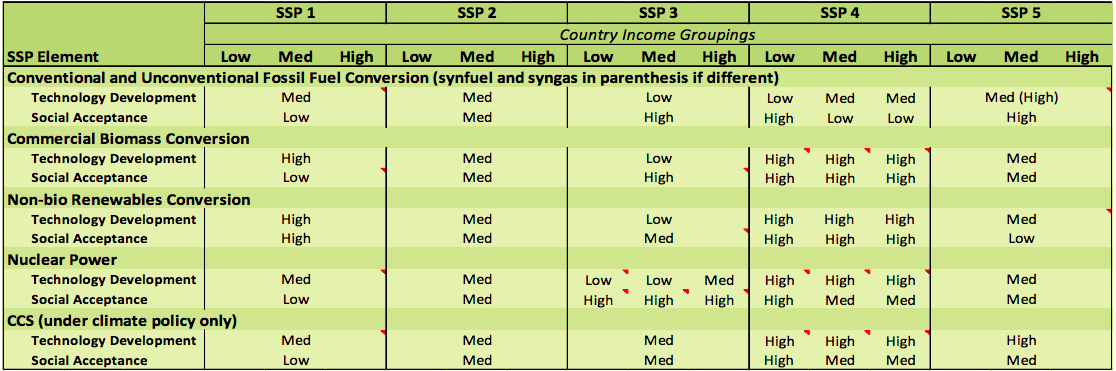
Qualitative assumptions about the cost and ‘social acceptance’ of different energy technologies in low, medium and high income countries under the Shared Socioeconomic Pathways (SSPs). Source: Riahi et al.
While the SSPs set out shared assumptions in qualitative terms, the detailed, quantitative inputs to each model are chosen separately by its modelling team. This is largely because the IAMs are structured in different ways. For example, one might include a single cost for each technology, whereas others use a capital cost, an operational cost, a decommissioning cost and so on.
Most IAMs use economics to drive decisions, based on prices, supply and demand. Different parts of the economy or energy system are represented by “agents”. Broadly speaking, these agents are assumed to hold perfect information about the world, which they use to make rational decisions about what to buy and sell on the market to maximise their “welfare” in an economic sense.
The equations of the model are “solved” for a particular period of time, in which overall welfare is maximised or costs minimised. These time steps can be one year, five years or 10 years. These time steps reflect another trade off between computing power and detail.
Some models try to maximise welfare or minimise costs in every time period at the same time, generating an optimal solution to a problem, such as how to avoid 2C of warming. In order to do this, agents in the model have “perfect foresight”.
Put simply, this means they take into account all future decisions in choices made today. Although this sounds unrealistic, it can be a useful way to search for the most efficient route to meet a target.
For example, a coal plant might be the cheapest way to supply electricity today, but it might then need to be closed before the end of its economic life, in the face of rising carbon taxes. This means it might, ultimately, prove cheaper to build a lower-carbon alternative in the first place, even if it is slightly more expensive – particularly if its early deployment helps to drive down future costs.
Alternatively, some models are “myopic”, meaning each time step is “solved” alone without taking into account future decisions. These models are better suited to exploring pathways where action is delayed or where early choices – such as building that coal plant – prove unwise, locking in higher emissions and raising the cost of meeting climate goals.
At the end of a model run, the outputs include economic outcomes emissions and pathways of future energy and societal transformation. See below for some examples of consistent findings from different IAMs, as well as ways in which their outputs vary.
Why do we use IAMs?
IAMs are used to answer “what if” questions about the relationships between society and the natural world, including its changing climate.
Two broad types of question ask “what would happen if…?” and “how could we get to…?”. For example, modellers construct “baseline” scenarios to explore what would happen if the world does nothing to reduce greenhouse gas emissions. Another set of scenarios looks at how the world would need to change if warming is to be limited to 1.5 or 2C.
The diagram in the previous section, above, illustrates how IAMs can track the implications of GDP and population growth for outcomes in the rest of the human-Earth system. This is the first type of question – in other words, what would happen if the world’s population reaches eight billion by 2100? What about 10 billion? What if GDP growth is fast, versus slow?
The second type of question is exemplified by climate targets, such as temperature limits or fixed carbon budgets. Scientists can impose these limits on their models and then see how the resulting pathways differ from their “baseline” scenarios, as the graphic below explains.
The sorts of changes needed to avoid dangerous warming are explored in more detail below.
Over the years, there has been something of a shift in emphasis from asking the first type of question with IAMs – “what happens if…?” – towards the second type of question – ”how can we get to…?”. This reflects policymakers’ changing priorities, first in understanding the scale of the climate problem and later, in understanding their options to avoid dangerous warming.
This shift puts IAMs in an important position regarding climate policy choices, says a paper by the University of Melbourne’s Kate Dooley and colleagues:
“The move from SRES [a set of IAM scenarios developed in the 1990s] to RCPs [developed more recently and used in combination with the SSPs] represents a critical change in how models are used to inform climate policy: from ‘what climate outcomes would future emissions produce?’ to ‘what are the measures and actions needed to reach particular warming outcomes?’…[This shift] places IAMs in a position of considerable authority regarding future climate policy.”
Nevertheless, IAM pathways are not prescriptive, says Prof Detlef van Vuuren, senior researcher at PBL and member of the board of the Integrated Assessment Modelling Consortium (IAMC), which develops shared IAM scenarios. He tells Carbon Brief:
“The idea is not to present forecasts – it’s impossible to know the future. It’s also not to provide blueprints that tell policymakers what to do, but to support policy decisions between different choices,”
As van Vuuren says – and as explained in previous the sections – the future is highly uncertain, particularly when it comes to modelling human relationships and choices. This means IAMs come with caveats, which are important to bear in mind when interpreting their results.
Dr Bert Metz, former co-chair of the IPCC working group on mitigation and now senior adviser to the European Climate Foundation (ECF*), tells Carbon Brief:
“IAMS are very valuable because they bring together all elements – not just the climate but economics, population growth, etc – and therefore they can paint a reasonable picture of what the future would look like. But the critical thing is they are based on assumptions. So the strength of that picture depends on the strength of your assumptions.”
One way to deal with this uncertainty is to look for findings that are robust to different models and different assumptions about the future, explains Dr Céline Guivarch, senior researcher on the impacts and mitigation of climate change at CIRED in Paris. She tells Carbon Brief:
“Fundamentally, the issue of climate change is a question of decisions under deep uncertainty, which we have to accept and embrace. We have to make decisions that are robust against [that] uncertainty…”
“Even if [different IAMs] give different answers, there are some areas of consensus, for example NDCs [country climate pledges] are not sufficient to get on a 2C trajectory. And that is something completely robust across models.”
A range of other robust IAM findings are discussed in more detail later in this article. Unfortunately, even these consistent results are open to misinterpretation, van Vuuren warns. For example, the fact that carbon capture and storage (CCS) is used in most IAM pathways that limit warming to 1.5 or 2C does not mean it is impossible to reach these targets without the technology, he says.
In order to say that a particular technology or pathway is “required”, modellers would have had to explicitly attempt to meet the target without using it. Even then, they can only say that the IAM is incapable of meeting that goal without that technology, subject to its structural limitations and other assumptions. Moreover, IAMs can say very little about political or social constraints.
There’s always a way to come up with a set of assumptions showing a particular pathway is possible in a model, says Guivarch. But she adds: “A trajectory that is feasible in a model can reveal itself to be quite unfeasible in the real world.”
Rather than dictating specific requirements for climate goals to be met, IAMs can help policymakers navigate the trade-offs and consequences of different choices, says van Vuuren.
For example, many deep decarbonisation scenarios make heavy use of negative emissions from bioenergy with CCS (BECCS), as set out below.
Some see this as problematic, for reasons including damage to biodiversity and a risk of not generating negative emissions as expected. Models’ reliance on BECCS is “profoundly misleading” for policymakers, according to a participant at a recent conference on negative emissions.
Yet it is IAMs themselves that have, to some degree, highlighted the existence of these trade-offs, by showing how use of BECCS might affect forests and other land use, van Vuuren says.
On the other hand, the dominant position of BECCS in 1.5C pathways may have obscured the study of alternative pathways, says Steve Pye, principal research associate at the UCL Energy Institute. He tells Carbon Brief:
“It means we don’t put enough effort into exploring alternatives on the [energy] demand side – as the [energy] supply side has dealt with the challenge.”
(It is worth adding that a number of more recent research studies have indeed sought to find alternative pathways to 1.5C that minimise or eliminate the need for BECCS through reduced energy demand.)
Key questions for IAMs, from the point of view of policymakers, include how much would the world warm if countries follow their existing climate pledges until 2030, or what will happen if countries delay action.
These questions are relevant to political processes under the Paris Agreement on climate change, one senior climate diplomat tells Carbon Brief, even if IAM results have less relevance for detailed negotiations over legal text.
Examples include the 2018 Talanoa Dialogue and 2023 global stocktake of progress towards the ultimate goals of Paris, the diplomat says. (The IAM runs suggest that countries will need to strengthen their efforts in the years before 2030, if those goals are to be met.)
Beyond the reasons already mentioned for using IAMs, there is an almost endless list of questions that scientists can ask of their models.
How will energy demand be met in future, depending on technological advancements and rates of deployment? How important are assumptions about future technology costs? Are modelled rates of energy transformation to reach climate goals realistic, compared to historical examples of change?
What are the least-cost routes to meeting climate goals? How would those pathways affect land use, biodiversity or water scarcity? Is it possible to reach 1.5C without negative emissions? What would it mean if consumer preferences and the ways we use energy shift dramatically?
Do experts think IAM energy pathways are plausible when compared to their own expectations? Why do many IAM pathways have a tendency to use lots of coal? What type of fossil fuel resources can be exploited – and where – while still respecting global carbon budgets? Do discount rates make a difference to IAM results?
The list goes on. The most comprehensive summary of IAM research questions and findings can be found in the IPCC’s fifth assessment report, in the chapter from Working Group III (WG3). However, a more up-to-date review will be included in the forthcoming IPCC special report on 1.5C, due to be published in the second week of October.
What are the different complex IAMs?
The term IAM is often confusing, as it is used to refer to two very different types of models. Simple IAMs are cost–benefit economic models that use simple assumptions to estimate mitigation costs and future climate damages. Complex IAMs combine energy system/land use models that estimate how greenhouse gas emissions from these systems might change in the future under different assumptions of future population and economic growth.
The first complex IAMs emerged out of Stanford University’s Energy Modeling Forum in the early 1980s. These models have grown significantly more sophisticated over time, bringing together standalone modules for land use and the climate system.
The screenshot below shows part of the configuration file for “GCAM”, one complex IAM that integrates the climate system into its model. The code shows the different ways the model can be used to explore climate policy goals.

There are a number of groups around the world that currently develop global-scale complex IAMs. Six groups participated in the recent Shared Socioeconomic Pathways (SSP) modelling project that will serve as the basis for the no-policy baseline and mitigation scenarios featured in the upcoming IPCC sixth assessment report. These are:
- The Model for Energy Supply Strategy Alternatives and their General Environmental Impact (MESSAGE), developed by the International Institute for Applied Systems Analysis (IIASA) in Vienna, Austria. This model has a detailed energy system that aims to meet demand at lowest cost. MESSAGE is usually also coupled with IIASA’s detailed Global Biosphere Management Model (GLOBIOM) to account for land-use and ecosystem changes.
- The Integrated Model to Assess the Global Environment (IMAGE), developed by the Netherlands Environmental Assessment Agency (PBL). This is oriented towards environmental problems – with a detailed, grid-scale land-use module – and does not directly model the economy. It can be linked to numerous other modules to assess air pollution, flood risk and biodiversity loss, among others.
- The Asia-Pacific Integrated Model (AIM), a collaborative programme of research institutes in several Asian countries. It has one of the more fully-featured economy models, covering individual sectors from food products, to iron and steel, and construction. AIM is also sometimes referred to as AIM/CGE, reflecting the Computable General Equilibrium utilised in that version of the model.
- The Global Change Assessment Model (GCAM), developed by the Pacific Northwest National Laboratory in Washington state, along with a large group of contributors across the academic community. GCAM is known for its open-source code and for its focus on exploring uncertainty.
- The Regional Model of Investments and Development (REMIND), developed by the Potsdam Institute for Climate Research (PIK) in Germany. REMIND has been coupled with the Model of Agricultural Production and its Impact on the Environment (MAgPIE) to incorporate land-use characteristics. It has a detailed energy system model and simple economy. Using “perfect foresight” and technology “learning by doing” it can identify optimal pathways even if they have high upfront costs.
- The World Induced Technical Change Hybrid (WITCH) model, developed by a number of Italian organizations including Fondazione Eni Enrico Mattei and the Centro Euro-Mediterraneo sui Cambiamenti Climatici. WITCH is often coupled with IIASA’s GLOBIOM for land-use. It has a particular focus on using game theory to explore co-operative versus non-cooperative climate action. WITCH also models technology cost reductions through “learning by doing” and “learning by researching”.
These IAMs have all used the “Model for the Assessment of Greenhouse Gas Induced Climate Change” (MAGICC), a simple climate model developed by Prof Tom Wigley at US National Center for Atmospheric Research (NCAR) and colleagues.
MAGICC translates emissions into atmospheric concentrations, radiative forcing and global average temperature change. It can be run much more quickly than more complex General Circulation Models (GCMs) or Earth System Models (ESMs). MAGICC allows IAMs to easily determine what emission trajectories are required to meet mitigation targets, such as keeping warming “well below” 2C above pre-industrial levels.
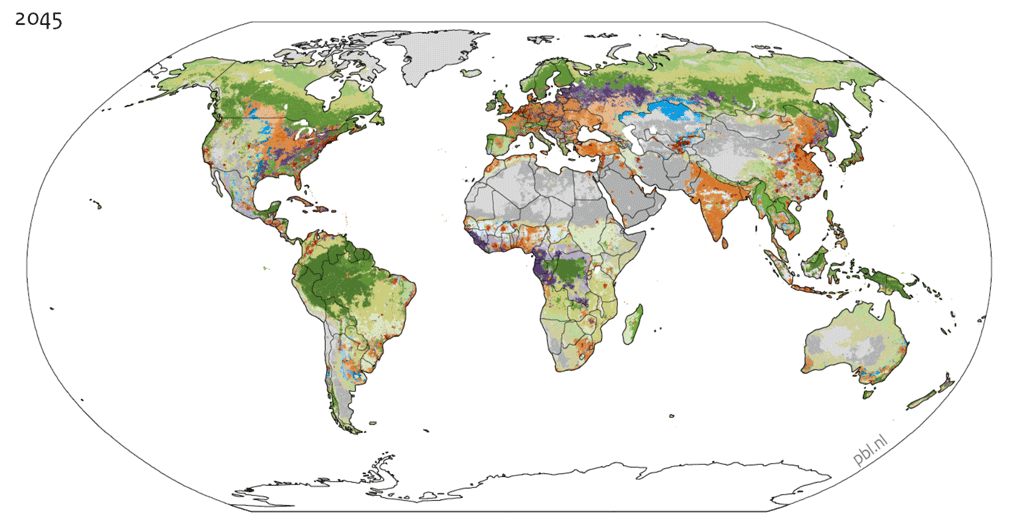
Land use in 2045, as modelled by IMAGE, one prominent IAM developed by the Netherlands Environmental Assessment Agency (PBL). This map shows different types of land use including cropland (shades of orange), forest (dark green), grassland (light green), purple (“mosaic” forest and cropland), blue (“mosaic” crop and grassland), red (urban) and grey (bare land). Source: PBL.
There are many additional IAMs and energy system models, which were not included in the SSP modelling project, but which have participated in other international modelling efforts. These include:
- The Dynamic New Earth 21 Model (DNE21) from Japan’s Research Institute for Innovative Technology (RITE).
- The General Equilibrium Model for Economy-Energy-Environment (GEM-E3) from the Institute of Communications and Computer Systems (ICCS) in Greece and researchers from Belgium and Hungary.
- IMACLIM from the Centre International de Recherche sur l’Environnement et le Développement (CIRED) in France, as well as researchers from around the world.
- The Model for Evaluating Regional and Global Effects of GHG reductions policies (MERGE), from the Paul Scherrer Institute (PSI) in Switzerland.
- The New Econometric Model of Evaluation by Sectoral Interdependency and Supply NEMESIS from an international group including ERASME (France), CCIP (France), the Federal Planning Bureau (Belgium), and the National Technical University of Athens (Greece).
- The TIMES Integrated Assessment Model (TIAM-UCL) from University College London and the UK Energy Research Centre.
- Prospective Outlook on Long-term Energy Systems (POLES) from the EU Joint Research Centre at the Institute for Prospective Technological Studies (JRC IPTS).
- WorldScan2 from the Netherlands Bureau for Economic Policy Analysis (CPB).
Some 31 IAMs contributed pathways to the IPCC’s most recent fifth assessment report, which drew from a database of 1,184 distinct scenarios. There are also a number of IAMs and energy system models that have a regional rather than global focus.
Finally, the International Energy Agency (IEA) publishes its annual world energy outlook, based on a detailed energy system model.
Where do different IAMs agree (and disagree)?
The different IAMs use diverse structures and approaches to model the world. They make different assumptions about the markets and human relationships they are attempting to capture and – frustratingly – often give different answers to the same question.
One approach to this problem is to check how well the models are able to reproduce patterns of historical change, to see if certain IAMs are “better” than others. Indeed, there have been attempts to validate models against historical data.
Unfortunately, however, past performance is not a reliable indicator of model quality, because the future may not be like the past. Alternatively, a series of model errors can compensate for each other, leading to an apparently accurate projection. Moreover, as noted above, there may not be a single “best” approach to modelling human behaviour and relationships.
Instead, researchers look for areas of agreement, while embracing the diversity of approaches in the different IAMs. These consistent answers include the emissions pathways needed to achieve 1.5C and 2C mitigation targets, as well as some of the energy system transitions needed to get there.
IAMs included in the SSP database all use the same simple climate model – MAGICC – to translate emissions into atmospheric greenhouse gas concentrations and, ultimately, to future warming. This means that they all end up having similar carbon budgets for a given target – say, limiting warming in 2100 to below 1.5C.
The models can differ, however, in how quickly emissions are reduced and, conversely, how much negative emissions they use later in the century. The figure below shows the emission pathways (left) and associated warming (right) for each of the IAMs in the SSP database that limit warming in 2100 to below 1.5C. The colours of the lines indicate the model used and each model is run for a number of different SSPs.
Total IAM CO2 emissions from the land, industry and energy systems in gigatonnes (Gt) CO2 (left) and global mean surface temperature relative to preindustrial (right) across all RCP1.9/1.5C scenarios included in Rogelj et al 2018. Chart by Carbon Brief using Highcharts.All of the 1.5C IAM scenarios have global emissions peaking around 2020 – and dropping to net-zero between 2040 and 2060. All of the IAMs have some degree of net-negative emissions in the latter part of the century, though the amount varies between 5GtCO2 and 32GtCO2 per year by 2100.
These are key messages for policymakers: To limit warming to 1.5C, global CO2 emissions must peak and then decline rapidly to net-zero. In addition, negative emissions of some sort are likely to be needed, with their scale and nature depending on other choices.
Another key message is that temperatures temporarily breach the 1.5C limit around mid-century, in all of the 1.5C scenarios in the SSP database. Warming reaches between 1.6C and 1.8C, before falling later in the century as emissions become net-negative.
Interestingly, the choice of the model often has a larger impact on the resulting emissions trajectory than the underlying SSP assumptions about future GDP, population and international policy cooperation. For example, in the REMIND model the SSP5 world has emissions reach net-zero in 2050, while even in a sustainability-focused SSP1 world MESSAGE and IMAGE emissions do not reach net-zero until the mid-2050s.
This reinforces the point that areas of broad agreement between the models offer greater insights for policymakers than the often substantial differences between them. “The IAMs agree on the big picture, [but] disagree on the details,” Dr Glen Peters tells Carbon Brief. Peters is a senior researcher at the CICERO Center for International Climate Research in Norway.
In IAMs limiting warming to below 2C, emission reductions are notably more gradual and net-negative emissions are a bit smaller, as shown in the figure below. Note, however, that emissions still peak and decline rapidly towards net-zero.
IAM CO2 emissions in gigatonnes (Gt) CO2 (left) and global mean surface temperature relative to preindustrial (right) across all RCP2.6/2C scenarios included in IIASA SSP Database. Chart by Carbon Brief using Highcharts.As for the 1.5C scenarios, emissions peak around 2020 in most 2C pathways, though a few have later peaks around 2030. Emissions reach net-negative between 2070 and 2090 in most 2C models, though a few GCAM ones have earlier net-negative emissions and one model run – AIM SSP1 – has emissions that stay positive through the end of the century.
Temperatures remain below 2C through the entire century in all but one model run – REMIND SSP5 – that has an overshoot to around 2.1C. In 2100, global temperatures are limited to 1.7C-1.8C, which gives around a 66% chance of avoiding more than 2C warming given the uncertainty in climate sensitivity.
This is aso broad agreement that the global energy system must be increasingly electrified, while shifting away from fossil fuels and towards renewables, in order to meet stringent climate goals.
The figure below shows the share of all final energy coming from electricity (left), the fossil fuel share of primary energy (middle), and the share of primary energy from renewables (right) in IAMs limiting warming to below 2C.
Electricity as a percent of final energy (left), fossil fuels as a percent of primary energy (middle) and renewables (biomass and non-biomass) as a percent of primary energy (right) across all RCP2.6/2C scenarios included in IIASA SSP Database. Chart by Carbon Brief using Highcharts.Today, only around 20% of the world’s final energy comes from electricity. All of the IAMs in the figure show this increasing rapidly to between 46% and 71% by 2100. This is because it is easier to decarbonise electricity than it is to eliminate emissions from the thousands of small sources burning fossil fuels for space heating, industry or transportation.
Similarly, fossil fuel use drops dramatically in all of the 2C pathways – from around 83% of primary energy today to between 2% and 43% in 2100. At the top end of this range, models such as AIM couple continuing use of fossil fuels with large-scale deployment of carbon capture and storage (CCS). At the bottom end, models such as REMIND virtually eliminate fossil fuel use.
Renewable energy sources are the main replacement for fossil fuels in 2C pathways, rising from 14% today to between 51% and 95% in 2100. (Note that nuclear also plays an important role, particularly in models such as GCAM).
Renewables includes solar, wind and hydro, as well as expanded use of biofuels. Often, the biofuels are tied to negative-emission-generating biomass with carbon capture and storage (BECCS).
It is worth adding that the primary energy metric used here understates the role of renewables in mitigation pathways. This is because much of the primary energy contained in fossil fuels is wasted as heat, with only 33% to 50% converted into useful electricity, for example In contrast, renewables have 100% generation efficiency for the purposes of primary energy calculations.
How do future energy pathways from IAMs differ?
Changing the future energy mix away from fossil fuels and toward more renewables, biofuels, or fossil fuels with carbon capture and storage (CCS) is one of the main ways that IAMs develop scenarios to achieve emission reduction targets.
(Arguably, IAMs are biased towards these technological “supply side” solutions to cutting emissions, when compared to changes in the way that energy is used on the “demand side”. Researchers are starting to redress this balance.)
Beyond the broad shift away from fossil fuels, however, there are large differences between the future energy mix in IAMs. These differences are driven by the strictness of mitigation targets, as well as the ways each model is structured and its assumptions about future technological development, fuel prices and other factors.
The figure below shows the primary energy mix in the year 2100 in the six IAMs that participated in the Shared Socioeconomic Pathways (SSP) modelling project. The energy mix for each model in a “baseline” scenario with no climate policy is shown on the left, while scenarios that limit warming to below 2C in 2100 are shown on the right.
Primary energy mix in 2100 by IAM, for SSP2 baseline scenarios (left) and for SSP2 RCP2.6 scenarios (right). The renewables category includes hydro and non-hydro renewables; fossil fuel categories include CCS and non-CCS use. Data from the IIASA SSP Database. Chart by Carbon Brief using Highcharts.The baseline scenarios shown are from SSP2, which represents a “middle of the road” pathway where historical patterns of development are continued throughout the 21st century. The 2C scenarios use the same population, economic growth and other constraints.
Other SSPs might result in different energy mixes, even in the same IAM and mitigation target. This is down to shared policy assumptions and constraints on technological development and deployment within each SSP storyline. See Carbon Brief’s SSP explainer for more details on how SSPs affect IAM pathways.
The IAM baseline scenarios continue to be dominated by fossil fuels, though the relative shares of coal, oil and gas vary considerably across the different IAMs. For example, the IMAGE IAM envisages nearly twice the coal consumption and half the oil consumption of WITCH.
Similarly, the REMIND model sees significant deployment of renewable energy even without climate policy, due to falling costs, whereas AIM, GCAM and IMAGE have relatively low renewables growth. This is largely because REMIND models the “learning by doing” that has seen renewable energy costs fall as deployment increases, whereas most other IAMs do not.
Somewhat surprisingly, the amount of renewables deployed in the MESSAGE, REMIND and WITCH baseline scenarios exceeds the amount in the GCAM and IMAGE 2C scenarios. This suggests that assumptions around technological development and energy costs can play as big a role as climate policy in the models’ future energy systems.
IAM scenarios that limit warming to below 2C also differ substantially in their energy mix. Some, such as GCAM and REMIND, completely eliminate coal use in favour of biofuels and technologies such as BECCS. Others include a sizable amount of both coal and gas coupled to CCS.
Nuclear use also differs significantly across IAM 2C scenarios. At one extreme, GCAM foresees a massive expansion of nuclear, providing nearly a quarter of all energy globally by 2100. Other models, such as REMIND and WITCH, show a much more modest expansion.
Finally, IAMs have very different visions for the future of oil in a 2C world. Their assumptions around the expansion of electric or other alternative-fuel vehicles play a large role in this, since oil is primarily used for transport. Some IAMs, such as MESSAGE and REMIND, see a near-complete elimination of oil – a fuel that is not well-suited for CCS – while others see some future oil use as more difficult to avoid.
Although it is tempting to ascribe these differences between the IAMs to specific individual features of the models, the picture is more complicated. “It’s tough…There might be five or 10 reasons why the models give you different results,” says Rogelj.
The future energy mix in IAM pathways also may not match expert expectations. In particular, IAMs have come under considerable criticism for their relatively low projections of solar power and, conversely, for their extremely optimistic projections of CCS and BECCS.
Indeed, experts tend to have much higher expectations for solar development than IAMs, according to a 2018 paper, by Dr Mariësse van Sluisveld of the Netherlands Environmental Assessment Agency (PBL) and colleagues. This compared the relative ranking of year-2050 electricity generation technologies in IAMs to the rankings from 39 experts drawn from the lead authors of various international reports on climate and energy.
The figure below shows how experts ranked technologies on the vertical y-axis compared to the IAM rank on the horizontal x-axis, for both baseline scenarios (left box) and those limiting warming to 2C (right box).
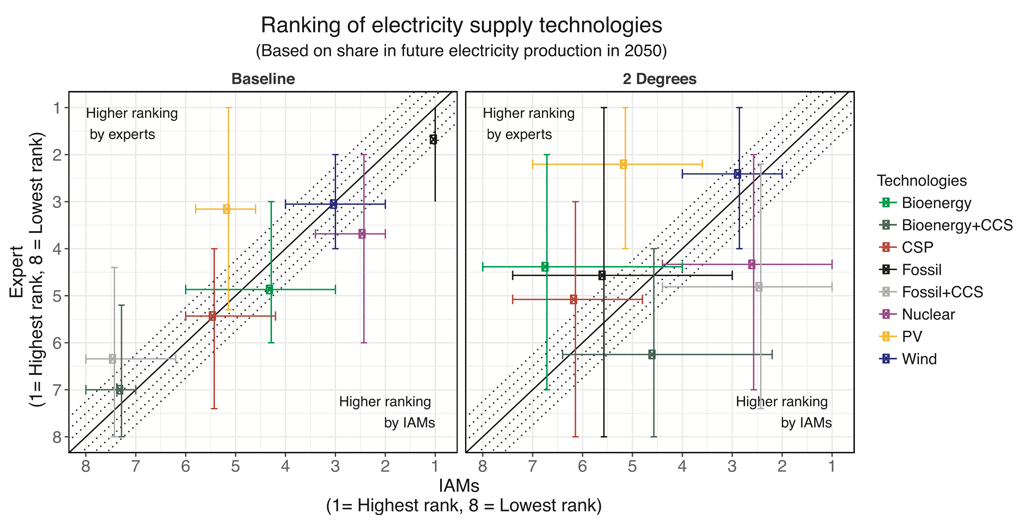
Range of expert ranks (y-axis) and IAM ranks (x-axis) for electricity generation technologies in 2050. Baseline scenarios shown on the left, with 2C scenarios (RCP2.6) on the right. Taken from Figure 1 in van Sluisveld et al 2018.
The experts they surveyed generally agreed with the ranking of electricity technologies in the baseline scenario, though they tended to rank solar considerably higher and nuclear a bit lower. However, in the 2C scenario the expert rankings and IAM rankings differed more substantially.
Experts ranked solar much higher than IAMs, giving it the highest rank among any technologies, whereas it was ranked only the fifth highest by IAMs. Experts ranked bioenergy (without CCS) higher as well; they had much lower expectations for fossil fuels and bioenergy with CCS, as well as for nuclear.
One key message from these varied projections is that there is no single answer to the question of how the global energy system should change to limit future warming. It is possible to meet climate goals using mainly renewables and biomass, as in the REMIND model. Or the same targets can be met using a combination of renewables, nuclear and fossil fuels with CCS, as in the GCAM model.
How much “negative emissions” do IAMs rely on?
IAM pathways that limit warming to 1.5C or 2C generally rely on large amounts of “negative emissions”. This refers to CO2 being actively removed from the atmosphere and usually occurs mostly in the latter part of the 21st century.
This heavy use of negative emissions is driven by several factors. One is the sheer pace and scale of cuts needed to meet strict climate targets after decades of rising emissions. Another is the structures and assumptions built into IAMs, which suggest those rapid cuts are either impossible or too costly, compared to deploying negative emissions on a grand scale later in the century.
Discounting is also factor. This is an accounting practice that is widely used in economic analysis, which weighs near-term costs more heavily than those in the future.
(“Discounting means there’s a tendency to delay action, which allows models to focus on solutions – like CO2 removal – that happen later in the century,” says Pye. “That’s a high-cost technology but it happens later in the century, so it’s economically optimal.”)
The figure below shows an example of CO2 emissions in a typical IAM pathway limiting warming to below 1.5C – in this case the MESSAGE model run with an SSP2 storyline. In this and similar pathways, emissions tend to peak in the next few years before falling sharply, reaching net-zero by the late 2050s (thin black line).
Some residual fossil fuel emissions continue (grey shaded area). Large amounts of negative emissions are employed through a combination of bioenergy with carbon capture and storage (BECCS, blue) and “natural climate solutions” (NCS, green).
Positive emissions, BECCS, and negative emissions from NCS in the MESSAGE SSP2 1.5C (RCP1.9) scenario. Data from the IIASA SSP Database and courtesy of Dr Joeri Rogelj; Chart by Carbon Brief using Highcharts.By the end of century, this pathway entails around 17GtCO2 being removed from the atmosphere every year – slightly less than half of overall global emissions in 2017. (Note that IAMs use BECCS and NCS because those are the ways the model knows how to generate negative emissions. Other options, such as direct air capture, tend not be modelled by IAMs as they are less well understood from a cost and technical perspective.)
It is possible to create scenarios where 1.5C or 2C targets are met without the large-scale use of negative emissions – or at least without BECCS. However, these tend to require very rapid cuts in global emissions, falling to near-zero within a decade or so.
All of the standard IAM runs in the SSP database employ some degree of negative emissions for both 1.5C and 2C targets, as the figure below shows. However, some models and underlying SSPs tend to make greater use of negative emissions than others.
The figure shows the cumulative amount of negative emissions between 2005 and 2100 in all of the 1.5C and 2C SSP scenarios. Each bar represents the range of negative emissions in each pathway, with the dot representing the average across all models. The left-hand axis shows negative emissions in GtCO2 and the right-hand axis shows how many years of current emissions this amounts to (using 40GtCO2 from 2017).
Smallest, largest, and average cumulative negative emissions between 2005 and 2100 by SSP for 1.5C scenarios (RCP1.9 – left) and SSP2 2C scenarios (RCP2.6 – right). Values are shown in GtCO2 on the left-hand axis and chart labels. The right-hand axis shows values relative to years of current emissions. Negative emissions from land use are defined as periods when land-use emissions are net-negative at the global level. Data from the IIASA SSP Database and courtesy of Dr Joeri Rogelj. Chart by Carbon Brief using Highcharts.Negative emissions use ranges widely, from 400GtCO2 to 1,600GtCO2 (10-40 years of current emissions) in 1.5C scenarios and from 250GtCO2 to 1,150GtCO2 (6-27 years of current emissions) in 2C pathways. The use of negative emissions effectively increases the size of the remaining carbon budget, by between 72% and 290% in 1.5C scenarios and by between 19% and 86% in 2C scenarios.
The amount of negative emissions in model pathways is related to their structure, assumptions and underlying SSP, which limits the speed of global cooperation on climate change and rapid emission reductions.
Emissions reductions can occur more quickly in the more sustainability-focused pathway (SSP1) and this tends to reduce the amount of negative emissions needed to meet climate goals. SSP1 also allows for greater emission reductions and negative emissions from land-use changes, and most IAMs show correspondingly larger negative emissions from NCS.
The rapid fossil fuelled-growth pathway (“SSP5”), which tends to result in a later peak and slower reduction in emissions, requires correspondingly more negative emissions to compensate.
To remove CO2 from the atmosphere, IAMs mostly rely on BECCS to provide the required negative emissions. The scale of the deployment of this largely unproven technology is huge. Some IAM pathways allocate up to five times the area of India to growing the biomass needed by 2100.
IAMs also employ negative emissions from NCS, primarily in the form of afforestation and reforestation. However, the extent of this varies greatly across models and not all IAMs are able to deploy all possible NCS options.
The figure below shows the cumulative amount of negative emissions employed between 2005 and 2100 by the IAMs that participated in the SSP modeling project, with the models shown taken from the SSP2 pathway. Each bar represents a different IAM, with the blue bars showing the total negative emissions from BECCS and the green from NCS.
Cumulative negative emissions between 2005 and 2100 from BECCS (blue) and land-use (NCS, green) by IAM for SSP2 1.5C scenarios (RCP1.9 – left) and SSP2 2C scenarios (RCP2.6 – right). Values are shown in GtCO2 on the left-hand axis. The right-hand axis shows values relative to current annual emissions. IMAGE and WITCH do not provide SSP2 1.5C scenarios. Data from the IIASA SSP database and courtesy of Joeri Rogelj; Chart by Carbon Brief using Highcharts.The scale of NCS included in IAM pathways varies considerably between models, with median emissions removals from land use of 160GtCO2 by 2100. One model, GCAM, is particularly bullish on this. It deploys more than twice as much negative emissions from NCS as any other IAM, with 450-720GtCO2 by 2100. This is higher than the best estimate of cost-effective potential from a recently published high-profile review.
There are also some questions as to whether cumulative negative emissions from BECCS exceeding 400GtCO2 are actually achievable. A number of recent studies have questioned the high-end estimates of BECCS use, when emissions associated with converting land from forest or grassland for use in growing energy crops are properly taken into account.
What limitations do IAMs have?
Complex IAMs are useful, but necessarily imperfect attempts to model future patterns of human society and demographics, as they interact with – and disrupt – the natural world. They have many imperfections, not least because they must try to capture societal preferences, social mores, habits and behaviours, both now and as they change in future.
However, despite their limitations, IAMs remain valuable tools to explore the choices that will contribute to climate change, or limit its extent. “It’s not giving you precise answers…[but] it’s good guidance for policy.” says Metz. “They’re the best thing we have.”
From a long list, there are two key limitations, Metz tells Carbon Brief:
“[Complex IAMs] only look at abatement cost. The other side of the equation is missing – the avoided damages, the avoided adaptation costs. So it can be misleading…[and] can be used by those that want to undermine climate action…”
“The other main limitation of IAMs is the least-cost paradigm [where models try to meet policy goals at the lowest possible cost]. Of course, politics is not always about least cost. On the contrary, often it is about what is easiest to push through, rather than least cost per tonne of CO2.”
In addition to ignoring climate damages, the potential co-benefits of efforts to limit warming are also often missed by IAMs. Many of them are theoretically capable of modelling air pollution or health impacts using, say, bespoke add-on modules. Yet the economic benefits of addressing these and other problems are rarely included, alongside IAM findings on the costs of cutting emissions.
Besides these issues, IAMs have a range of other limitations, all of which are important to remember when interpreting their results.
Political constraints
As Metz mentions above, the world of politics is quite unlike the rational, least-cost world of a model. Indeed, another limitation of IAMs is their lack of political constraints. Pye explains:
“The models might have construction time constraints, for example, but not political constraints. They’re devoid of the political economy type narratives…Even if you don’t introduce that to the model, it’s vital to bear it in mind when interpreting the results.”
For example, IAMs frequently use a global, economy-wide carbon price as a proxy for “climate policy” when developing pathways to meet temperature limits. One reason is because it is relatively easy to adjust modelled fossil fuel prices, compared to simulating detailed policies.
As a result, it is relatively common to read that a particular CO2 price is “required” to meet climate goals or – as one Reuters article puts it – that prices “must soar to meet [the] Paris climate target”.
This is a double misinterpretation. First, this is because IAMs cannot tell us what price is “needed” to meet a target, unless they have ruled out alternatives. Second, a supposed policy solution that stands no chance of seeing the light of day is no solution at all. To date, the political hurdles facing economy-wide carbon pricing have been all but insurmountable, let alone on a global scale.
While it is true that IAMs tend towards CO2 pricing as a proxy for wider climate policy, models are able to look at a relatively wide range of other measures. Many of these revolve around pricing, including taxes, subsidies and additions to or multipliers of base costs, as proxies for other preferences.
Others include low-carbon power capacity mandates, energy efficiency mandates and caps on methane emissions from ruminant livestock or fossil fuel extraction activities. A comprehensive list of such experiments, with references, will appear in the forthcoming special report on 1.5C.
Future as past
Another issue is that IAMs are, in general, biased towards “future-as-past”, where existing societal trends, habits and relationships persist, according to a Columbia University primer.
They are unable to forecast shocks or innovations, from the oil crises of the 1970s and global conflicts through to the rise of computers, mobiles and the internet.

Officials at the main console of Univac 1108, 1972. Credit: Everett Collection Historical / Alamy Stock Photo.
Indeed, many IAMs have the same approach and conceptual basis as 1970s models of energy use, says Dr Justin Ritchie, an energy economist at the University of British Columbia’s Institute for Resources, Environment and Sustainability.
“What they’re doing is matching energy supply and demand – and there’s only a limited number of ways they can do that,” he says. “The [other] general narrative is the world is getting richer and converging on US and western European lifestyles.”
This limitation is explored in a paper on disruptive innovation and IAMs by the University of East Anglia’s Dr Charlie Wilson and colleagues. The paper explains:
“Global integrated assessment models which characterise pathways consistent with 1.5C mitigation are limited in their ability to analyse the emergence of novelty in energy end-use…
“A backward look to 1930 tells us that it is not science fiction to imagine that portfolios of mitigation options in 2100 may look very different from those available today. Yet peering through an IAM lense into a distant 2100 world in which warming has been limited to 1.5C, we see short-distance mobility is still by car, buildings still need heating and cooling, and food is still grown extensively using land. Consequently, scenario modelling tells us more about the preoccupations, beliefs and uncertainties of the present than about the possibilities of the future.”
Confusingly, despite this tendency to view the future as a continuation of the past and present, IAM pathways often foresee a reversal of historical trends away from the dirtiest sources of energy.
As a result, many “no-policy” model pathways tend towards “recarbonisation, where a world without climate policy inevitably leads to an energy supply with increased carbon intensity,” Ritchie argues in a paper published with his then-PhD supervisor and veteran IAM scientist Prof Hadi Dowlatabadi.
On the contrary, decarbonisation has tended to be driven over time by consumer preferences for less polluting sources of energy, argues Wilson in an Energy Transition Show podcast interview, with a shift from coal towards oil, gas and electricity. “[This] is a very strong historical tradition rather than something that’s completely out to lunch.”
If Wilson and Ritchie are right, then IAMs may be overestimating the difficulty of shifting the world off dirty sources of energy towards cleaner, lower-carbon fuels.
Supply-side bias
Wilson’s work has also looked at the supply-side bias of IAMs. This refers to models favouring technological fixes or shifts in the sources of energy, over changes in the way energy is used.
“Changes in energy end-use in global IAMs tend to be captured at the aggregated sectoral level as a function of changing incomes and prices,” write Wilson and colleagues. They continue:
“Explicit representation of end-use technologies [such as cars or televisions] and their passive systems [the ways they are used] in IAMs is generally quite coarse…End-use technologies are smaller in scale, orders of magnitude larger in number, more dispersed and highly heterogeneous when compared with the pits, pipelines and power plants of the energy supply [which is capture more fully by IAMs].”
This means that supply-side mitigation options tend to be the first port of call when an IAM looks to limit emissions. In contrast, researchers can often only explore demand-side solutions by manually varying the underlying assumptions that represent energy demand in their models.
In the audio clip, below, Wilson explains why he and his co-authors decided to look for alternative paths in the face of the “strong bias” towards technological solutions in IAM scenarios. The clip is taken from a longer interview with Wilson, on the Energy Transition Show podcast. He says:
“If you’re talking about 1.5C, even 2C, you’re talking about an absolutely fundamental systemic transition in the way we produce, deliver, convert and use energy. So focusing the scenarios and modelling analysis on just the one bit of it…is only part of the picture.”
These alternative pathways show there are ways to reach 1.5 or 2C that have not previously been explored, says Dr Jonathan Koomey, the founder and decade-long leader of Lawrence Berkeley National Laboratory’s Energy Forecasting Group, in another Energy Transition Show interview.
“[There are] degrees of freedom not explored in the models that could absolutely allow us to hit 1.5C. It doesn’t mean that it will be easy, it just means that you shouldn’t assume that whatever the models have modeled is all that is possible.”
Koomey’s previous work has shown that projections of energy demand have often tended to be “systematically [too] high”.
Human behaviour
Another key part of the picture that is difficult for IAMs to capture is human behaviour, given people are highly diverse and make decisions based on a host of factors, many of which are not financial. This is in contrast to the single “representative” rational consumer that lives inside many IAMs.
The diversity of consumer behaviours is clear from data on the uptake of low-carbon vehicles, says one 2018 paper in Nature Energy. It says:
“These empirical findings [data points] represent a major challenge for the analytical tools currently used to understand the dynamics of long-term energy transitions, including the class of global energy-economy integrated assessment models that regularly inform the assessment reports of the IPCC.”
The paper goes on to develop a new approach to modelling consumer behaviour in IAMs, specifically with respect to low-carbon vehicles. However, some others argue that the structure of most IAMs means they are ill-suited to handling diverse and often irrational human behaviour.

A Mclaren 650s driving in Rjukan, Norway. Credit: Artur Nyk / Alamy Stock Photo.
“Cars are a great example,” says Hector Pollitt, head of modelling at consultancy Cambridge Econometrics. “If everyone was cost-optimising, we’d all be driving Smart cars. But it’s pretty much the opposite of that: many people buy the most expensive model they can.”
While IAMs have been extremely useful, they have less to contribute when it comes to detailed policy design, Pollitt argues in a recent blog post. He writes:
“There is a lot of value in modelling results, if done properly. The most important issue is to make sure that the right sort of tool is used for the task at hand, which means not using optimisation-based modelling approaches [typical of most complex IAMs] to estimate real-world responses to policy.”
Transparency and documentation
All of these limitations are well understood by the researchers who devote their life to exploring climate change through IAMs. Yet the same may not be true for policymakers and the wider public.
One prominent critic of the IAM community is Dr Richard Rosen, a former fellow and a founding member of the Tellus Institute, a not-for-profit research and policy outfit. In a 2015 review, Rosen argued there is a lack of transparency around model structures and assumptions.
“There are dozens, if not hundreds, of key input assumptions for each model,” Rosen wrote, adding that these are insufficiently documented and that the models are essentially a “black box”.
As the IPCC’s second assessment report acknowledged back in 1995, the “sheer size” of IAMs makes them less transparent and harder to interpret, even for modellers themselves:
“The larger a model, the less transparent it is, and the harder it is for analysts and policymakers to interpret its results. The sheer size of the model renders full sensitivity analyses impossible and it becomes more difficult for the modellers themselves to oversee what is happening.”
In recent years, the IAM community has made significant efforts to improve the level of transparency around its work. The Integrated Assessment Modelling Consortium has set up a “wiki” documentation site for a number of IAMs, within a common framework. Users can compare the structure of the models or their approach to modelling the land-use system, for example.
Nevertheless, greater transparency and documentation remain a “work in progress”, says Guivarch. She adds: “IAMs are used to inform policy decisions so the community understands why it’s important to be transparent about our work.”
Choice of assumptions
A related issue is the assumptions that go into IAMs. How do modellers choose the “right” number or the “best” way to formulate their equations? In a paper published earlier this year, Pye and colleagues wrote:
“There are frequently many plausible choices that can be made for different assumptions, which often makes the justification of choices challenging, and also that there is sometimes disagreement amongst peers regarding which choices are appropriate. This confirms the need for more debate on specific model assumptions, for the transparency of choices to be increased, and for broadening the range of opinions to be tested, even those that are perceived as being outside of the ‘mainstream’.”
Pye’s paper found “weaknesses” in a number of “critical model assumptions that are highly influential” in driving the energy pathways in IAM scenarios. Yet using the latest data to improve IAMs is also a constant challenge, given the many assumptions they contain.
“From a practical point of view, these models are so big and complicated, it’s hard to keep them up to date,” Pye tells Carbon Brief. This is particularly true for the energy sector, where renewable energy costs are tumbling and electric vehicles are spreading faster than expected.
Wider input
Another recent commentary, published in Nature, says ethics should be given greater consideration during the IAM process, particularly in relation to negative emissions. The authors, from the Mercator Research Institute on Global Commons and Climate Change in Berlin, argue:
“Modellers inevitably make value-laden assumptions in charting different policy pathways, including the range of options being considered…[and] the political, economic and demographic stories behind them.
“A lack of transparency and ethical discussion has three consequences. First, policymakers have false expectations. This is the ‘moral hazard’ worry: if politicians and advisers think it is acceptable to emit carbon now and claw it back later, they might take more risks and obstruct mitigation in the real world…
“Second, designing climate policy around technologies that might never scale up is risky…Third, implementing negative emissions at the scales envisaged is ambitious, to say the least.”
Perhaps surprisingly – given they are the intended audience – policymakers are often not very involved in the development of IAMs, says Dr Annela Anger-Kraavi, an economist and senior research associate at the Cambridge Institute for Sustainability Leadership. Anger-Kraavi is also vice-chair of one of the technical bodies at UN climate talks, SBSTA, as well as an advisor to the Estonian government on climate policy and negotiations.
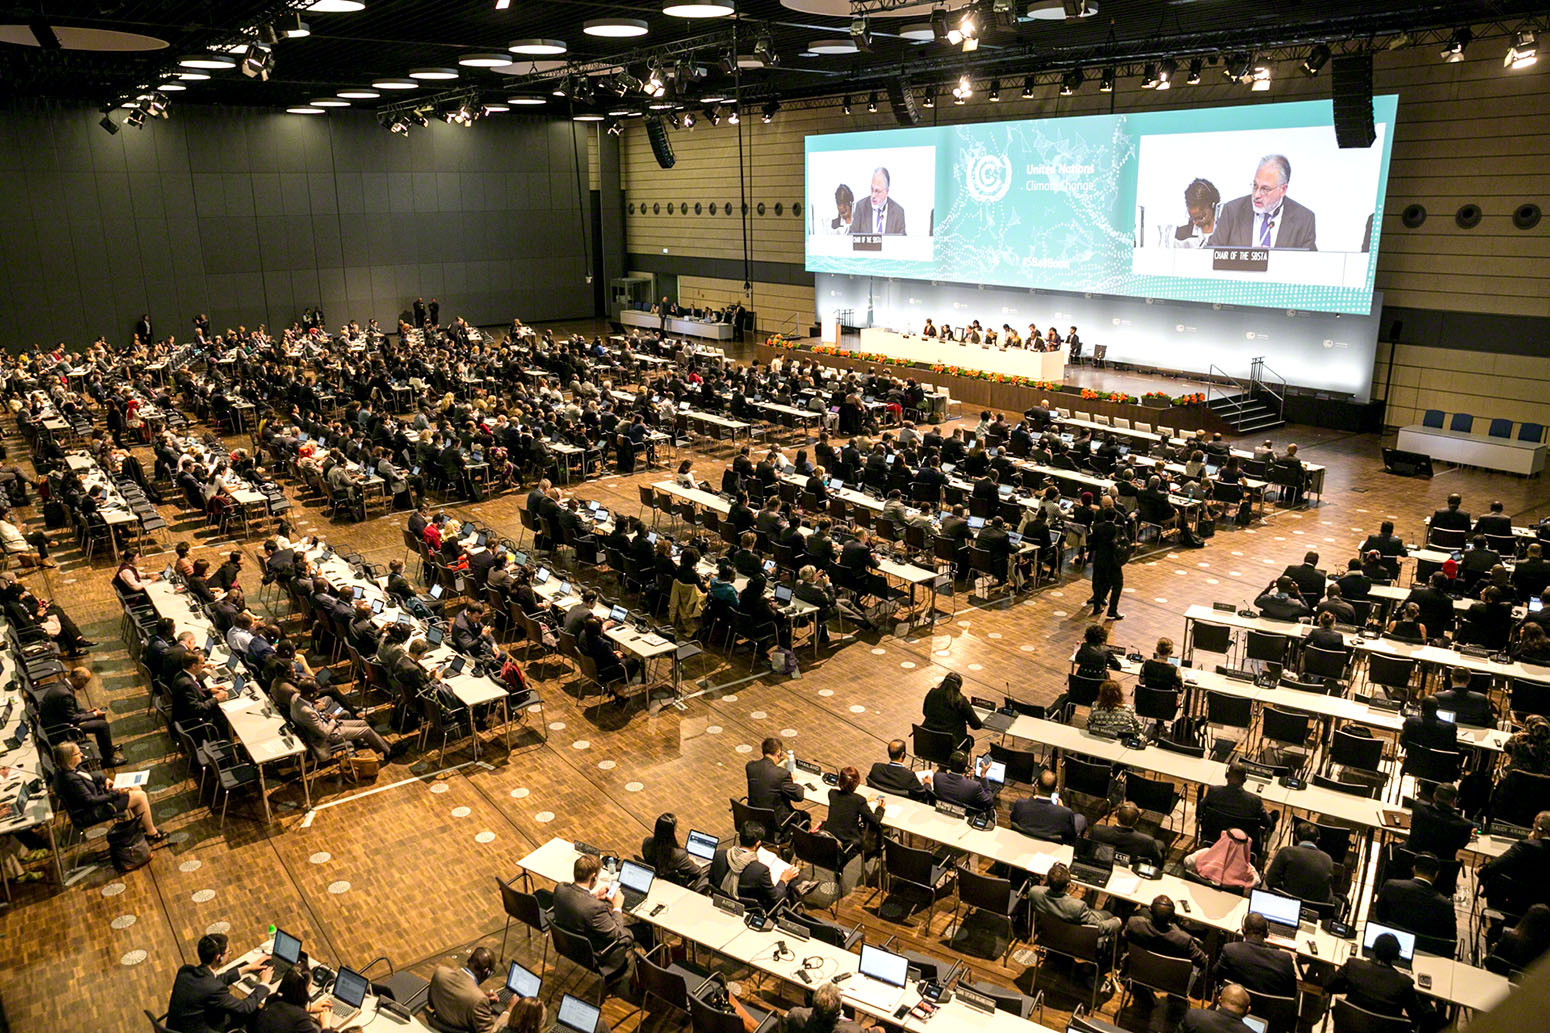
Delegates attending the Bonn Climate Change Conference 2018. Credit: Photo by IISD/ENB | Kiara Worth.
She points to the UN climate body’s research dialogue, which is one attempt to get scientists to talk to policymakers directly – “not just at side events,” Anger-Kraavi says. She also co-authored a paper proposing ways to make IAMs more relevant to the policy world, by drawing on a wider range of views when developing and using the models. The paper says:
“Among the key major criticisms of IAMs, we firstly focus on the ineffective – if any – inclusion of policymakers and other stakeholder groups in the heart of modelling activities; and the inflexibility to model the multiplicity of policy instruments in the formalised modelling frameworks. Furthermore, we highlight…the nature and number of assumptions, which are often formed outside stakeholder consultation and neglected when presenting assumption-driven modelling results to policymakers.”
Other issues include the limited geographical resolution in IAMs, which generally model the global economy and energy system divided into tens of regions, rather than hundreds of countries. This makes it hard to translate the results to country level, says Metz. Options to address this issue include “downscaling” tools to map regional insights onto countries, or national-scale IAMs.
Global IAMs also generally do not model electricity grids at an hour-to-hour or day-to-day resolution. This means they cannot consider the weather-related fluctuations that make it challenging to integrate variable renewables, such as wind and solar, into the grid.
However, most IAMs do include some mechanism to account for the costs of integration. The level of detail on this is improving, as set out in a 2017 paper by PIK’s Dr Robert Pietzcker and colleagues, which compares the approach taken by different IAM teams.
*Carbon Brief is funded by the European Climate Foundation.
Carbon Brief would like to thank all the scientists who helped with the preparation of this article.
IAM infographics by Tom Prater for Carbon Brief
-
Q&A: How “integrated assessment models” are used to study climate change
-
Q&A: What “integrated assessment models” tell us about climate change