Guest post: Calculating the carbon footprint of the NHS in England

Dr Marina Romanello
02.18.21Dr Marina Romanello
18.02.2021 | 4:32pmIn 2017, the Lancet Countdown on Health and Climate Change warned that the impact of climate change on human health is now so severe that it should be considered “the major threat of the 21st century”.
But while health services around the world will face the challenge of dealing with these impacts, the industry itself is responsible for a significant portion of the CO2 being added to the atmosphere each year.
That means accelerating mitigation efforts in the healthcare sector is essential to help ensure health is protected in a warming world.
In our recent study, published in the Lancet Planetary Health, we estimate the carbon footprint of the National Health Service (NHS) in England. Unpacking where these CO2 emissions are coming from, we calculate a total for 2019 of around 25m tonnes of CO2 equivalent. This is around 7% of the UK’s total carbon footprint for that year.
While this is sizeable, total emissions have dropped by approximately a quarter since 1990. And the emissions per patient have fallen by almost two-thirds. However, with the NHS aiming to reach net-zero emissions in 2045, there is still some way to go.
Healthcare’s response to climate change
With its responsibility for safeguarding the public, the health community has a prominent role at the forefront of climate change mitigation efforts – promoting its health co-benefits and building resilience to face future increases in healthcare demand.
This extends to reducing its carbon footprint. For example, healthcare in the world’s largest economies currently accounts for 4.4% of global CO2 emissions.
Any effort to reduce the footprint of health systems must be underpinned by a thorough understanding of emission sources and the activities that drive them.
To this end, carbon footprints have been published for healthcare systems in Australia, Austria, Canada, China, Japan, and the US – alongside international estimates.
However, the National Health Service (NHS) in England holds the only such effort carried out by the health system itself, which it has been developing and refining since 2008.
In 2020, a year dominated by the Covid-19 pandemic, the NHS announced its commitment to become the world’s first net-zero national health system by 2045.
The benefits of this commitment will hopefully spill over to other healthcare systems. As the largest single employer in Europe and the largest single-payer healthcare system in the world, the NHS can use its size and influence to drive its own emissions reductions, while paving the way for other health systems to follow suit.
The NHS approach to carbon accounting
In its greenhouse gas (GHG) emission accounting, the NHS follows the “GHG Protocol Corporate Standard” – a standardised framework developed by the World Resources Institute (WRI) and the World Business Council for Sustainable Development (WBCSD).
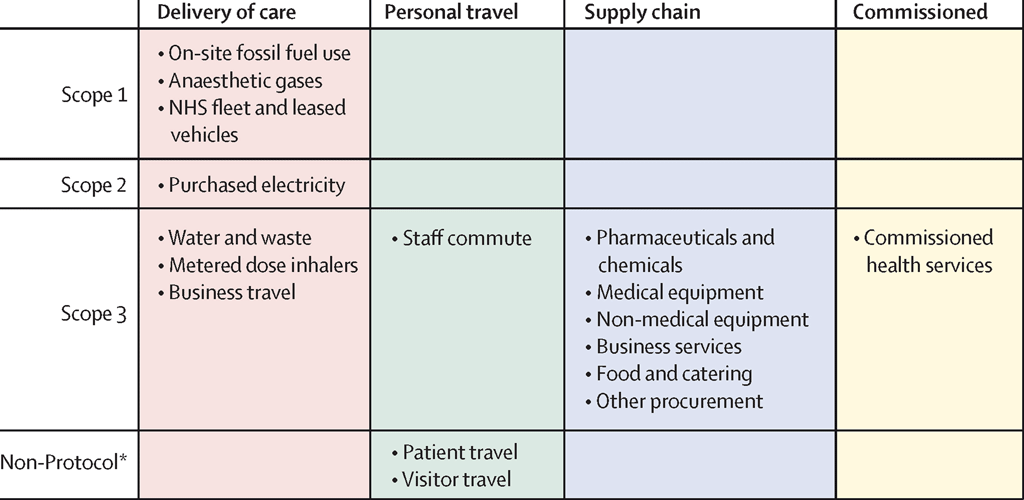
The protocol divides emissions into three categories, or “scopes”, which are shown in the figure below. Scope 1 covers emissions from direct emissions from owned or controlled sources; Scope 2 covers indirect emissions from purchased electricity, heat and cooling; and Scope 3 covers all other indirect emissions associated with an organisation’s operations. This last category includes everything from medical equipment to food and catering.
The NHS approach also incorporates patient and visitor travel, which it is not directly responsible for, but it can influence.
The method covers seven GHGs: carbon dioxide (CO2), methane (CH4), nitrous oxide (N2O), hydrofluorocarbons (HFCs), perfluorocarbons (PCFs), sulphur hexafluoride (SF6) and nitrogen trifluoride (NF3).
The NHS has adopted a hybrid model, which uses the wealth of monitoring “bottom-up” data available and combines it with data from classic “top-down” economic models. This modelling matches economic spend to the carbon intensity of different activities.
In this way, the approach combines the accuracy and adaptability of available data from monitoring and reporting efforts with the broad coverage of top-down carbon accounting.
In addition, this approach lends itself to the incorporation of new monitoring data as it becomes available. This last point is essential to measuring progress and assessing the impact of decarbonisation, as well as for breaking down the carbon footprint to the individual facility level.
The carbon footprint of the NHS in England
We estimate the carbon footprint of the NHS in England in 2019 at 25m tonnes of CO2 equivalent. This is roughly equivalent to the annual CO2 emissions of Sri Lanka.
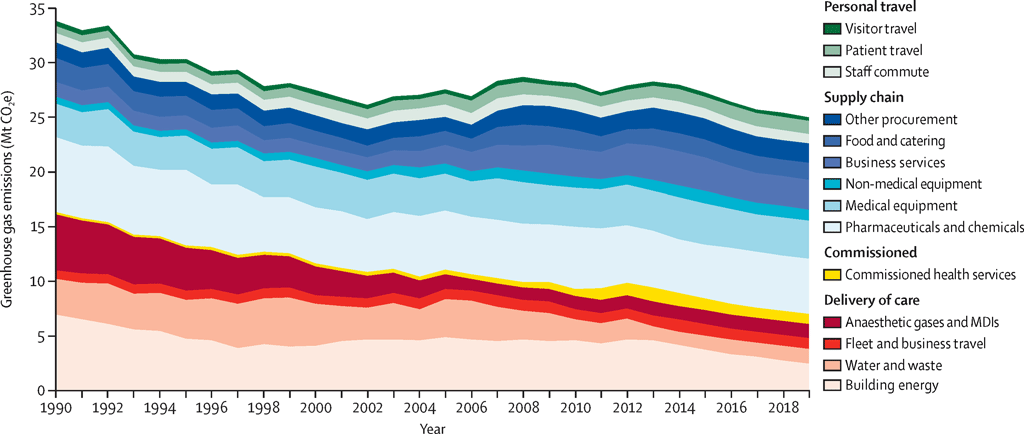
Although sizeable, this represents a 26% reduction from 1990 levels. This shift is mostly driven by a decarbonisation of the national electricity system, which has resulted in fewer emissions from running hospitals and other buildings. This can been seen via the pink shaded area in the chart below, which breaks down GHG by source.
At the same time, since 1990, the NHS provided increasingly complex health services – such as more sophisticated imaging technologies – and doubled its number of patients (measured as single inpatient admissions). In effect, the carbon intensity of NHS services on a per patient basis has decreased by 64% over the same time.
Of its total footprint, 24% derived from sources which the NHS can directly influence (“direct emissions”). These include its fleet and business travel, buildings, anaesthetic gases, prescribed metered dose inhalers (MDIs), waste and water, and electricity consumption.
However, most of its emissions derive from sources which the NHS has a little control over, including its supply chain (62%) – shaded blue in the chart above – and patient, visitor and staff travel (10%) – shaded green.
We also separated out the NHS carbon footprint by type of clinical activity, which further enables the identification of mitigation targets.
For example, providing “acute care” – which deals with short-term treatment for a severe injury or episode of illness, an urgent medical condition or during recovery from surgery – comprised more than half of the total footprint in 2019.
This makes it the most carbon-intensive care pathway, with 125kg of CO2e per day for hospitalised patients, and 76kg of CO2e per outpatient acute care appointment. The large carbon footprint is because acute care typically requires more medical equipment, protective equipment and other resources.
In contrast, “primary care” – the first point of contact in the healthcare system – is considerably less carbon intense. For example, a visit to a general practitioner produces an average of 66kg of CO2e.
Overall, primary care accounts for 23% of all emissions – mainly through its supply chain and the prescription of metered dose inhalers. It can also help even reduce the demand from health services through the delivery of preventive care.
A net-zero future for healthcare
Shifting to a net-zero health system presents unique challenges, requiring the reduction of emissions without compromising on healthcare quality.
Investing in the strengthening of primary, community and long-term care, as well as prioritising early disease detection and treatment can help achieve this. Through the combination of earlier and improved disease management, reduced times to patient discharge, patient empowerment and reduced need for acute care, the NHS can help minimise healthcare demand and resource consumption, deliver health gains, and lower costs.
Shifting to remote digital care whenever suitable can also drive emission reductions, as well as increase access to health and patient comfort. However, while remote delivery has accelerated during the Covid-19 pandemic, rollout plans will need to be closely accompanied by adequate access to digital technologies and digital literacy to avoid exacerbating inequalities.
In terms of reducing the carbon intensity of its activities, the NHS has the highest degree of control over its “direct emissions”. As laid out in its decarbonisation plan, mitigating building and energy emissions will require building upgrades, improved insulation and the implementation of sophisticated systems to control energy demand. In addition, shifting to lower-carbon energy sources and on-site renewable energy generation will deliver extra mitigation in these sectors.
The electrification of the NHS fleet, combined with active travel incentives and the use of public transport, will help mitigate travel-related emissions. These efforts could also improve public health through more physical activity and cleaner air.
The emissions of volatile anaesthetics and MDI propellants – both potent GHGs contributing to about 5% of all emissions from the NHS – can be reduced through waste management and efficient delivery, as well as shifts to low-carbon options whenever clinically suitable.
The biggest fraction of the NHS carbon footprint, however, is associated with supply chain emissions which the NHS has less control over.
That said, through implementation of green procurement guidance, the NHS can reduce consumption and promote shifts to low-carbon or reusable alternatives whenever these are available.
Moreover, as the biggest single healthcare system in the world, it can incentivise suppliers to decarbonise their own processes. Indeed, it has pledged that it will no longer purchase from suppliers that do not meet or exceed its own decarbonisation commitments by 2030 – a policy that has the potential to reduce supply chain emissions of other health systems around the world.
Our work reflects more than 10 years of analytical effort dedicated by the NHS to tracking its carbon footprint. We hope it will help guide other health systems in developing their own carbon accounting.
Tennison, I. et al. (2021) Health care's response to climate change: a carbon footprint assessment of the NHS in England, The Lancet Planetary Health, doi:10.1016/S2542-5196(20)30271-0