Guest post: How CMIP7 will shape the next wave of climate science
Multiple Authors
05.22.26Multiple Authors
22.05.2026 | 10:59amHundreds of scientists in dozens of institutions are embarking on the next phase of the world’s largest coordinated climate-modelling effort.
Climate-modelling groups use supercomputers to run climate models that simulate the physics, chemistry and biology of the Earth’s atmosphere, land and oceans.
These models play a crucial role in helping scientists understand how the climate is responding as greenhouse gases build up in the atmosphere.
For four decades, the Coupled Model Intercomparison Project (CMIP) has guided the work of the climate-modelling community by providing a framework that allows for millions of results to be collected together and compared.
The resulting projections are used extensively in climate science and policy and underpin the landmark reports of the Intergovernmental Panel on Climate Change (IPCC).
Now, the seventh phase of CMIP – CMIP7 – is underway, with more than 30 climate-modelling centres expected to contribute more than five million gigabytes of data – so much that downloading it using a fast internet connection would take two and a half years.
Here, we look at what is new for CMIP7, including its model experiments, updated emissions scenarios and “assessment fast track” process.
What is CMIP?
Around the world, climate models are developed by different institutions and groups, known as modelling centres.
Each model is built differently and, therefore, produces slightly different results.
To better understand these differences, CMIP coordinates a common set of climate-model experiments.
These are simulations that use the same inputs and conditions, allowing scientists to compare the results and see where models agree or differ.
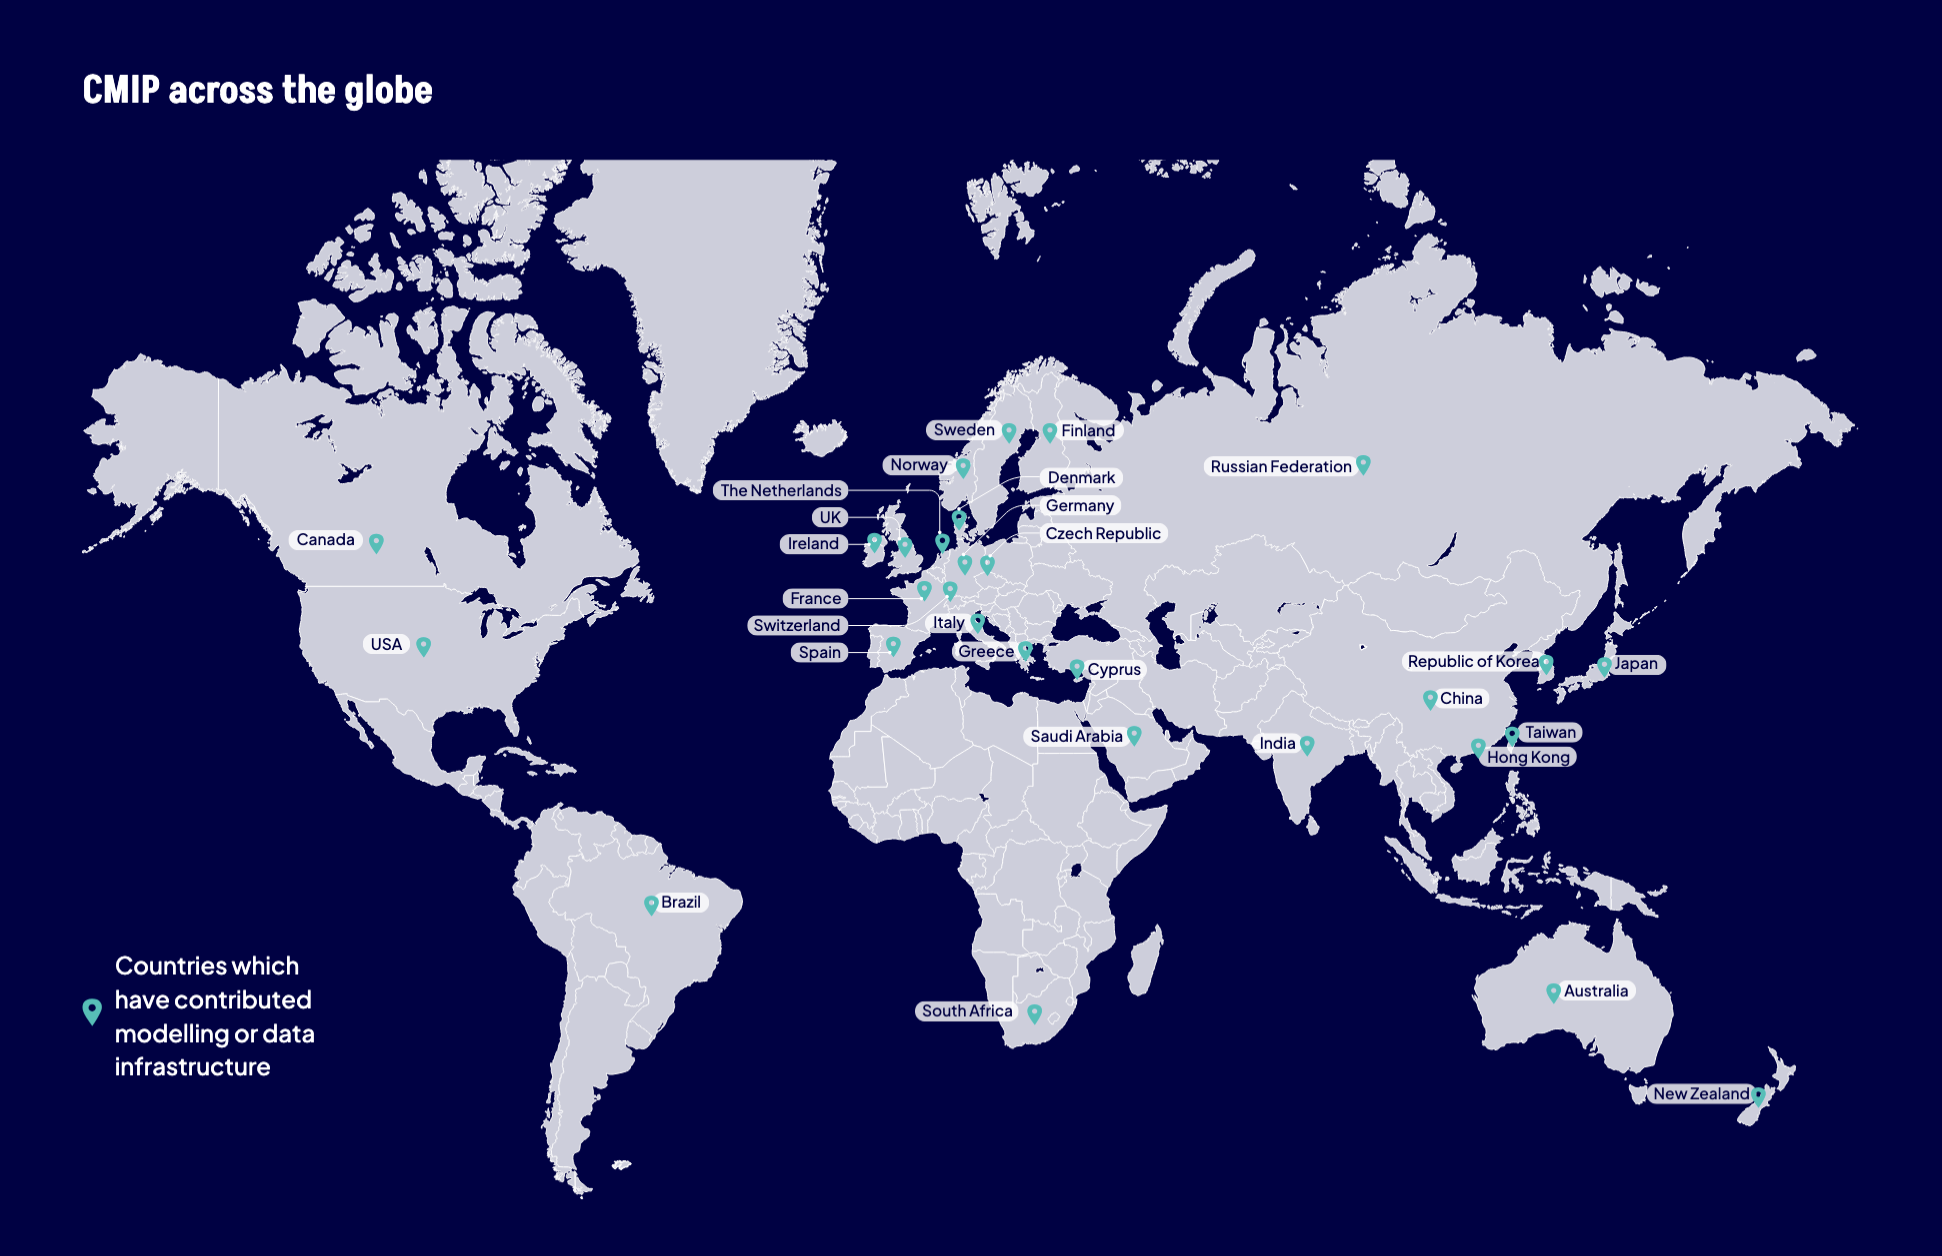
The figure below shows the countries that have either produced or published CMIP simulations.
During this time, scientists use new and improved models to run experiments from previous CMIP phases for consistency, as well as new experiments to investigate fresh scientific questions.
These simulations produce a trove of data, in the form of variables – such as temperature, rainfall, winds, sea ice extent and ocean currents. This information helps scientists study past, present and future climate change.
As scientific understanding and technical capabilities improve, models are refined. As a result, each CMIP phase incorporates higher spatial resolutions, larger ensembles, improved representations of key processes and more efficient model designs.
CMIP7 objectives
Each CMIP phase has an “experimental design” that outlines which climate-model experiments should be run and their technical specifications, including the time period the models should simulate.
The CMIP7 experimental design has several components.
As in CMIP6, for a modelling centre to contribute, they are asked to produce a suite of experiments that maintain continuity across past and future CMIP phases.
This suite of experiments is known as the “diagnostic, evaluation and characterisation of klima” (DECK) and is used to understand how their model “behaves” under simple, standard conditions. These experiments are designed and requested directly by CMIP’s scientific governing panel.
Alongside the DECK, CMIP also incorporates experiments developed by model intercomparison projects (MIPs) run by different research communities. For example, experiments exploring what the climate could look like under different levels of emissions or those that explore how sea ice might have changed between the last two ice-ages.
Currently, CMIP is working with 40 MIPs. These groups investigate specific scientific questions at their own pace, rather than on timelines prescribed by CMIP.
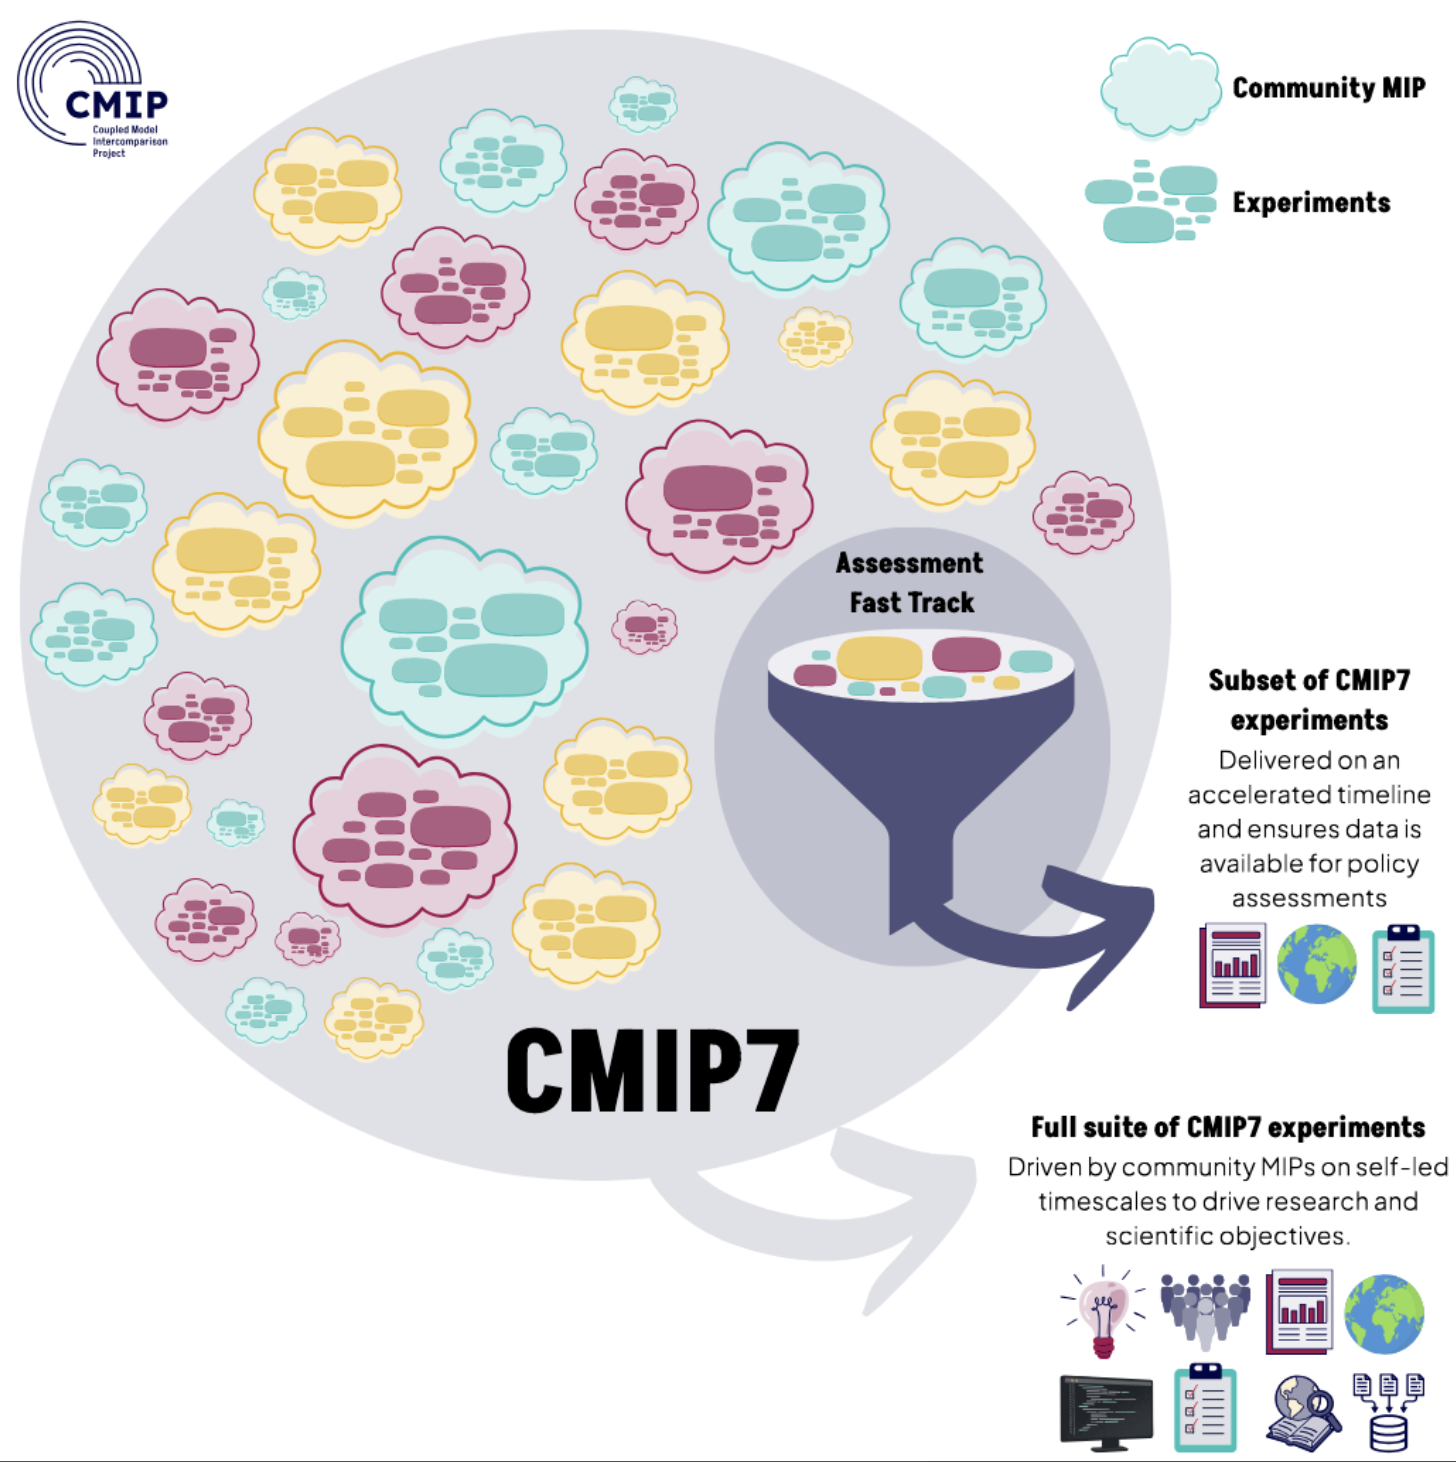
Running a large number of simulations can take modelling centres a long time. To speed up the process, CMIP7 has launched the “assessment fast track”.
This is a small subset of CMIP7 experiments, drawn from past and present community MIPs, identified through community consultation as being critical for scientific and policy assessments.
Data from the assessment fast track will be used in the reports that will together form the seventh assessment (AR7) of the IPCC.
It will also be used as an input by other groups that create climate information, including organisations involved in regional downscaling and modelling climate impacts and ice-sheet changes.
The figure below shows the different components of CMIP7. It shows how a subset of CMIP7 experiments will be delivered on an accelerated timeline, while the majority of experiments will be led by MIPs.
CMIP7 experiments
There are three categories of experiments set to take place in CMIP7:
- Historical experiments, which are designed to improve scientific understanding of past climates. Model runs exploring the recent historical period also allow scientists to evaluate the performance of models by checking how well they replicate real-world observations.
- Prediction and projection experiments, which allow scientists to analyse what different climates could look like under varying levels of greenhouse gas emissions, as well as near-term (10-year) prediction experiments.
- Process understanding experiments, which are designed to better understand specific processes and isolate cause-and-effect relationships. For example, a set of experiments might change the emissions of one greenhouse gas at a time to see how much each pollutant contributes to warming or cooling the climate.
Modelling centres typically produce and publish their data for the historical and projection experiments first.
CMIP expects the first datasets to be available by this summer, with broader publication recommended by the end of the year, in time to be assessed by IPCC AR7 authors.
Drafting of the reports of AR7 is currently underway. However, countries are yet to agree on the timeline for when they will be published. This presents a challenge for the climate-modelling community, given the difficulties of working with a moving deadline.
(For more on the ongoing standoff between countries around the timing of publication of the reports, read Carbon Brief’s explainer.)
New emissions scenarios
Scientists use emissions scenarios to simulate the future climate according to how global energy systems and land use might change over the next century.
Crucially, these scenarios – also known as “pathways” – are not forecasts or predictions of the future.
The group tasked with designing the scenarios for CMIP phases, as well as producing the “input files” for climate models, is the “scenario model intercomparison project”, or ScenarioMIP.
In a new paper, the group has set out the new set of scenarios for CMIP7:
- High (H): Emissions grow to as high as deemed plausibly possible, consistent with a rollback of current climate policies. This scenario will result in strong warming.
- High-to-low (HL): Emissions rise as in the high scenario at first, but are cut sharply in the second half of the century to reach net-zero by 2100.
- Medium (M): Emissions consistent with current policies, frozen as of 2025, leading to a moderate level of warming.
- Medium-to-low (ML): Emissions are slowly reduced, eventually reaching net-zero emissions by the end of the century.
- Low (L): Emissions consistent with likely keeping warming below 2C and not returning to 1.5C before the end of the century.
- Very low (VL): Emissions are cut to keep temperatures “as low as plausible”, according to the paper. This scenario limits warming to close to 1.5C by the end of the century, with limited overshoot beforehand.
- Low-to-negative (LN): Emissions fall slightly slower than in the VL scenario, with temperatures just rising above 1.5C. Emissions then rapidly drop to negative to bring warming back down.
The figures below show the emissions (left) and the estimated global temperature changes (right) under the seven new scenarios for CMIP7, from the low-to-negative emissions scenario (turquoise) to a high-emissions scenario (brown).
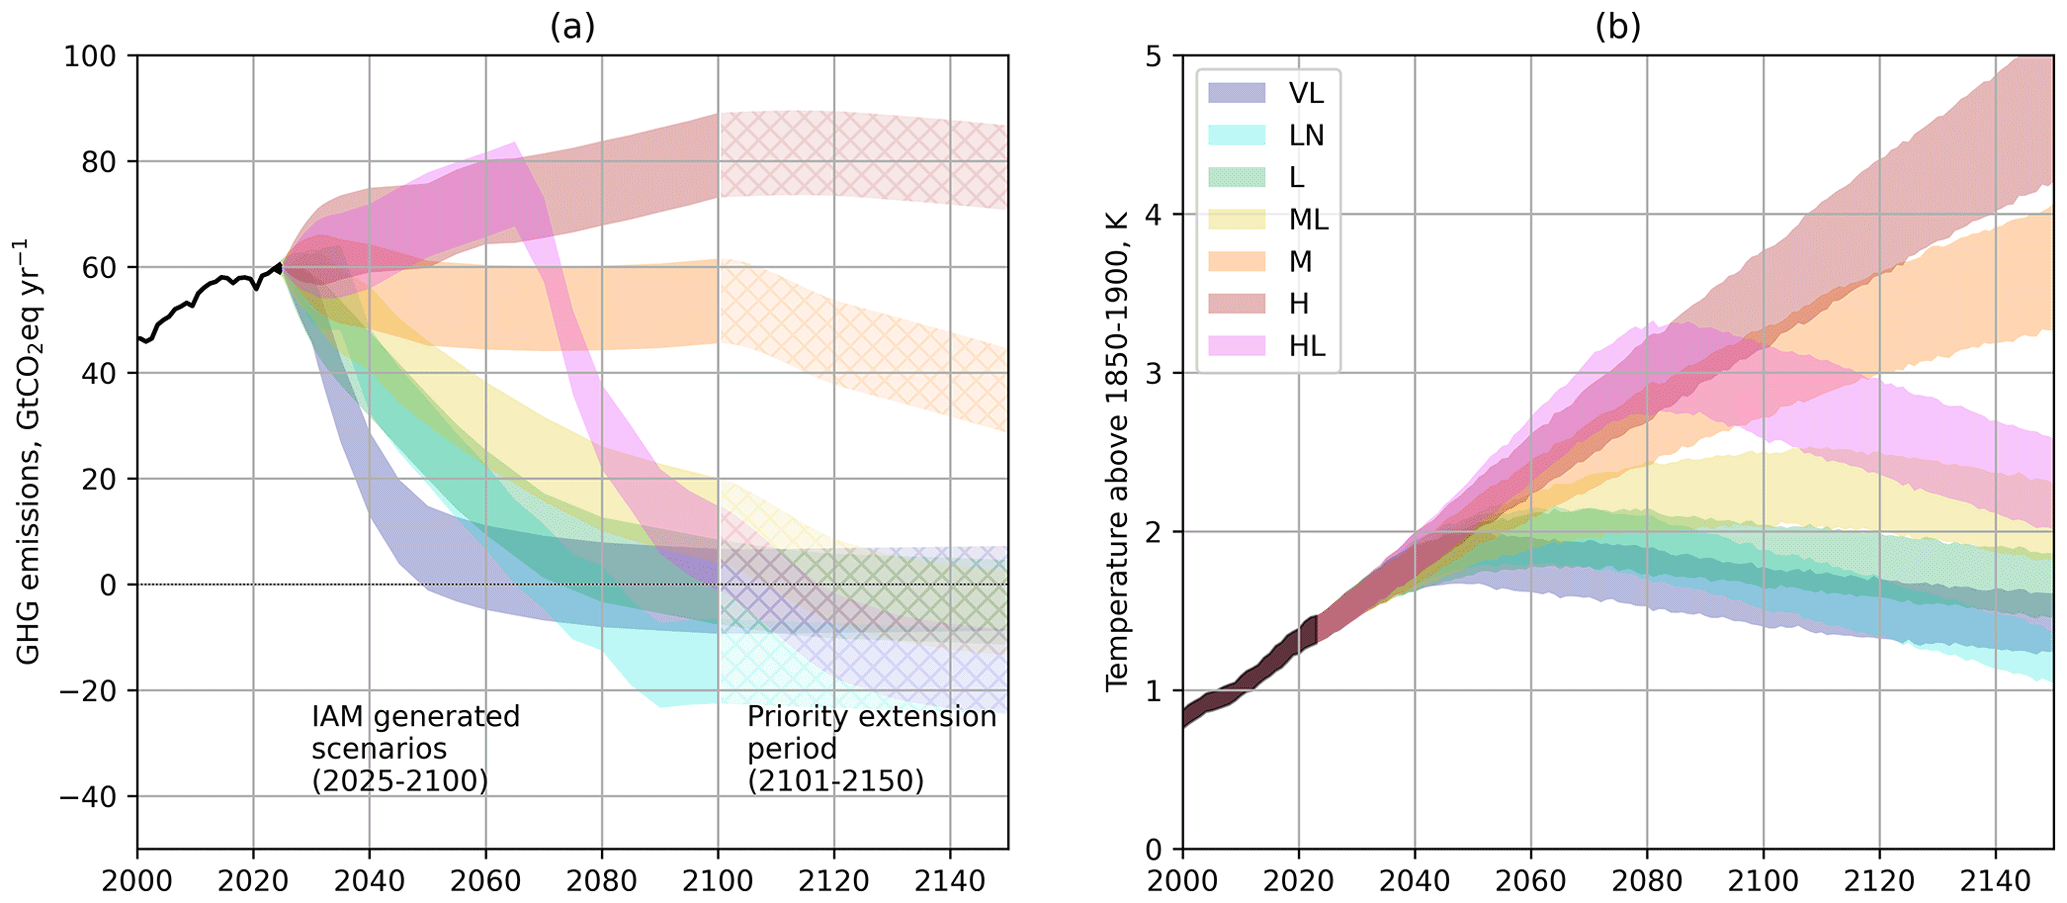
As a set, the ScenarioMIP scenarios “cover plausible outcomes ranging from a high level of climate change (in the case of policy failure) to low levels of climate change resulting from stringent policies”, the paper says.
Compared to the scenarios in CMIP6, the range in future emissions they cover is now narrower, the authors say:
“On the high-end of the range, the CMIP6 high emission levels (quantified by SSP5-8.5) have become implausible, based on trends in the costs of renewables, the emergence of climate policy and recent emission trends…At the low end, many CMIP6 emission trajectories have become inconsistent with observed trends during the 2020-30 period.”
Put simply, progress on climate policies and cheaper renewable technologies means that scenarios of very high emissions have now been ruled out.
However, this progress has not been sufficient to keep society on track for the Paris Agreement’s 1.5C goal. The paper notes that, “at this point of time, some overshoot of the 1.5C seems unavoidable”.
[The change to the high end of the scenarios has sparked misleading commentary in the media and on social media – even from US president Donald Trump. A Carbon Brief factcheck unpacks the debate.]
Also notable in the new scenarios is the “low-to-negative” pathway, which has the explicit feature of emissions becoming “net-negative”. In other words, through carbon dioxide removal (CDR) techniques, society reaches the point at which more carbon is being taken out of the atmosphere than is being added through greenhouse gas emissions.
Reaching net-negative emissions is fundamental to “overshoot scenarios”, where global warming passes a target and then is brought back down by large-scale CDR.
Overshoot scenarios allow scientists and policymakers to investigate the impacts of a delay to emissions reductions and better understand how the world might respond to passing a warming target. This includes the question of whether some impacts of climate change, such as ice sheet melt, are reversible.
CMIP has encouraged modelling centres to run simulations using the “high” and “very low” scenarios first to ensure downstream users of the data – including groups working on regional climate projections (CORDEX), climate impacts modelling (ISIMIP) and ice-sheet modelling (ISMIP) – have enough time to produce their data for IPCC reports.
These two scenarios were selected as they sit at opposite ends of the spectrum of climate outcomes. The high scenario will demonstrate how models behave under high emissions, while the very low scenario will demonstrate how models behave when emissions are rapidly reduced.
CMIP has recommended that modelling centres then run the “medium” and “high-to-low” scenarios. The remaining scenarios should then follow and no official recommendation has been made yet on their production order.
Other new features
In addition to the assessment fast track and new scenarios, CMIP7 has a number of other new developments.
Updated data for simulations
Climate models use input datasets to define the set of external drivers – or “forcings” – that have caused the global warming observed so far. These drivers include greenhouse gases, changes to incoming solar radiation and volcanic eruptions.
CMIP recommends modelling groups use the same input datasets, as this makes it easier to compare model results.
In CMIP7, the historical forcing datasets available for modelling groups to use have been improved to better represent real-world changes and extended closer to the present day. The historical simulations will be able to simulate the past climate from 1850 through to the end of 2021, whereas CMIP6 only simulated the past climate through to 2014.
CMIP is also planning to extend these historical datasets through to 2025 and maybe further throughout the course of CMIP7.
Emissions-driven simulations
CMIP7 introduces a new focus on CO2 emissions-driven simulations, providing a more realistic representation of how the climate responds to changes in emissions.
In older generations of climate models, atmospheric levels of CO2 and other greenhouse gas concentrations have been needed as an input to the model. These levels would be produced by running scenarios of CO2 emissions through separate carbon cycle models. The resulting climate-model runs were known as “concentration-driven simulations”.
However, many of the latest generation of models are now able to run in “emissions-driven mode”. This means that they receive CO2 emissions as an input and the model itself simulates the carbon cycle and the resulting levels of CO2 in the atmosphere.
This development is important, as climate policies are typically defined in terms of emissions, rather than overall atmospheric concentrations.
This new development in modelling will enable a more realistic representation of the carbon cycle and a better understanding of how it might change under different levels of warming.
Enhanced model documentation and evaluation
All CMIP7 models will be required to supply standardised model documentation that ensures consistency across model descriptions and makes it easier for end users to understand the data.
Additionally, CMIP scientists have developed a new open-access tool that dramatically speeds up the evaluation of climate models.
This “rapid evaluation framework” allows researchers to compare model outputs with real-world observations, providing immediate insight into model performance.