Guest post: How the Greenland ice sheet fared in 2019
Multiple Authors
09.06.19Dr Ruth Mottram, Dr Martin Stendel and Dr Peter Langen are climate scientists at the Danish Meteorological Institute (DMI) in Copenhagen, which is part of the Polar Portal. Dr Andreas Ahlstrøm and Dr Kenneth D. Mankoff are chief research consultant and senior scientist at the Geological Survey of Denmark and Greenland, respectively.
As the end of August sees summer shift into autumn for the northern hemisphere, it also marks the end of the melt season for the Greenland ice sheet.
The advent of a new season is the traditional time for our annual look back at the year gone by and what it tells us about the state ice sheet.
Our estimates show that the surface of the ice sheet gained 169bn tonnes of ice over 2018-19 – this is the seventh smallest gain on record.
And using new satellite data, we show that – once all ice sheet processes are factored in for the past year – the Greenland ice sheet saw a net decline of 329bn tonnes in ice.
Surface processes
While western calendars show another four months before a new year, scientists generally consider the beginning of September as the start of a new annual cycle for the Greenland ice sheet.
This yearly pattern sees the ice sheet largely gain snow from September, accumulating ice through autumn, winter and into spring. Then, as the year warms up into late spring, the ice sheet begins to lose more ice through surface melt than it gains from fresh snowfall. This melt season generally continues until the end of August.
The contrast between snow gains and ice losses at the surface over the whole year is known as the “surface mass balance” (SMB). The chart below shows the SMB for 2018-19 on individual days (top) and cumulatively across the year (bottom). The blue lines show 2018-19 data and the grey line shows the long-term average. The lower chart also shows the record low year in 2011-12 (red line) for comparison.
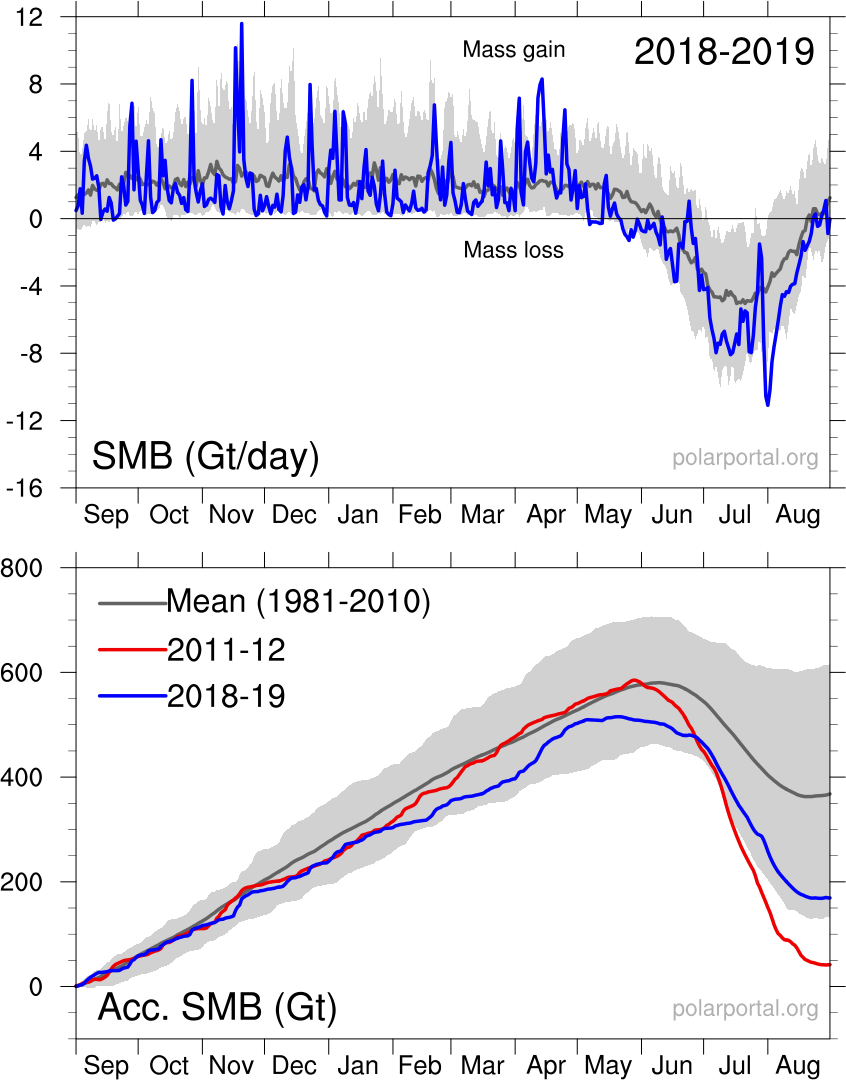
Daily (upper chart) and cumulative (lower) surface mass budget of the Greenland ice sheet, in billion tonnes per day, and billion tonnes, respectively. Blue lines show 2018-19 SMB year; the grey lines show the 1981-2010 average; and the red line in lower chart shows the record low SMB year of 2011-12. Credit: DMI Polar Portal.
This year has been an unusual one. It has been consistently drier than normal, which is reflected in the below-average gains in snow throughout the year. And the summer has been warm with some periods of very high melt.
Overall, while the 2016-17 and 2017-18 seasons saw above-average gains in ice at the surface, the SMB in 2018-19 ends as the seventh lowest on record. The total accumulated SMB was only 169bn tonnes at the end of the year. This means that nine of the Top 10 lowest SMB years have occurred in the last 13 years in our record that goes back to 1981.
Total losses
It is important to remember that SMB is always positive at the end of the year – more snow falls on the ice sheet than melts at the surface. But the ice sheet also loses ice by the breaking off, or “calving”, of icebergs and from ocean melting at its edge. Therefore, the extra snowfall is needed in order to compensate for these processes.
Observations collected by the European Space Agency’s Sentinel-2 satellite measure ice velocity of outlet glaciers around the edges of the ice sheet. By measuring how quickly the ice moves into the ocean we can work out how much ice is being lost by calving and ocean melting.
On average between 1986 and 2018, the ice sheet discharges about 462bn tonnes per year. This year our analysis suggests Greenland discharged around 498bn tonnes of ice.
Factoring in these additional processes, we can calculate the total mass budget for the ice sheet for the year. For 2018-19, we estimate the ice sheet has seen a total net ice loss of around 329bn tonnes.
Data from the GRACE satellites indicate that Greenland lost an average of approximately 260bn tonnes of ice per year between 2002 and 2016, with a peak of 458bn in 2012. Clearly, the loss of 329bn tonnes we estimate this year is significantly above the 260bn tonne long-term average, but we have not broken the highest record for ice loss in a year.
Long, dry summer
The high losses this year were from a combination of factors. The SMB year started in September 2018 with a long dry period – a much drier than usual winter over most of Greenland (only the south-east had more snow than usual). This left the ice sheet with only a thin protective cover that melted quickly in the lower areas when the melt season got going on the 30 April.
In fact, 2019 saw the second earliest start to the melt season on record – after 2016 – when an unusual spike in melting occurred in early April. The summer that followed was very long, dry and warm, with substantial melting all over the ice sheet and especially in the west and north.
The map below shows how the SMB at the end of the 2018-19 season compared with the long-term average. The shading indicates higher (blue) and lower (red) gains in ice than usual over the year. You can see that the majority of the ice sheet gained less ice than average.
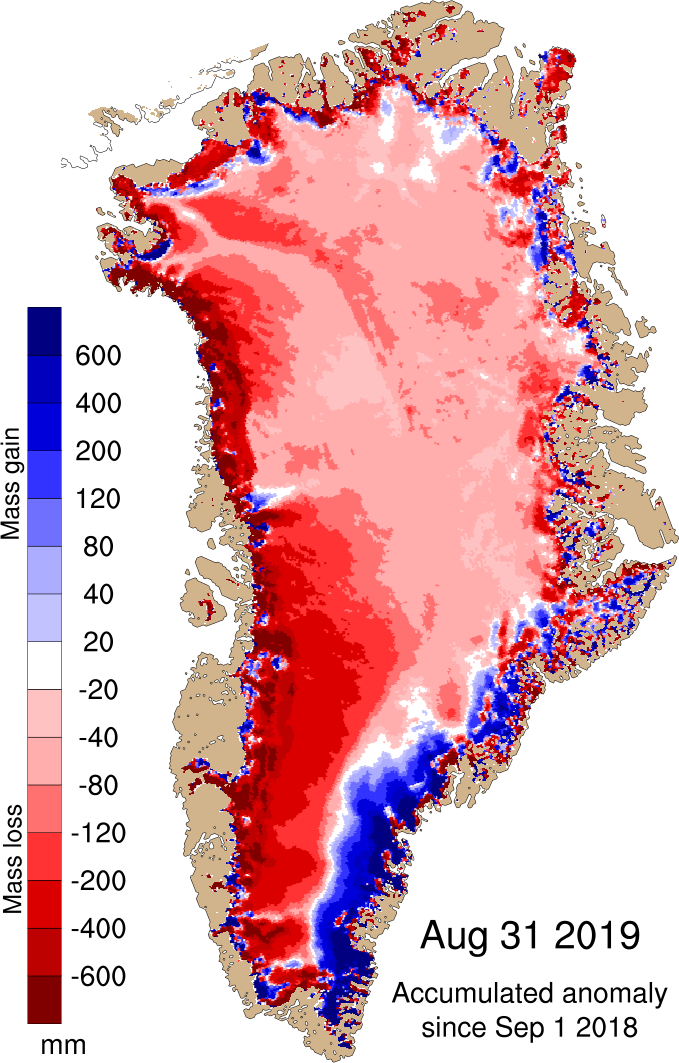
Map showing the difference between the annual SMB in 2018-19 and the 1981-2010 period (in mm of ice melt). Blue shows more ice gain than average and red shows more ice loss than average. Credit: DMI Polar Portal.
Weather stations in the Programme for the Monitoring of the Greenland Ice sheet (PROMICE) network recorded ice loss rates in excess of the 2008-18 average at every one of its 21 locations across the ice sheet.
We saw large losses in north-west Greenland, for example. Weather stations managed by the Danish Meteorological Institute (DMI) – which are located off the ice sheet, but with longer records – also showed well above average temperatures at all locations in June and July (August data is still being quality controlled).
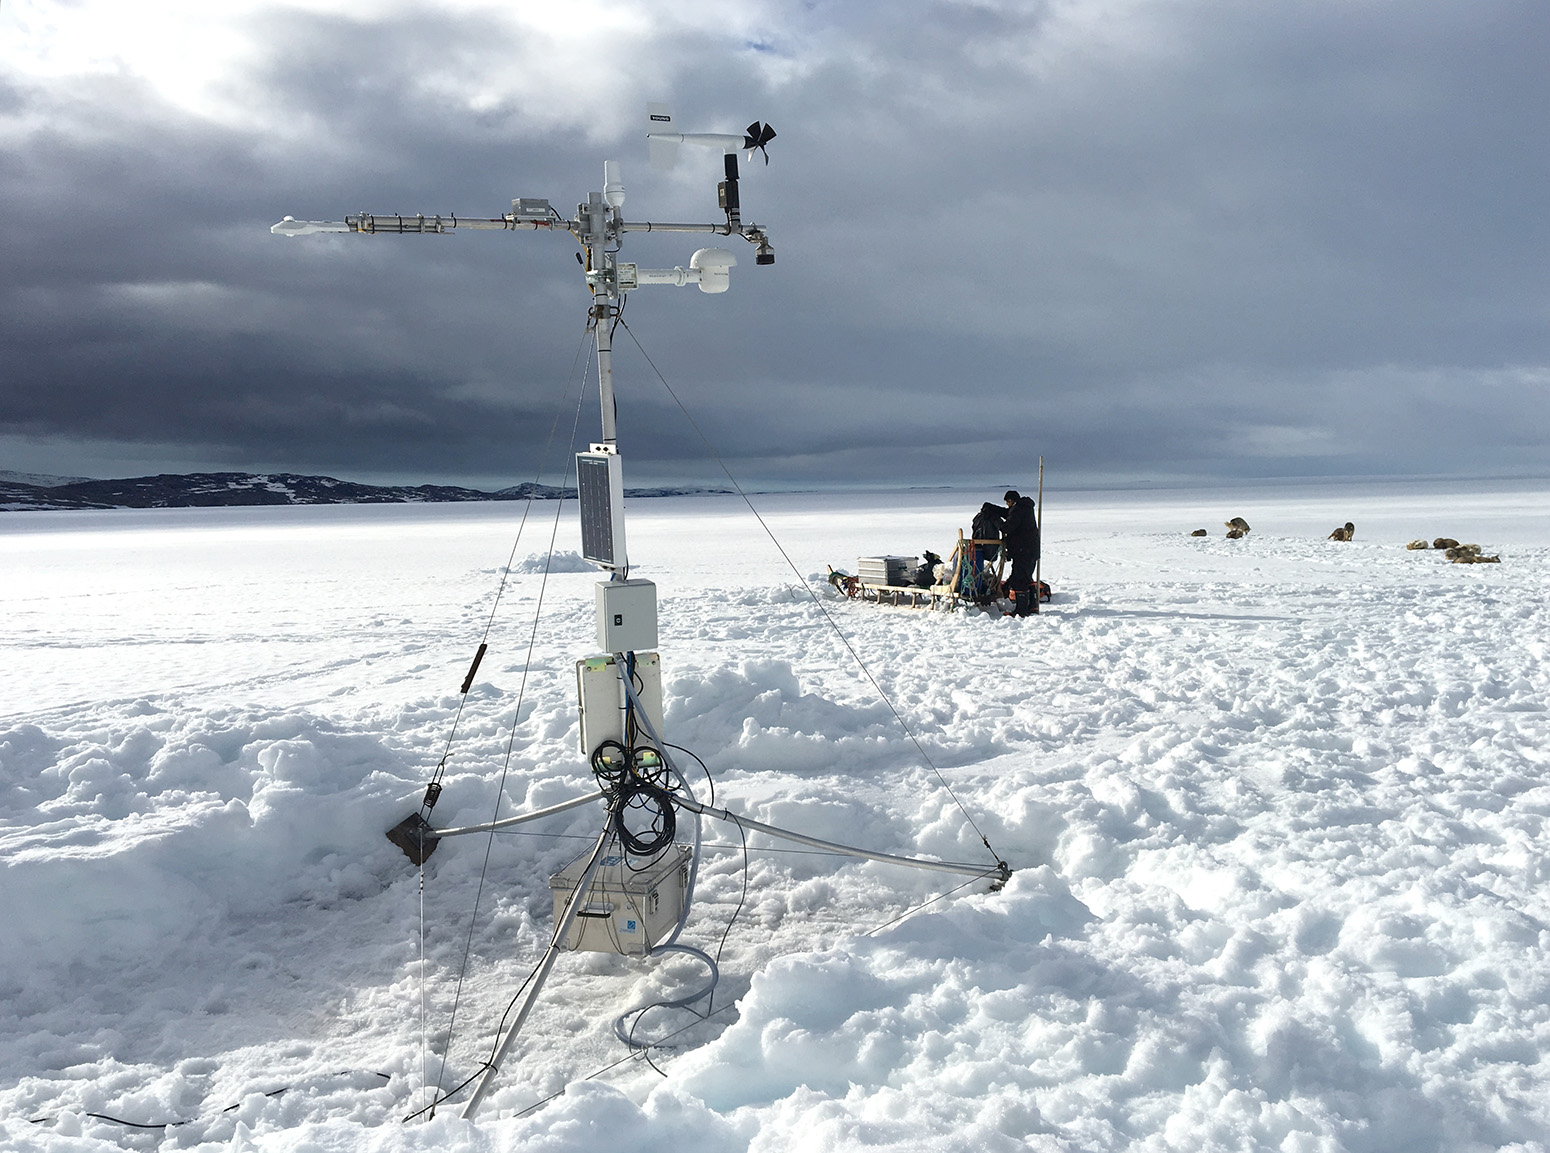
Automatic weather station at TAS-L near Isortoq in SE Greenland 3 May, 2019. Credit: Photo: Andreas Ahlstrøm, GEUS
Melt spike
The effects of the long warm summer were boosted in early June and again at the end of July by waves of warm air passing over the ice sheet and giving an extra push to the melt season.
At the peak of the second heatwave, our model calculated that the Greenland ice sheet lost 31bn tonnes of ice – equivalent to about 0.1mm of global sea level rise – in the three days from 31 July to 2 August. An average day during that period would see around five billion tonnes of ice melt.
You can see this spike in melt in the chart below, which shows the percentage area of the ice sheet that is melting on each day of the 2019 calendar year so far (blue line). It peaked this year at 58% on 1 August. The map above it shows the areas of the ice sheet melting on this day (shaded red).
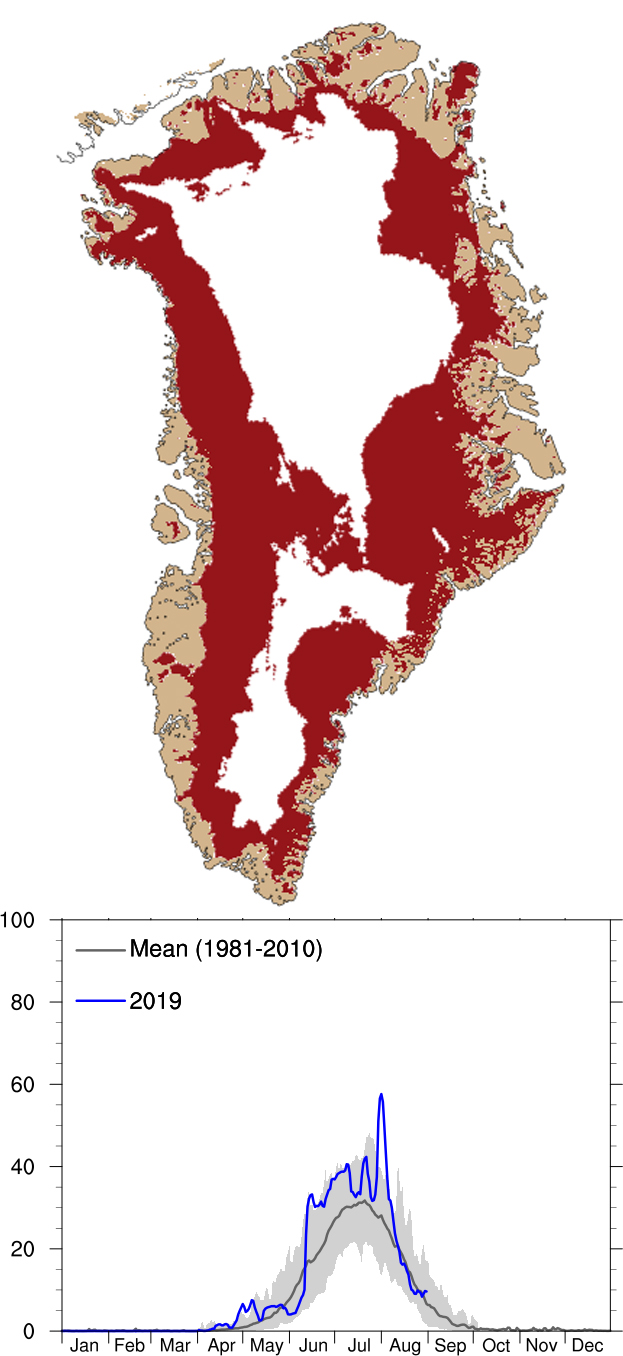
Top: Map showing areas of Greenland undergoing surface melt on 1 August 2019 (shaded red). Bottom: Chart showing percentage of ice sheet area seeing surface melt on each day of 2019 (blue line). The grey line shows the 1981-2010 average. Credit: DMI Polar Portal.
For comparison, the record summer melt season of 2011-12 had several similar large heatwaves – although these were more extreme with a larger surface area being affected and even higher peak temperatures at the ice sheet summit.
However, 2018-19 was another year – and only the seventh occasion in a record going back 2,000 years – where surface melt was recorded at the summit. It really is very unusual to see melting at the summit.
Negative phase
The long dry summer experienced this year was partly down to a very persistent negative phase of the North Atlantic Oscillation (NAO), but was also boosted by the underlying human-caused warming of the global climate.
The NAO is a source of variability over the Atlantic Ocean. It is characterised by a pattern of high atmospheric pressure over the Azores and low pressure over Iceland. The relative strengths of these two pressure systems drives the path of storms across the Atlantic. The NAO is therefore particularly important for northern Europe weather: a positive NAO generally brings mild, rainy, windy and grey weather – particularly in winter – while a negative index generally drives storms further south.
As well as steering rain and snow away from Greenland, a negative NAO also generally brings clear skies and few or thin clouds that helps to promote high melt rates. Several studies in recent years have shown how important the negative NAO is for high melt summers in Greenland. And in a new paper this year, we show that the past few lower melt summers – which resulted in a deceleration in ice loss from Greenland – were largely due to more positive NAO months.
However, we emphasised in that study that we cannot expect a positive NAO every summer and the background warming of the planet emphasises the negative years more, as indeed the persistent negative NAO this summer has shown.
Given that the annual SMB in any given year is very much a response to individual weather events, and the NAO index plays a large role in steering this, it is important that global climate models capture it correctly.
Unfortunately, while they mostly do a reasonable job, only a few of the current generation models – run as part of the CMIP5 project that fed into the fifth assessment report of the Intergovernmental Panel on Climate Change (IPCC) in 2013 – seem able to show the kind of persistence in negative or positive NAO patterns that we observe.
In turn, this means that CMIP5 global climate models tend to underestimate the amount of melt likely to occur at present or in the future. It remains to be seen whether the updated models in CMIP6 – which will feed into the IPCC’s sixth assessment report in 2021 – will perform better.
Surface albedo
To understand why and how the NAO directly contributes to ice sheet melt requires understanding of how we and other scientists actually calculate SMB.
In the past, estimates based on rainfall gauges and temperature observations – usually from weather stations near but not actually on the ice sheet – were made and then extrapolated over a wider area. These days we use a physical approach known as a “surface energy budget method”. This involves adding up all the incoming and outgoing energy for the ice sheet surface – with the difference between them giving an estimate of how warm the surface is.
One of the key influences on the outgoing energy is how much sunlight is reflected by the bright white snow on top of the ice sheet – a measure known as “albedo”. This summer has seen record lows of albedo – which means the surface is reflecting energy much less than average over large areas.
This is due to the long melt season allowing dust and sediment to accumulate on the surface and acting as ideal growing conditions for the dark-coloured algae and bacteria that we now know contribute significantly to darkening the ice sheet surface every summer. This means that clear skies and large amounts of sunlight – a characteristic of a negative NAO – will significantly increase the amount of melting.
Update: This article was updated on 13/09/2019 to note that 2018-19 was only the seventh occasion on record with surface melt at the summit, rather than ninth.