Guest post: How will climate change’s warming pattern look in the future?

Dr Andrew King
04.24.19Dr Andrew King
24.04.2019 | 11:35amDr Andrew King is lecturer in climate science at the School of Earth Sciences and ARC Centre of Excellence for Climate Extremes at the University of Melbourne.
The world has not warmed evenly as the climate has changed over the past century. After about 1C of human-induced global warming, we observe that regions such as the Arctic and most land areas have warmed more quickly than the global average, while many ocean regions have only warmed a little.
But should we expect the world to continue to warm under these patterns? Or could the patterns change because of local “nonlinear” changes with warming speeding up in some places and slowing down in others?
Previously, studies have examined whether “pattern scaling” – the assumption that the pattern of warming remains the same – is expected to hold under future warming scenarios. Some, for example, have concluded that under near-term warming, pattern scaling is a reasonable approach.
However, some individual climate models show substantial departures from scaling in some areas of the world, such as East Asia. In these models and locations, an accelerated or decelerated increase in local temperature may occur as the global temperatures rises.
How and why the pattern of warming may change as the world warms up has not been fully investigated previously. In my study, published in Environmental Research Letters, I examine this question by considering how local temperatures are expected to change in different models at possible future levels of global warming: 1.5C, 2C, 2.5C, 3C, and 3.5C above pre-industrial levels.
Local warming
Overall, as global temperatures continue to rise, accelerated local warming is more likely over continental land regions and during the summer season.
Unfortunately, this suggests that under further global warming summer heatwaves could be worse than may otherwise be expected. In contrast, over many ocean regions, local temperatures are expected to warm more slowly per degree of global warming than they have to date.
The accelerated and decelerated warming seen in some locations is partly associated with rainfall changes. The climate models that project the strongest acceleration in local warming – in places such as Central Europe in summer – also tend to project decreases in rainfall. In these regions, rainfall and temperature projections are inextricably linked. Here, models with drying trends also have less cooling associated with evaporation and this results in accelerated warming.
The map below shows the relationship between the nonlinearity in local temperatures and the change in rainfall for the northern hemisphere summer. Negative correlations shaded brown indicate models that dry out also tend to have accelerated local warming compared with other models.
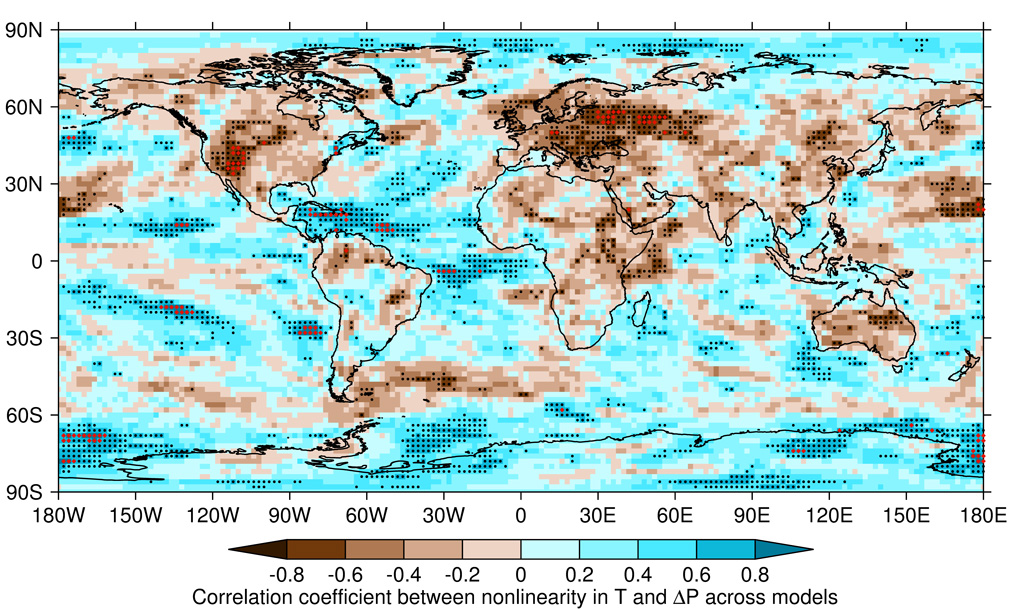
Map shows the correlation between climate models’ nonlinear change in local temperature and change in local precipitation from 1.5C to 3.5C of global warming in boreal summer. Areas in brown show drying is associated with accelerated local warming whereas areas in blue show accelerated local warming is linked with increased rainfall. Black stippling indicates statistical significance at the 5% level and red dots indicate a field significance criterion is also met. Adapted from Figure 2a of King (2019).
Over many ocean regions, the reverse relationship is true, whereby accelerated local warming is associated with an increase in rainfall – indicated by blue shading on the map. In these areas there is an abundant supply of moisture so locally accelerated warming results in increased capacity for the atmosphere to hold moisture – known as the “Clausius-Clapeyron relationship” – and a tendency for increased rainfall as a result.
What does this mean for regional climate projections?
So why is it important we understand nonlinear local climate change? Climate policy is built around the use of global warming limits – such as 1.5C and “well below” 2C above pre-industrial levels in the Paris Agreement. But if models project different warming patterns that could mean very different possible regional climates in a future warmer world.
As a case study, I investigated what this means for northeast Australia in more detail. This is a region with high uncertainty in rainfall projections during the southern hemisphere summer.
In northeast Australia, some models project a slower pace of warming and other models an acceleration in warming. The models which dry out more tend to exhibit accelerated warming and vice versa.
I put the models into two groups: one with drying relative to the multi-model average and another group which is wetter than the ensemble average. The models which dry out on average tend to have warmer summers in future and an increased probability of extreme hot summers compared with the models where rainfall increases in the region.
The chart below shows the probability of having a hot summer in northeast Australia in the two sets of models, with drier models in brown and wetter models in blue. A “hot” summer is defined as exceeding the current summer temperature record.
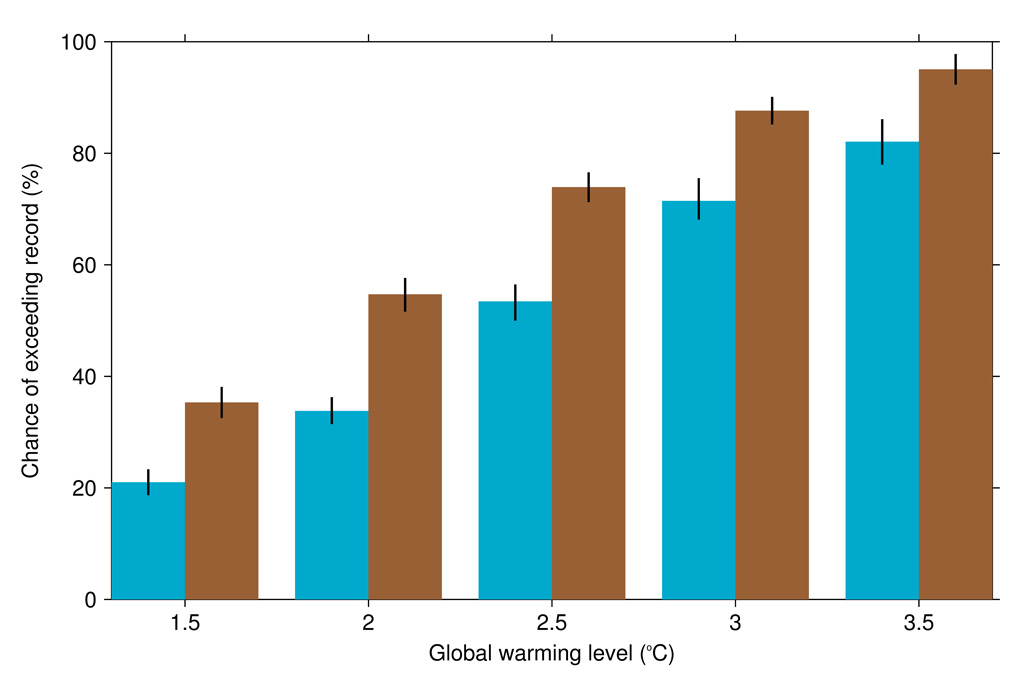
The probability in a given year of exceeding the current summer temperature record in northeast Australia under different levels of global warming in the drying model set (brown) and the wetting model set (blue). The vertical black lines show 90% confidence intervals. Adapted from Figure 4g in King (2019).
The chart reveals that the difference between the dry model set and the wet model set in the hottest summer temperatures is roughly equivalent to the difference due to half a degree of global warming.
In the past, pattern scaling has often been used to investigate what future warmer climates might look like. This study finds that, for some regions of the world, pattern scaling may not be suitable. In regions of strong or highly uncertain rainfall changes, pattern scaling is less likely to be an effective method for climate projections.
There is the potential for accelerated local temperature change as the global temperature rises and this is more likely in land locations that get drier. This could exacerbate extreme summer heat in areas such as Central Europe where previous research has highlighted the effect of dry soils on the occurrence of heatwaves.
As the world warms, the pattern of local warming may change slightly and this would mean some regions will experience the brunt of further climate change while others are less severely affected.
-
Guest post: How will climate change’s warming pattern look in the future?
-
Guest post: How will the warming pattern of climate change look in the future?