Guest post: What 13,500 citations reveal about the IPCC’s climate science report
Multiple Authors
03.16.23Multiple Authors
16.03.2023 | 5:12pmIn August 2021, the Intergovernmental Panel on Climate Change (IPCC) published their long-anticipated report on the “physical science basis” for climate change.
The report concluded that climate change is “unequivocally” caused by humans and already affecting every region on our planet. These findings were reported around the world, drawing international attention.
The mammoth 2,500-page document brings together an enormous volume of peer-reviewed literature to provide the most up-to-date summary of climate science yet published. Every statement in the report is backed up by authoritative sources.
Altogether, the report boasts a staggering 13,500 citations.
Our analysis explores which citations were included in the report and reveals a surprisingly broad and diverse range of topics.
However, it also shows that citations in the report are heavily dominated by the global north and commonly sit behind a paywall.
We found that 99.95% of the cited references were written in English and three-quarters of all literature cited in the report featured at least one author based in either the US or the UK.
When and where?
The IPCC’s report on climate science – known as the Working Group I (WG1) report – is the first section of the three-part sixth assessment report (AR6). Hundreds of scientists spent years assessing the existing literature on climate change to produce this report, which will form the cornerstone of climate science for the years ahead.
The report was followed by two other instalments on the impacts, adaptation and vulnerabilities of climate change and the mitigation of climate change, released in February and March 2022, respectively. The AR6 will conclude with a synthesis report, released next week.
The AR6 WG1 report is an update from the fifth assessment cycle (AR5) WG1 report, which was published in 2013. Authors of the new report were encouraged to focus on providing an update since the last cycle, explaining the advances in climate science, how the confidence of findings had changed or strengthened and what new topics had emerged since AR5.
We found that 98.5% of citations in the AR6 WG1 report were published since the year 2000 and 85% of were published after the release of the AR5 in 2013. The chart below shows how many citations were published every year over 2000-21.
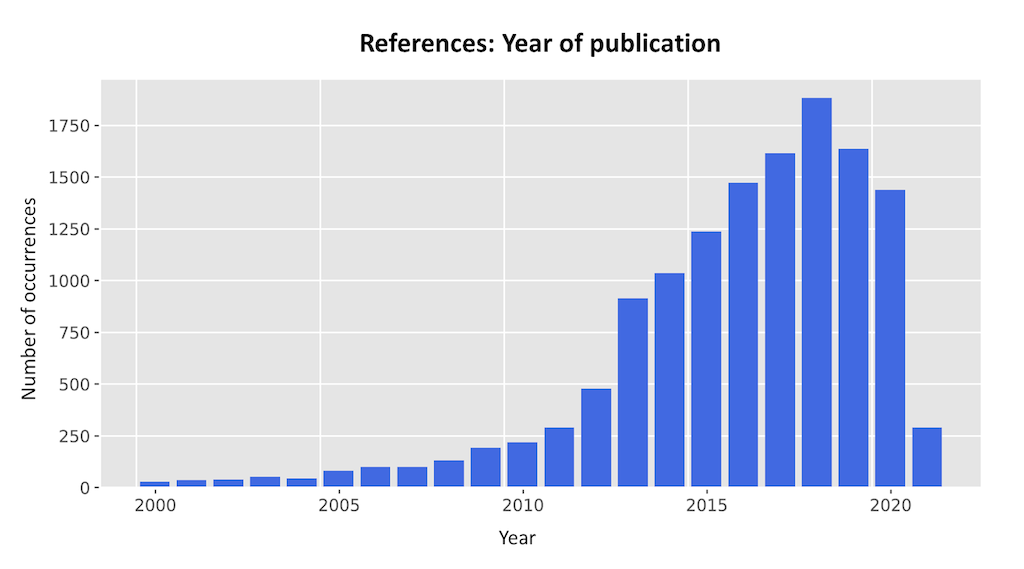
We found that 290 (2%) of references are from January 2021, reflecting a push from the scientific community to get papers accepted for publication before the report’s literature cut-off date on 31 January 2021.
The oldest citation – “An historical account of the trade winds, and monsoons, observable in the seas between and near the Tropics, with an attempt to assign the physical cause of the said winds” – was published by English astronomer and mathematician Edmond Halley in 1686.
We also analysed where the authors of each paper were based at the time of its publication. In total, the 13,500 citations have around 39,000 unique authors. However, many authors co-authored more than one of the cited papers, and this number jumps up to almost 130,000 names when these duplicates are counted.
The dominance of the global north among the citation authorship is stark. While 185 countries are represented across the citations, we estimate that more than 80% of authors are based in the global north. The map below illustrates this with a subset of papers published between 2011 and 2020. The number in each bubble shows the number of authors based in that country.
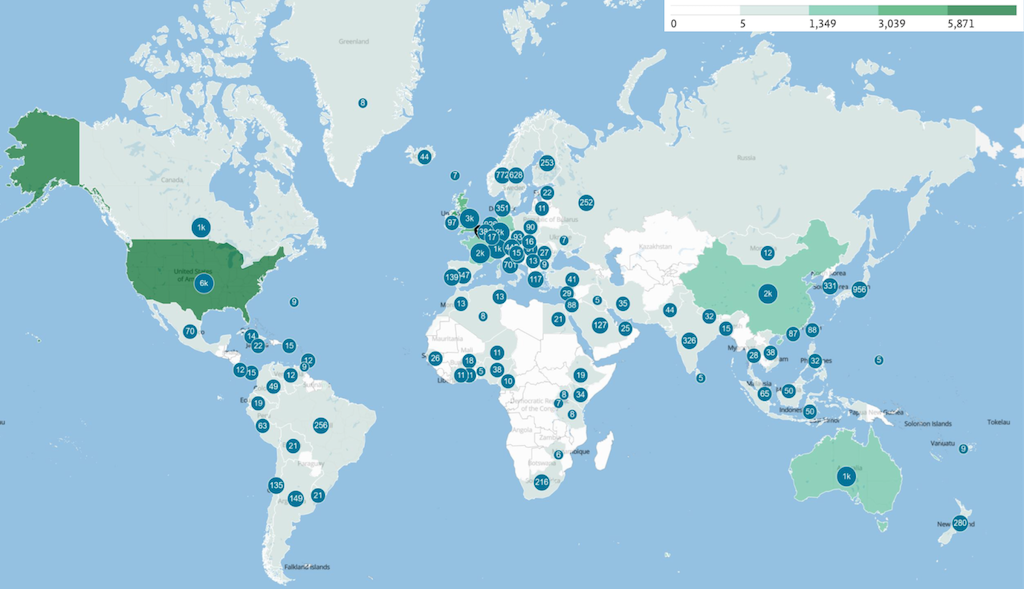
Three-quarters of all literature cited in the report features at least one author based in either the US or the UK. More than 6,000 of the references include at least one author based in the US.
In addition to the US and UK, Germany, France, China, Australia, Switzerland, Canada, Japan and the Netherlands are also represented in more than 1,000 unique references in the report.
The maps below focused in on the number of authors from countries in Africa, Asia-Pacific, Europe, the Middle East, North America and South America.
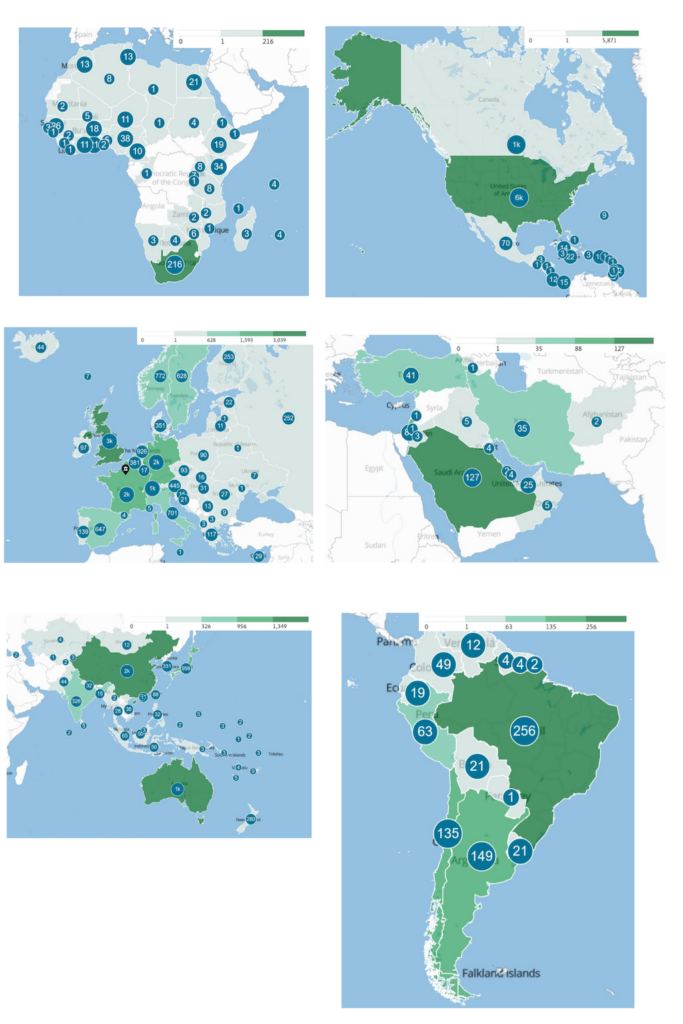
In most of the maps above, a small number of individual countries dominate each region – for example South Africa in Africa and Saudi Arabia in the Middle East. The only partial exception is Europe – although the UK, France and Germany can boast many more authors than their western counterparts.
We also found that 99.95% of the cited references were written in English. We estimate that the final citation list included only 11 non-English language references, with four in French, four in Spanish, two in German and one in Portuguese.
However, not all references assessed in IPCC reports end up being cited in the final product as the sheer volume of available literature makes it impossible to cite everything in the report. This means that many more papers may have been assessed than those included in our analysis.
For example, the WG1 author survey ran from February to March 2022 and collected feedback from over 150 WG1 authors and review editors on the successes, challenges and lessons learned from the WG1 AR6 experience. Around 20% of the survey respondents said that non-English literature was assessed in their chapter – including research in Arabic, Bangla, Chinese, Farsi, French, German, Italian, Japanese, Portuguese, Russian, Spanish and Ukrainian.
Topping the tables
The authors of papers cited in the WG1 report hail from more than 2,500 institutions around the world. The most commonly cited institution is the Centre national de la recherche scientifique (CNRS) – an amalgamation of several institutions based in France, whose experts contributed almost 11% of the total citations.
Almost all of the top 100 institutions are based in the global north. Perhaps this imbalance is no huge surprise, considering the lack of diversity in climate research and that the expensive, resource-intense global climate model research centres are predominantly based in global north countries. The regional imbalance in climate research filters through to an imbalance in the report citations.
The table below shows the top 15 institutions, the country they are based in and the percentage of citations in the AR6 WG1 report that include at least one author from that institution.
| Institution | Country | Percentage of citations | |
|---|---|---|---|
| 1 | Centre national de la recherche scientifique (CNRS) | France | 11% |
| 2 | National Oceanic and Atmospheric Administration (NOAA) | US | 9% |
| 3 | National Centre for Atmospheric Research (NCAR) | US | 7% |
| 4 | Université Paris Sciences et Lettres | France | 7% |
| 5 | UK Met Office | UK | 7% |
| 6 | Université de Paris | France | 7% |
| 7 | École Polytechnique | France | 7% |
| 8 | Institute Polytechnique de Paris | France | 7% |
| 9 | Institute de Recherche pour le Développement (IRD) | France | 6% |
| 10 | Le Commissariat à l'Energie Atomique et aux Energies Alternatives (CEA) | France | 6% |
| 11 | Swiss Federal Institute of Technology Zurich | Switzerland | 6% |
| 12 | Columbia University | US | 5% |
| 13 | Chinese Academy of Sciences | China | 5% |
| 14 | Centre National d’Etudes Spatiales (CNES) | France | 5% |
| 15 | University of Reading | UK | 5% |
We also looked at which journals were cited most frequently. Almost all of the WG1 citations are scientific articles, which are published in peer-reviewed, academic journals. (Meanwhile, 4% are classified as technical reports or books – known as “grey literature”.)
In total, there are more than 800 unique journals represented in the WG1 list of citations. The table below shows the 10 most highly cited journals across the references. It includes the country that the publisher is based in and whether the journal is open-access – meaning that anyone can access papers published in the journal for free.
| Journal | Number of times cited | Country | Open access by default? | |
|---|---|---|---|---|
| 1 | Geophysical Research Letters | 1.561 | US | Yes, as of Jan 2023 |
| 2 | Journal of Climate | 1,537 | US | After one year |
| 3 | Climate Dynamics | 1,075 | Germany | No |
| 4 | Nature Climate Change | 740 | Germany | No |
| 5 | Environmental Research Letters | 618 | UK | Yes |
| 6 | Nature | 531 | Germany | No |
| 7 | International Journal of Climatology | 516 | US | No |
| 8 | Atmospheric Chemistry and Physics | 490 | Germany | Yes |
| 9 | Nature Geoscience | 424 | Germany | No |
| 10 | Proceedings of the National Academy of Sciences | 416 | US | After six months |
The most highly cited journal across all chapters was Geophysical Research Letters with 1,561 citations in the WG1 references, corresponding to around 1,200 unique papers.
Most of these 10 journals are not open-access by default or require authors to pay additional fees for their paper to be an open-access publication. Subscriptions and processing fees can be a huge barrier to participation for academics, particularly for those from the global south.
The push towards open-access science does not always reduce up-front publication fees for researchers, but does allow for the final material to be accessed for free. Universities and researchers are still paying high fees to access and publish their research despite many objections.
Topics
To explore which topic areas are most commonly cited, we used a tool called SciVal to automatically assign topic labels to each of the WG1 citations. The WG1 literature basis has links to a surprisingly broad selection of research themes.
This is illustrated in the figure below, which shows a wheel of research disciplines and where clusters of these assigned WG1 citation topics fit. Each dot represents a specific cluster of topics and its size indicates the number of times they appear in the WG1 citations. The colour corresponds to the scientific discipline that topic is associated with, as assigned by SciVal.
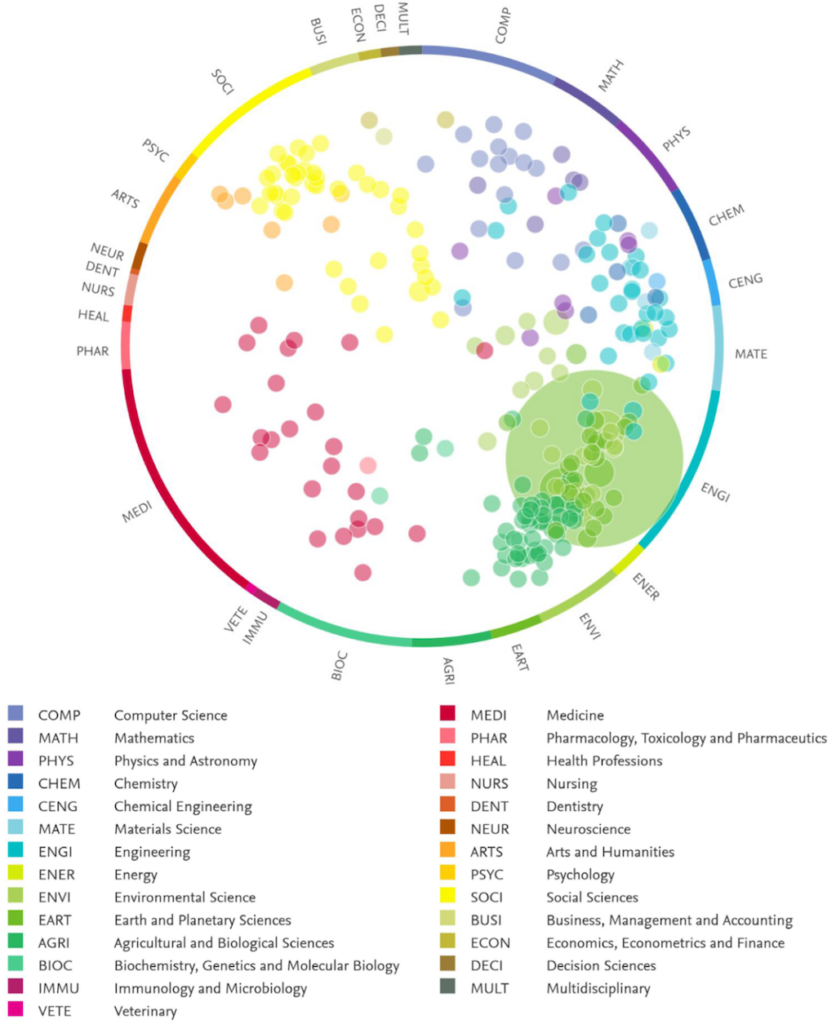
More than half of all WG1 citations are linked with the topic cluster “Climate models, Model, Rain”, which sits among the physical, chemical and environmental science disciplines, and is illustrated by the large light green circle in the figure.
Many citations are linked to research disciplines not usually associated with the WG1 report, but these reflect a growing interest in the cross-disciplinary nature of climate change – even in a report based on the physical science of climate change.
For example, the topic cluster “Salmonella, Escherichia Coli, Listeria Monocytogenes”, which includes citations classified under the medical research discipline, but in fact covers how physical climate characteristics such as temperature can alter diseases. In another example, “Tourism, Tourists, Destination” is a cluster linked to the business scientific discipline that includes citations covering climate services linked to snowfall projections for ski resorts.
Finally, we explored the differences in citations between chapters. Following on from the introduction in Chapter 1, the WG1 report is split in three sections:
- Large-scale climate change (Chapters 2–4)
- Climate system components and processes (Chapters 5–9)
- Regional climate information (Chapters 10-Atlas)
Of the 13,000 citations in the report, around 4,500 are cited in multiple chapters. About 2,000 references are cited in two chapters, over 500 appear in three chapters and just over 200 are cited in four or more chapters.
Due to their similar themes, chapters 8 (“Water cycle changes”) and 11 (“Weather and climate extreme events in a changing climate”), 11 and 12 (“Climate change information for regional impact and for risk assessment”) and 8 and 10 (“Linking global to regional climate change”) share the most citations.
For more information on the IPCC WG1 references and this analysis, check out the accompanying report or you can download the citations yourself from the WG1 website.


Acknowledgement: Special thank you to Robin Matthews, former senior science officer at the Working Group I Technical Support Unit, for his quality control of the WG1 chapter citation lists.
-
Guest post: What 13,500 citations reveal about the IPCC’s climate science report