
Guest post: What the UK can learn from carbon pricing schemes around the world
Multiple Authors
08.02.19Multiple Authors
02.08.2019 | 10:12amJoshua Burke is a policy fellow and Rebecca Byrnes is a policy analyst, both at the Grantham Research Institute on Climate Change and the Environment at the London School of Economics and Political Science.
The UK government has set itself an unprecedented challenge in legislating to reach net-zero greenhouse gas emissions by 2050, the first major economy to do so. It now faces the task of actually reaching that goal – tougher targets do not themselves reduce emissions.
Yet the UK is also in the process of leaving the European Union, putting the country’s main carbon pricing mechanism at risk. The EU Emissions Trading System (EU ETS), which is starting to drive significant CO2 cuts with prices near record highs, covers about a third of UK emissions.
This adds pressure on the UK to reconsider its options for carbon pricing, given the important role it can have in giving incentives to move away from polluting business models.
As the UK looks ahead to meeting its net-zero target – with carbon pricing potentially playing a central role – it is important to draw from the experiences of other economies. We set out to do just that in research published today, which we have summarised in the article, below.
Pricing schemes
As the UK leaves the EU it has several options for replacing its membership of the EU ETS. It could potentially negotiate to remain a part of the scheme; it could create a new UK ETS, which is either linked to the EU ETS or which operates only within the UK; or it could implement a new carbon tax.
While the government has indicated it will implement a backstop carbon tax of £16 per tonne of CO2 in the case of a no-deal Brexit – roughly half the current EU ETS price – it has yet to decide on its longer-term approach. This question is the subject of an ongoing consultation and the reason for our new research.
There are currently 56 carbon pricing schemes in operation worldwide that can offer lessons as the UK chooses its preferred option. These 56 schemes are split equally between 28 based on carbon trading and 28 national and subnational jurisdictions using a carbon tax. The 28 tax schemes cover just 5.6% of global greenhouse gas emissions.
This number might seem small, but the adoption of carbon pricing is on the rise. No fewer than five new tax schemes came on stream between January 2018 and July 2019, and further initiatives are planned.
Three dimensions
Our research found that carbon taxation schemes vary greatly, particularly along three dimensions: the level of the tax, the share of emissions covered, and the use of tax revenues.
The variation between the high and low end of each of these dimensions can be extreme. Poland has a carbon price of just £0.06 (PLN 0.3) per tonne of CO2 (tCO2) covering all fossil fuels, while Sweden’s tax is set at £100.30 (Kr 1,180) per tonne. This applies to CO2 emissions from mainly the transport and buildings sectors.
The global average across all jurisdictions is £18.07/tCO2. In the UK context, other research we carried out recently found that a carbon price that is consistent with Britain’s net-zero target would likely have to start at around £40/tCO2 in most sectors.
On the share of emissions covered, there are also big differences according to the type of carbon tax, among the taxes currently in force.
For example, in Sweden the share of emissions covered is 40%, including those covered by the EU ETS. In the Canadian province of British Columbia – which doesn’t participate in the EU ETS – it is 70%, being applied uniformly to all fossil fuels within its borders. The only major exemptions are inter-jurisdictional shipping and flights (journeys between BC and the rest of Canada).
In the UK, the Carbon Price Support (CPS) – an upstream tax paid by fossil fuel power stations – covers 23% of emissions. In addition, a wider swathe of UK industry faces a separate downstream tax known as the Climate Change Levy (CCL). In total, our calculations suggest that 35% of UK greenhouse gas emissions are covered by one of the various carbon pricing schemes.
There are also significant differences in the way governments use revenues from carbon pricing. The UK’s Carbon Price Support is the least prescriptive, with all proceeds treated as general tax revenue. This allows the exchequer to decide how to spend it.
Rather than using taxes to raise general funds (red bars on the chart, below), most other schemes include rules on earmarking (or “hypothecation”) of revenues for green investments (blue bars) or revenue recycling to households or firms (grey).
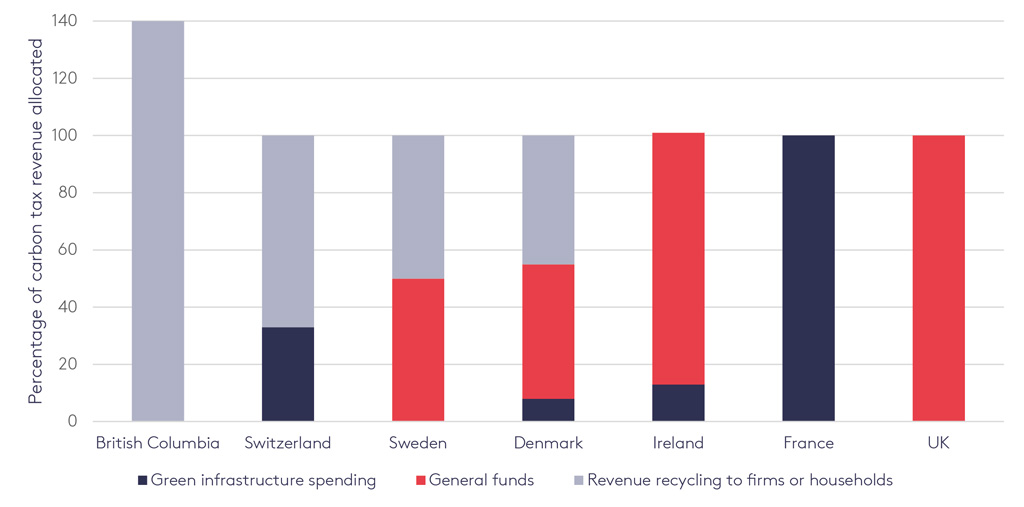
Allocations of revenue from seven example carbon taxes between general funds (red), green spending (blue) or rebates for households and firms (grey). Source: Burke et al. (2019) using data from Carl and Fedor (2016)
Interestingly, British Columbia’s carbon tax differs by returning significantly more money than it generates, as the chart above shows. In 2015, 120% of carbon tax revenues were given back to firms and households. This grew to 140% in 2018, achieved by decreasing income taxes beyond what would be necessary to achieve revenue neutrality.
This revenue recycling is split between general tax cuts for households (dark blue in the chart, below) and firms (dark red) versus directed or more general transfers (lighter shades).
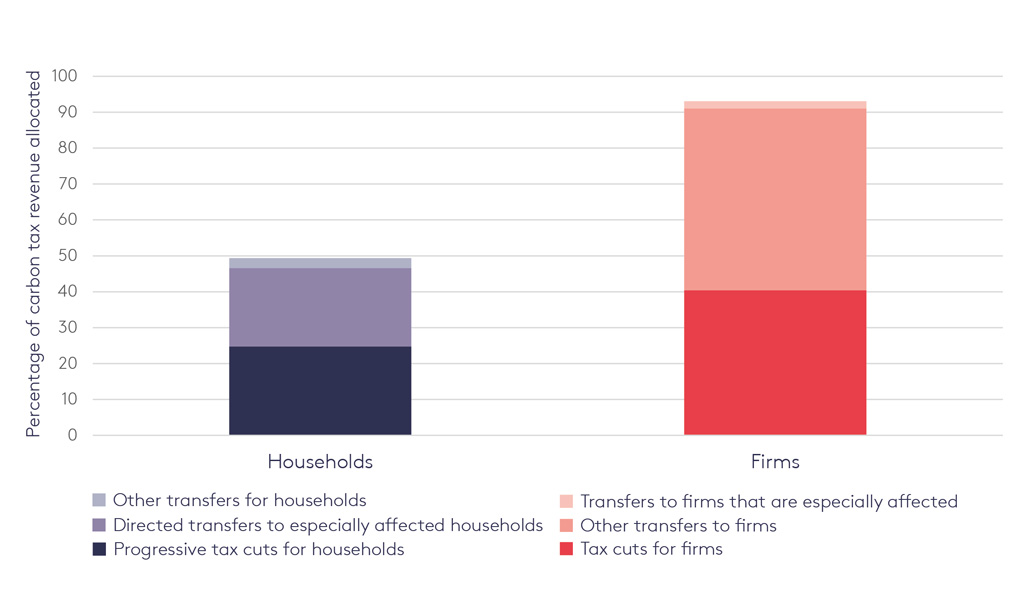
Allocation of British Columbia’s carbon tax revenue between households (shades of blue) and firms (shades of red and pink). Source: Burke et al. (2019) using data from British Columbia’s Budget and Fiscal Plan 2018/19
Lessons from abroad
Our research found these examples from around the world provide three important lessons for the design of a possible new carbon tax for the UK.
First, taxing carbon can present significant political challenges, both before and after implementation. Second, the design and communication of the scheme can improve public acceptability. Third, once in place, carbon taxes do bring down emissions – as explained below.
Taxing carbon tends to be more difficult politically than other climate policies such as subsidies and regulation. In some countries, carbon tax price “escalators” have often been aborted, or entire schemes later rescinded – as happened in Australia, for example – because of political difficulty.
Most obviously, challenges around the political feasibility of a carbon tax have been visible in the backlash in France by the “gilets jaunes” movement against the “Climate Energy Contribution”. It is worth noting, though, that this illustrates the importance of scheme design – with some of the opposition fuelled by the fact that it followed tax cuts for high-income households.
There are several reasons for public resistance to carbon taxes, explored in a recent piece published by Nature. Often, the article suggests, people suspect that the government’s main motivation is raising revenues rather than reducing emissions. Consequently, they consider their personal burden too high, even if they agree with the environmental objective. More broadly, people feel that carbon taxes fall disproportionately on low-income households.
However, public acceptability can be increased through smart design and clear communication. British Columbia is a good example of an innovative tax design that achieved public acceptance and demonstrates that the careful use of tax revenues can turn a regressive tax into a progressive, and therefore more palatable, policy.
Progressive outcomes
One way to achieve a progressive outcome is by recycling carbon tax revenues in the form of a “citizen dividend”.
The chart below illustrates how this could work in the UK, recycling a hypothetical £40/tCO2 tax into a uniform lump-sum dividend of around £1,000 per year paid to each household (the black line). This payment could more than compensate for increased carbon costs in lower income groups (left hand side of the chart), leaving those with the highest incomes paying more tax overall (right hand side).
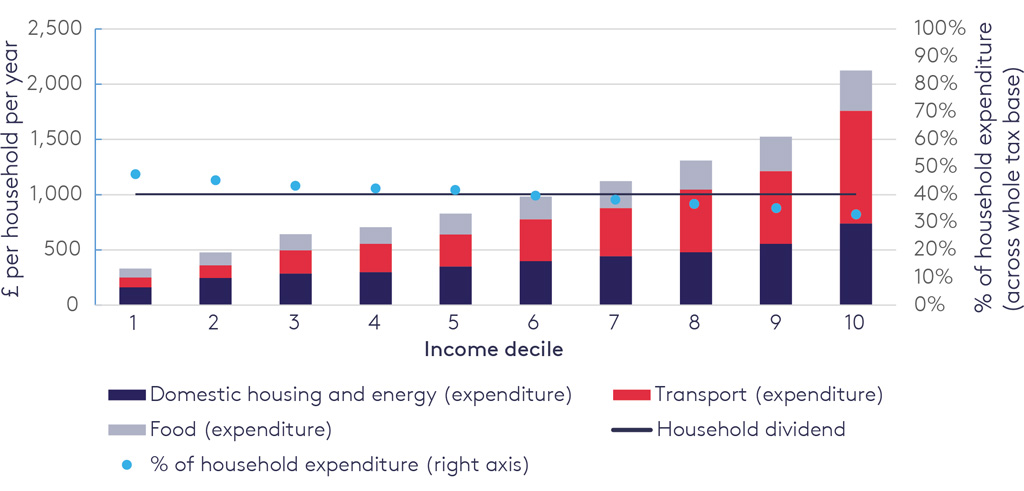
Illustrative tax payment and revenues (£) by income decile. Source: Burke et al. (2019) using data from Gough et al. (2012).
(In the chart above, household greenhouse gas emissions per income decile include both direct emissions, such as gas consumption for heating, as well as indirect emissions such as the emissions embedded in food. Household emissions have fallen since the Gough et al. calculations, and not all indirect emissions may be taxed. The tax impact and size of the dividend are therefore likely to be less than this illustrative figure suggests.)
The hypothetical UK carbon tax illustrated in the chart would affect 47% of expenditures in the poorest 10% of households (income decile 1), but only 33% of household expenditures for the richest 10% (income decile 10). (These percentages are illustrated by the blue dots on the chart.) However, the tax would raise enough revenue to give each household an equal “dividend” of £1,000 per year, leaving the lowest five income deciles – half of all households – better off overall.
Looking at political acceptability in the process of designing a carbon tax might help governments such as the UK’s to head off this issue before it damages efforts to reduce emissions.
Cutting emissions
Long-established schemes in the Nordic countries, which have received less opposition, show that they have been successful in reducing greenhouse gas emissions. However, the emissions cuts have not been as steep as those that will be required under a trajectory to net-zero. In part, this has to do with relatively low tax levels and widespread tax exemptions.
In the UK, carbon taxation through the Carbon Price Support has been linked to the fall in coal generation by 73% between 2013 and 2017.
How much weight is given to each of these lessons depends on the political context. If the greatest obstacle to carbon pricing is building a broad coalition of citizens, then the evidence shows this can be overcome by using direct transfers in the form of a dividend.
Where genuine competitiveness concerns present the largest barrier, compensating firms through tax rebates may be preferable.
As the UK prepares to leave the EU ETS, it has an opportunity to draw lessons from the best examples of carbon pricing from around the world as it strives to achieve net-zero. Whichever approach it chooses, a price on CO2 is likely to play an important role in reaching its target.
-
Guest post: What the UK can learn from carbon pricing schemes around the world