IEA: Renewables should overtake coal ‘within five years’ to secure 1.5C goal
Multiple Authors
05.18.21Multiple Authors
18.05.2021 | 6:00amThe world needs a “radical” shift towards renewables to reach net-zero emissions by 2050 and secure the 1.5C goal, says the International Energy Agency (IEA).
This would see renewable energy overtake coal by 2026, passing oil and gas before 2030. By 2050, it should go on to meet two-thirds of global energy supply and nearly 90% of electricity generation.
In a 227-page report, titled “Net-zero by 2050: A roadmap for the global energy sector,” the IEA calls for “a total transformation of the energy systems that underpin our economies”.
It says this is a “critical year at the start of a critical decade for these efforts”, which must start turning the world’s energy system from one dominated by fossil fuels into a future “powered predominantly by renewable energy like solar and wind”.
The roadmap sets more than 400 milestones showing how this transformation should happen, including an immediate end to new investment in fossil-fuel extraction and net-zero electricity by 2040.
On top of keeping below 1.5C, the Paris-based agency says its net-zero emissions by 2050 (NZE) scenario would boost global GDP, create millions of jobs, provide universal energy access by 2030 and avoid millions of premature deaths due to air pollution.
In a commentary published ahead of the roadmap, IEA executive director Dr Fatih Birol says the NZE blueprint is the “energy future we all need to focus on”.
- What is the net-zero roadmap?
- Why has the net-zero roadmap been published?
- What does the net-zero future look like?
- What needs to happen to follow the net-zero roadmap?
- How does the net-zero roadmap compare with other pathways?
What is the net-zero roadmap?
The IEA report is a “how-to guide” for the world’s decision-makers, many of whom have committed their countries, cities or businesses to net-zero emissions by midcentury.
It offers a “net zero emissions by 2050” (NZE) scenario and the “concrete milestones for technology deployment, sectoral trends and choices that have to be made” to meet it.
The NZE is the IEA’s first-ever detailed pathway to reaching net-zero carbon dioxide (CO2) emissions from energy and industry by 2050. It is described as “1.5C compatible”.
The IEA says NZE would give a 50% chance of staying below 1.5C with no “overshoot”, if paired with stringent cuts to non-CO2 greenhouse gases and emissions from forestry and land use.
Cumulative global CO2 emissions from energy use and industry would reach 450bn tonnes (GtCO2) between 2020-2050, it says, with 45GtCO2 from land use and forestry.
This falls within the 500GtCO2 remaining carbon budget for 1.5C, the IEA says, based on the Intergovernmental Panel on Climate Change (IPCC) special report on 1.5C.
(The remaining carbon budget for 1.5C is fairly uncertain. A recent Carbon Brief guest post looked at the latest evidence and put the budget at just 440GtCO2 from 2020.)
The NZE builds on preliminary modelling in last year’s World Energy Outlook but extends to 2050 and adds more detail, including full data tables.
The scenario is built on three principles:
- Technology neutrality, with adoption driven by costs, technological readiness, country and market conditions, and trade-offs with wider societal goals;
- Universal international cooperation, in which all countries contribute to net-zero, with an eye to a “just transition” and where advanced economies lead;
- An “orderly transition” that seeks to minimise stranded assets “where possible”, while ensuring energy security and minimising volatility in energy markets.
To produce the NZE, the IEA has combined the outputs of its “World Energy Model” from its annual World Energy Outlook, with its technology-rich “Energy Technology Perspectives” model.
The results from the IEA models are then “coupled” with the GAINS and GLOBIOM models from the International Institute for Applied Systems Analysis (IIASA).
This allows for consideration of the health impacts of air pollution, as well as the land use and emissions impacts of demand for bioenergy.
Finally, the team used the Global Integrated Monetary and Fiscal (GIMF) model of the International Monetary Fund (IMF) to look at investment, spending and global GDP.
The NZE is not the only 1.5C path, says a commentary by Laura Cozzi, the IEA’s chief energy modeller, and Timur Gül, head of the energy technology policy division:
“Our new NZE scenario should not be mistaken as the path to net-zero emissions by 2050. Rather, it is a path that seeks to provide clarity on what delivering on ambitions to reach net-zero by 2050 might actually mean in practice.”
Indeed, the 2018 IPCC special report assessed 90 such pathways and the likes of oil major Shell and thinktank the Energy Transitions Commission also have 1.5C scenarios.
However, the IEA says its roadmap is, in its analysis, “the most technically feasible, cost‐effective and socially acceptable” way to stay below the 1.5C limit.
The NZE is a relatively “aggressive” 1.5C pathway compared with those assessed by the IPCC in 2018, reaching net-zero by 2050 without offsets from land use or forestry.
It has stronger energy efficiency and behaviour change, wider electrification, more wind and solar, less bioenergy, less carbon capture and storage (CCS), less negative emissions and lower fossil fuel use, relative to most IPCC “no or low overshoot” 1.5C pathways.
How does the new @IEA net-zero scenario compare to IPCC 1.5C pathways?
— Simon Evans (@DrSimEvans) May 14, 2021
Much lower fossil fuel use = 120EJ in 2050 (184)
Lower energy use = 344EJ (404)
Higher wind/solar share = 70% (53%)
Less CCS = 7.6Gt (8.4)
Less BECCS = 1.9Gt (4.5)
Less bio = 102EJ (152)
Full range in charts pic.twitter.com/ouhxhM5u82
Nevertheless, the NZE still includes significant use of bioenergy, CCS and negative emissions from bioenergy with carbon capture and storage (BECCS) and direct air capture (DAC), which enable some ongoing fossil fuel use in 2050.
It also features strong growth in output from nuclear power.
The roadmap explores seven “cases” where these and other mitigation “levers” fall short of what they contribute in the main NZE scenario.
For example, the IEA shows it would still be possible to reach net-zero by 2050 in a “low CCS case” (LCC), but says it would be “vastly more difficult”.
Why has the net-zero roadmap been published?
The IEA has published its net-zero roadmap to inform the COP26 UN climate talks in November, with the world falling far short of the climate goals in the Paris Agreement.
This shortfall is despite the momentum of new net-zero climate goals, which now cover around 70% of global GDP and CO2 emissions, according to chapter one of roadmap.
In the report foreword, IEA executive director Dr Fatih Birol spells this out:
“The number of countries that have pledged to reach net‐zero emissions by mid‐century or soon after continues to grow, but so do global greenhouse gas emissions. This gap between rhetoric and action needs to close if we are to have a fighting chance of reaching net-zero by 2050 and limiting the rise in global temperatures to 1.5C.”
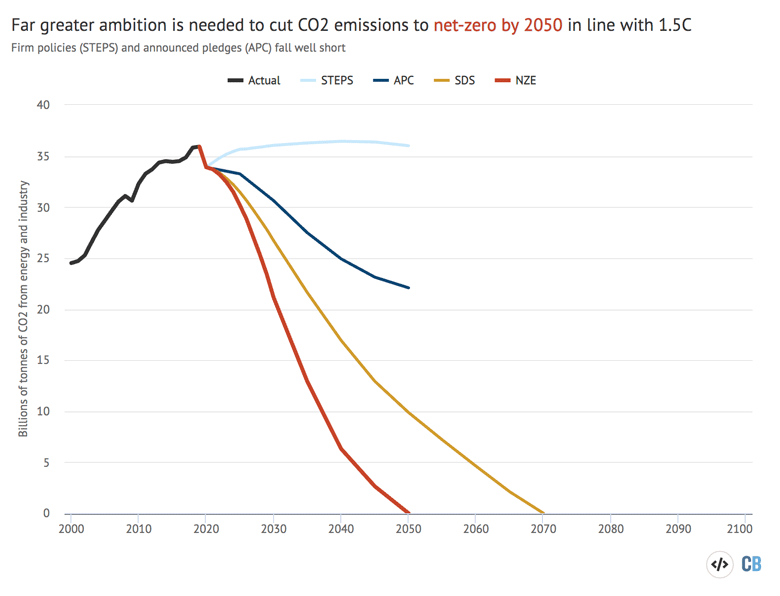
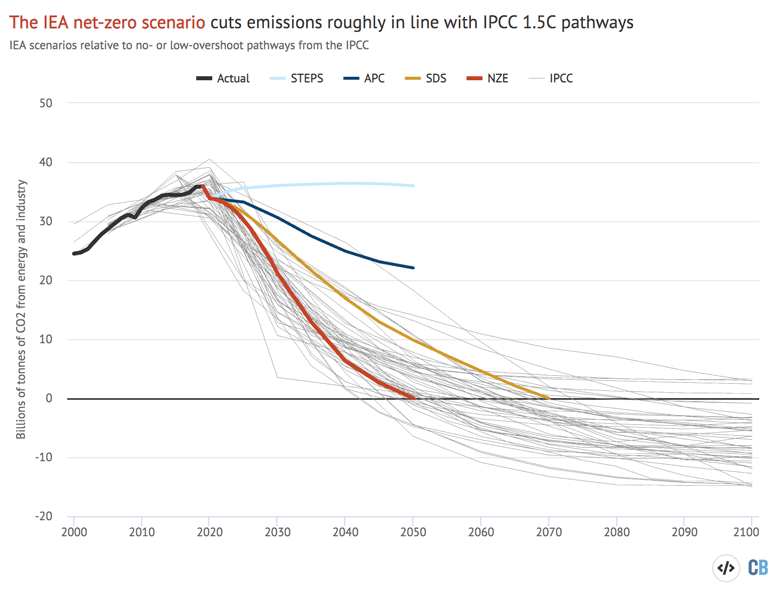
The gap Birol describes is most clearly illustrated by looking at the past and expected future path of global CO2 emissions, shown in the chart below.
One reason for the gap is that few net-zero targets are supported by detailed near-term policy packages that would drive immediate action, the IEA says.
This is why the policies firmly in place to date would only cause emissions to plateau close to current level (stated policies scenario, STEPS, light blue), the IEA says, with warming reaching around 2.7C this century.
Yet even if governments meet their net-zero targets on time and in full, temperatures would still rise by around 2.1C (announced pledges case, APC, dark blue).
If emissions reach net-zero by 2070, as in the IEA’s sustainable development scenario (SDS, pink), temperatures would stay “well-below 2C” above pre-industrial levels.
Finally, if emissions fall to net-zero by 2050, warming would stay below 1.5C (NZE, red).
In an article on LinkedIn published ahead of the net-zero report, Birol says the net-zero roadmap “shows the energy future we all need to focus on”. He describes it as “one of the most important reports in our agency’s nearly 50-year history”. Birol adds:
“The roadmap underscores that this decade is pivotal to reaching net-zero by mid-century. We need to put emissions into sharp decline in the coming years through strong and credible energy policies.”
The agency in general – and Birol, in particular – have become increasingly outspoken on the need to rapidly cut emissions, particularly since the Covid-19 pandemic.
Today’s report marks another step in this direction, saying that the NZE scenario “would bring major benefits for human prosperity and well-being”.
On a more practical level, the IEA’s roadmap has been published in response to a request from the UK presidency of the upcoming COP26 UN climate summit.
It offers guidance for policymakers in the form of hundreds of “milestones” for each sector and technology. (See: What needs to happen to follow the net-zero roadmap?).
The roadmap also comes after years of activist pressure on the IEA to centre its analysis on 1.5C and to show the implications of meeting the goal for the global energy system.
Crucially, Birol says that the net-zero roadmap will now “guide our future work”, continuing to feature in the IEA’s annual World Energy Outlook (WEO). He concludes:
“Naturally, the net-zero by 2050 emissions scenario described in our roadmap – a pathway in line with 1.5C – will be an integral part of the World Energy Outlook 2021, our flagship annual report in the autumn and in future editions of the WEO in the years ahead.”
What does the net-zero future look like?
The IEA roadmap sets out a blueprint for a net-zero emissions economy that would be dramatically different to the world that exists today.
The amount of energy used by the global economy would fall 8% by 2050, despite a doubling of GDP, a population rise of more than two billion people and the provision of universal energy access by 2030.
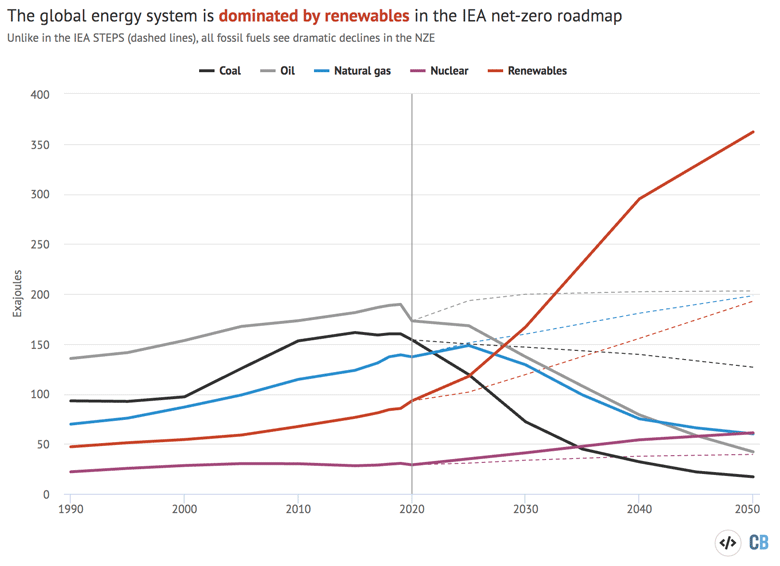
Instead of getting around four-fifths of the energy that drives the global economy from fossil fuels, the use of coal, oil and gas would rapidly decline.
By 2050 in the NZE, just over a fifth of energy supplies would come from fossil fuels, compared with more than two-thirds from renewables and around a tenth from nuclear.
This is shown in the chart below, where renewables (red line) become the largest source of energy by 2030 and continue a meteoric rise thereafter.
(Note the stark contrast between the solid lines for the NZE relative to the dashed lines showing what is expected without more action beyond the policies now firmly in place.)
Unabated coal use would fall by 98%, unabated gas by 88% and oil by 75%. In a box on why fossil fuels need not be completely phased out in the NZE, the IEA points to non-energy uses, such as chemical feedstocks, as well as combinations with CCS.
The dominance of renewables would be helped by the widespread electrification of the economy, from transport and heating to low-temperature industrial heat.
Electricity’s share of final energy demand would rise from 20% today to nearly 50% by 2050. Meanwhile, liquid fuels would halve from 38% of demand today to 19%.
Gaseous fuels would maintain their share of the mix but with hydrogen matching a reduced role for natural gas by 2050. As for solid fuels, coal’s share would see a four-fold drop, with some of this replaced by bioenergy.
Chapter four of the NZE report focuses on the “wider implications of achieving net-zero emissions”, which includes an overview of the scenario’s impact on the economy, the energy industry and global citizens.
Based on the IEA’s joint analysis with the International Monetary Fund, the NZE results in a global GDP 4% higher in 2030 than it would be based on current trends.
However, the agency notes that the benefits of the transition would likely not be spread evenly between or within nations.
In the NZE, employment in clean energy increases by 14m to 2030, while employment in the fossil fuel sector falls by 5m.
Even though the IEA says this leads to “a net increase of nearly 9 million jobs”, it adds that there would also be another 16m jobs created “by changes in spending on more efficient appliances, electric and fuel cell vehicles, and building retrofits and energy-efficient construction”. This brings the total net increase to 25m jobs.
Finally, the agency states that achieving the goals laid out in the NZE relies on “a singular, unwavering focus from all governments” and cooperation between nations.
To emphasise this point, the report also includes modelling of a “low-cooperation” scenario, which results in the net-zero date being delayed by nearly four decades.
What needs to happen to follow the net-zero roadmap?
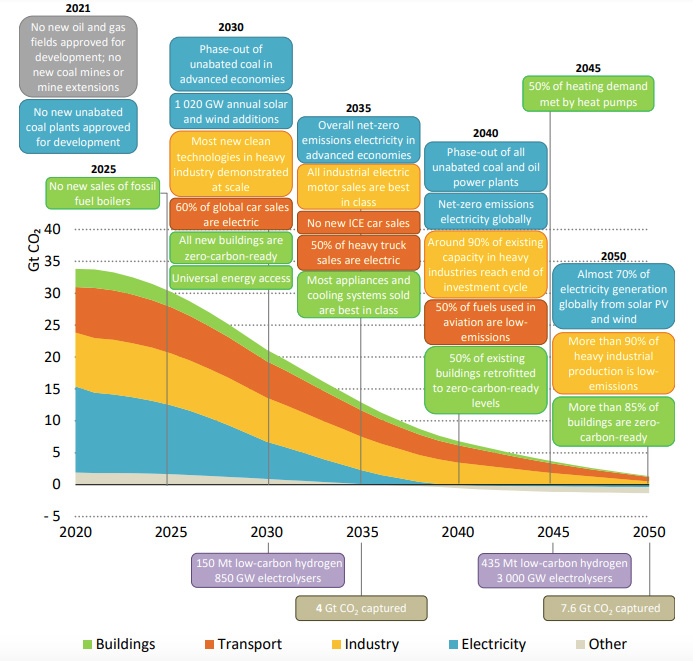
The IEA’s blueprint includes more than 400 global milestones for different sectors and technologies to guide the world towards net-zero emissions.
A selection of these milestones, which include no new oil and gas fields or coal mines beyond 2021 and a zero-carbon power sector by 2040, can be seen in the chart below.
Besides these targets, the report also identifies seven “key pillars of decarbonisation” with milestones that span different sectors.
These pillars are: energy efficiency; behavioural changes; electrification; renewables; hydrogen and hydrogen‐based fuels; bioenergy; and carbon capture and storage (CCS).
The IEA emphasises that energy-efficiency measures are “front-loaded” in the NZE, playing a big role over the next decade while some mitigation measures that will be needed by 2050 are relatively underdeveloped.
The agency says that all of the technologies needed on the path to 2030 already exist.
But by 2050, it says that nearly half the emissions cuts are expected to come from technologies which are still largely in the demonstration or prototype phase, such as advanced batteries and direct air CCS.
(This is subtly different to comments from US climate envoy John Kerry, who said 50% of reductions for net-zero would come from technologies “that we don’t yet have”.)
While clean energy technology is well-established in the electricity sector, there is a pronounced need for innovation for CCS and hydrogen, as shown in the chart below.
Around 55% and 75%, respectively, of the cumulative emissions cuts attributed to these technologies in the NZE are still at the demonstration or prototype stage.
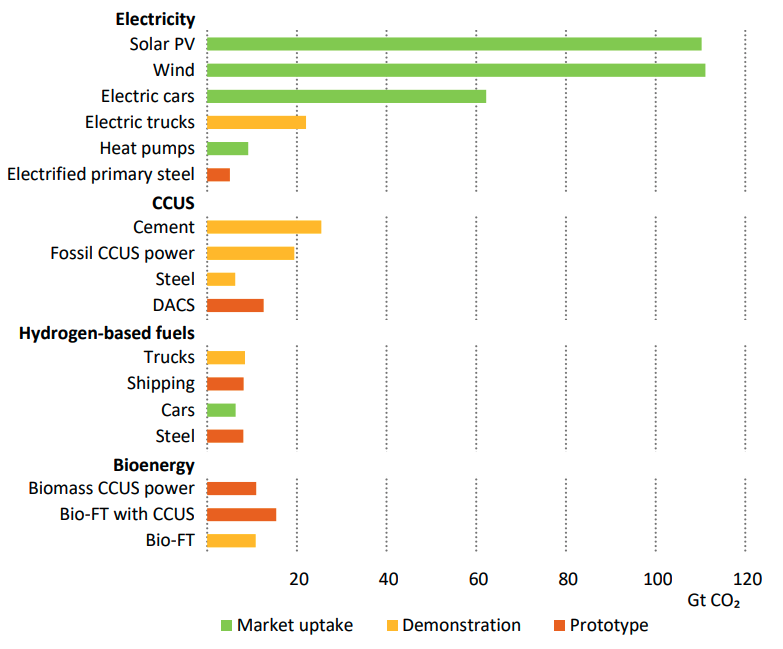
The chart shows why the IEA says innovation is “critical” and that “huge leaps” are needed this decade, in order to smooth the path to net-zero after 2030.
It adds: “Without a major acceleration in clean energy innovation, reaching net‐zero emissions by
2050 will not be achievable.”
In this section, Carbon Brief provides an overview of some of the key milestones for different sectors and technologies outlined by the IEA for its NZE scenario.
The agency notes that coordinated action across every part of the economy will be vital, as “if any sector lags, it may prove impossible to make up the difference elsewhere”.
Fossil fuel extraction
The precipitous decline of fossil fuel demand means that the NZE requires no new extraction of coal, oil or natural gas beyond 2021. The report says:
“Beyond projects already committed as of 2021, there are no new oil and gas fields approved for development in our pathway, and no new coal mines or mine extensions are required.”
This is likely to bolster the efforts of campaigners seeking to stop governments from approving new drilling and mining operations, such as those in the UK to Mexico.
In the NZE, the IEA says that oil demand never returns to its 2019 peak and declines by nearly 75% from 2020 to 2050. This means continued investment in existing oil fields is sufficient to meet demand.
The same is true of natural gas, even though demand does continue increasing until the 2030s. Over the coming decades, oil and gas become increasingly concentrated in a few major countries, mainly in the Middle East and North America, the IEA notes.
Coal sees a significant decline, with no final investment decisions for new coal plants unless they are equipped with CCS. The least efficient coal plants must be phased out by 2030 and any left in 2040 should be retrofitted with CCS.
Due to declining demand, there are no new coal mines or extensions of existing mines required in the NZE scenario.
Methane leaks are a major source of emissions from fossil fuel production and the NZE includes a 75% decline in these emissions, equivalent to a 2.5GtCO2e reduction over the next decade. This requires the elimination of all technically avoidable methane emissions from fossil fuel infrastructure by 2030.
Electricity supply
Electrification is key to the NZE, with global electricity demand more than doubling over the next three decades and its share of total final energy consumption reaching 49% by 2050. The vast majority of this demand is expected to be met by renewables.
Accommodating this shift will require electricity networks that, as the IEA notes, “took over 130 years to build”, to more than double in length within the space of just 20 years.
The power sector is currently the largest contributor to global emissions, but it is also the first to decarbonise, due to the relative maturity of the technologies required.
Emissions from electricity generation reach net-zero in 2035 in richer nations while developing economies reach the same point around 2040.
In the NZE, renewables’ share of generation doubles from 29% to 61% by 2030 and reaches 88% by 2050.
As the chart below shows, wind and solar are the main contributors, becoming the leading sources of electricity before 2030 and meeting nearly 70% of demand by 2050.
Each would generate more than 23,000 terawatt hours (TWh) by 2050, which can be compared to global electricity demand today of slighly less than 27,000TWh.
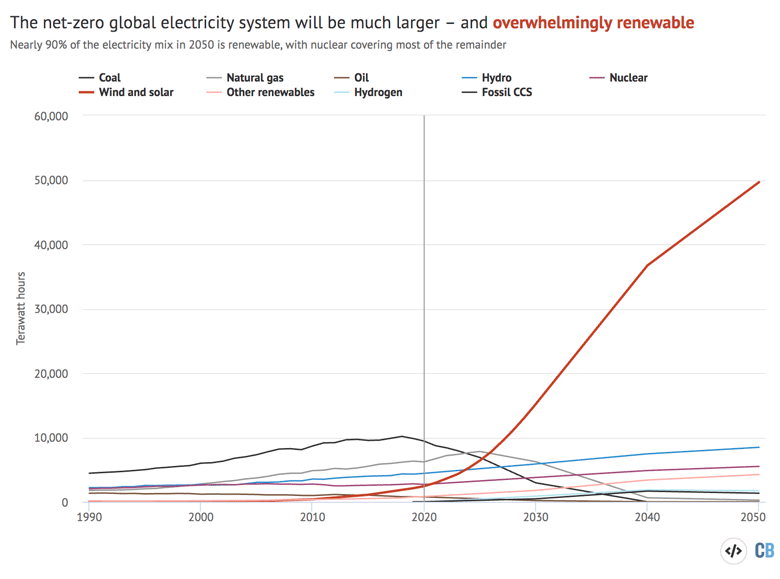
In a market update published last week, the IEA stated that the “exceptional” level of annual wind and solar capacity additions seen in 2020 – nearly 250 gigawatts (GW) – would become the “new normal” in the coming years.
For comparison, the “deployment milestones” set for renewables in the NZE are annual additions of 630GW solar and 390GW wind power by 2030, and roughly the same in 2050.
As the IEA notes, for solar “this is equivalent to installing the world’s current largest solar park roughly every day” in 2030.
The NZE also sees pairing of batteries with solar and wind becoming “commonplace” in the late 2020s, to improve grid flexibility and maintain energy security.
Other renewables also witness significant increases, with hydropower capacity doubling and bioenergy generation increasing fivefold by 2050.
Nuclear power is also important in the NZE, with its overall output doubling by 2050. After renewables, it would be the largest remaining source of electricity by 2050.
However, it drops below 10% of total generation and its share in richer nations actually falls over this period.
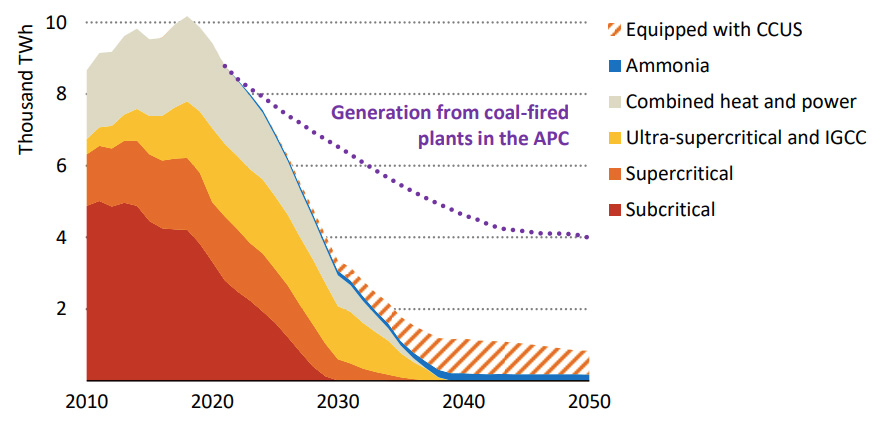
In the NZE, all coal plants are phased out by 2040 unless retrofitted with CCS or used to burn hydrogen-based fuels. Large-scale oil-fired plants are also gone by this date.
While gas plants would still be required by the middle of the century, they would mostly be fitted with CCS technology. In the NZE, unabated fossil fuels supply 0.4% of electricity in 2050 and fossil fuels with CCS another 1.9%.
As the chart below shows, the NZE’s trajectory for coal plants – responsible for 27% of energy CO2 emissions in 2020 – is markedly different from the one set out in existing government targets, indicated by the purple dotted line.
The report warns that nations must act fast to extend the lifetime of existing nuclear plants or develop new ones, as well as investing in CCS in order to bring costs down:
“Failing to take timely decisions on nuclear power and CCUS would raise the costs of a net-zero emissions pathway and add to the risk of not meeting the goal by placing an additional burden on wind and solar to scale up even more quickly than in the NZE.”
In the IEA’s “low nuclear and CCUS” case (see below), an additional 2,400GW of wind and solar capacity would be required to make up the shortfall, an amount the agency notes is “far exceeding their combined global capacity in operation in 2020”.
Hydrogen
Hydrogen is identified as one of the “pillars of decarbonisation” in the report, with uses stretching across virtually every major sector in the IEA’s new scenario.
The share of low-carbon hydrogen and hydrogen-based fuels in total final energy use worldwide reaches 13% by 2050 in the NZE. The IEA has previously estimated 5-7% for its SDS pathways, which corresponds with warming of well-below 2C.
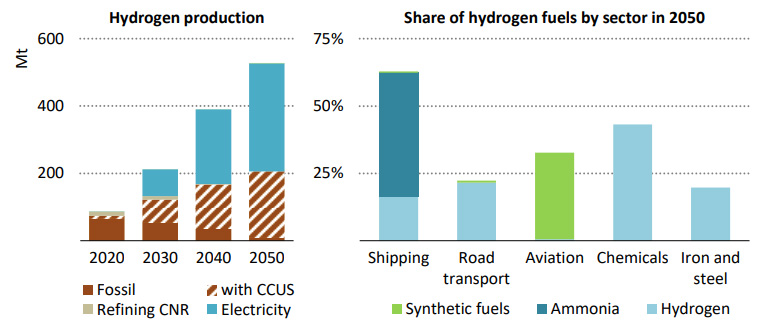
The report says 149m tonnes of low-carbon hydrogen will need to be produced annually by 2030 and 520m tonnes by 2050, compared to 9m tonnes in 2020.
Barely any low-carbon hydrogen today is “green”, meaning it is produced using electrolysis powered by renewables.
By 2030 more than half of all hydrogen production would be green in the NZE. By 2050 this proportion would reach 62%, accounting for a fifth of global electricity generation.
This will also require an enormous scaling up of electrolyser infrastructure from virtually nothing today to 850GW of capacity by 2030 and 3,585GW by 2050.
The remainder would be “blue” hydrogen, produced using natural gas combined with CCS, as the chart below left shows.
The split between varieties of low-carbon hydrogen is emerging as a key battleground for some environmental campaigners, who want to see governments committing to strictly green hydrogen in their strategies.
However, the IEA’s roadmap mirrors the likes of the UK’s Climate Change Committee, which has emphasised that, while green hydrogen should be prioritised, there will still be a major role for blue hydrogen despite it not being entirely emissions-free.
Bioenergy
Bioenergy is identified as another “pillar of decarbonisation” in the NZE, although it emphasises the importance of balancing bioenergy crops against other requirements, notably food production.
The pathway involves expanding the range of land used for bioenergy crops from 330m hectares (Mha) to 410Mha, a roughly 25% expansion.
Although this total is equivalent to nearly a third of the area currently used for crops (1,500Mha), a much larger area is used today for grazing livestock (3,300Mha).
The NZE has some 102 exajoules provided by bioenergy by 2050, which it says aligns with estimates for the “global sustainable bioenergy potential”.
(The IPCC special report on 1.5C indicated a limit of 100EJ for bioenergy use.)
As the chart below shows, the pathway involves completely eliminating “traditional uses of biomass” – namely using it to cook, which is both inefficient and harmful to human health – by 2030. This is in line with the UN Sustainable Development Goals.
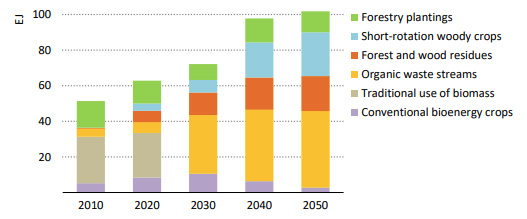
However, this is made up for by increases in “modern” bioenergy which is expected to scale up considerably in the industry and power sectors.
Bioenergy with carbon capture and storage (BECCS) plays a particularly important role in the NZE as it can be used to offset emissions from otherwise “hard-to-decarbonise” sectors.
By 2050, around 10% of bioenergy is used in facilities with CCS, capturing around 1.3GtCO2.
Transport
Decarbonising transport is a sizable task, especially given that the world’s car fleet is expected to increase from 1.2bn to 2bn by the middle of the century.
The NZE includes a deadline of no new passenger internal combustion engine car sales globally by 2035. There is also expected to be a role for hydrogen fuel-cells, but mainly for heavy trucks.
There has been much industry debate around whether hydrogen vehicles will succeed in the mass market, however, the IEA’s scenario sees a relatively minor role for them compared to electric vehicles, as the chart below shows.
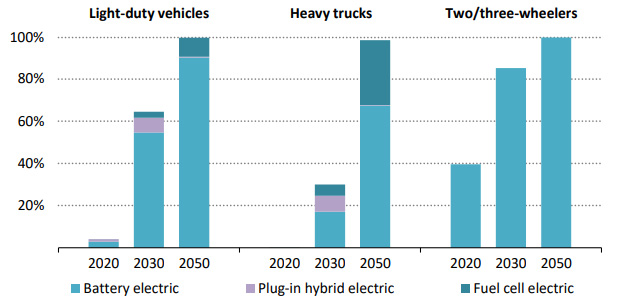
Accommodating this shift is a considerable task, requiring a 150-fold increase in public electric vehicle charging units and a 170-fold increase in hydrogen refuelling units over the next 30 years.
While passenger cars can make use of low-emissions technologies already on the market, the report warns that “major advances” are needed for heavy trucks, shipping and aviation to reduce their emissions.
The NZE assumes that aviation growth is “constrained” by government policies, such as taxes on commercial passenger flights that drive a shift towards high-speed rail and curb the expansion of long-haul business travel. Planes still emit 210MtCO2 in 2050, down from 640MtCO2 today.
Alternative aviation fuels are slow to arrive, with biofuels and hydrogen-based fuels accounting for just 16% and 2%, respectively, of energy consumption by 2030. This increases to 45% and 33% by 2050.
Shipping is another sector that does not reach zero emissions, producing 120MtCO2 in 2050, down from 830MtCO2 today.
Ammonia and hydrogen are the main low-carbon fuels for the sector, making up 60% of total energy consumption in 2050.
Buildings
The NZE includes “immediate and rapid improvements” in the world’s building stock, resulting from large-scale programmes in which around 2.5% of housing in richer nations are retrofitted each year until 2050. The current retrofit rate is less than 1%.
There would be a 2% annual rate of retrofits in emerging and developing countries and by 2050 more than 85% of buildings would be zero-carbon ready, meaning they would be energy-efficient and ready to be powered by renewables.
Many nations’ “green recovery” plans have included significant sums of money for home retrofits.
However, as the UK government’s recently abandoned “green homes grant” has made clear, such programmes require careful coordination to minimise disruption and ensure uptake, something the IEA notes in the report.
The agency states that any delay to the 2.5% annual retrofitting plan “would be almost impossible to catch up, placing further strain on the power sector and pushing up fossil fuel demand”.
The implications of this are explored in a “delayed retrofit case” (see below).
Other specific targets for buildings include bans on new fossil-fuel boilers being introduced globally in 2025 and driving up sales of heat pumps, which are expected to provide half of all heating demand by 2045.
The NZE would also ensure universal energy access by 2030, another of the UN’s Sustainable Development Goals.
Industry
Cutting emissions from industry takes a long time and a considerable effort that involves the overhaul of much existing infrastructure.
Three industries – steel, cement and chemicals – emit around 70% of CO2 from this sector and are, therefore, key to the transition. As the chart below shows, NZE relies primarily on CCS and, to a lesser extent, hydrogen to decarbonise these industries.
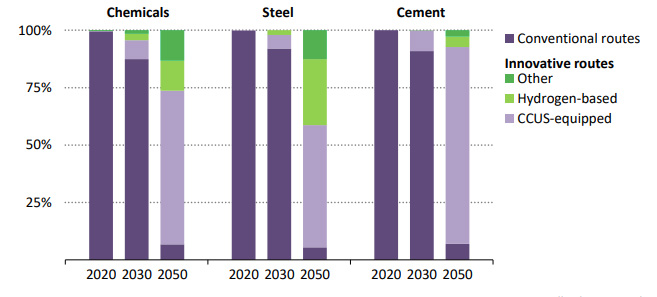
According to the report’s summary for policymakers, in the NZE “every month from 2030 onwards ten heavy industrial plants are equipped with CCUS, three new hydrogen-based industrial plants are built, and 2GW of electrolyser capacity are added at industrial sites”.
Progress in this area will depend on aligning new technologies with investment cycles for major projects, such as steel blast furnaces and cement kilns, the IEA says:
“The challenge is to ensure that innovative near‐zero emissions industrial technologies that are at large prototype and demonstration stage today reach markets within the next decade, when around 30% of existing assets will have reached 25 years of age and, thus, face an investment decision.”
Intervening in time could help mitigate 60GtCO2, which is around 40% of projected emissions from heavy industry, the agency concludes.
Even then, by 2050 in the NZE the “vast majority of fossil fuels” still remaining in the global energy system are expected to be used in industry, with 50% being used as a chemical feedstock and 30% used in plants with CCS.
Behaviour change
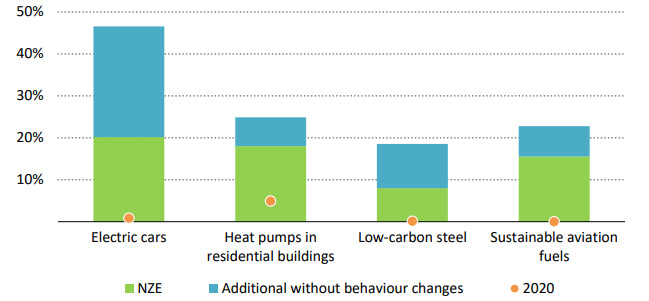
Less than 40% of the emissions reductions in the NZE involve adopting technologies that require little involvement from the general public, the IEA says. The remainder require at least some participation from people.
Around three-quarters of emissions reductions from behavioural changes in the NZE rely on governments introducing policies and developing infrastructure, such as new high-speed railways to encourage cleaner transport options.
Other targets that require citizen engagement are phasing out petrol and diesel cars in all large cities by 2030 and discouraging flying to the extent that business and long-haul leisure air travel does not exceed 2019 levels by 2050.
The remaining behavioural emissions savings come from voluntary changes to save energy, mainly in people’s homes.
Without these changes, cumulative emissions between 2021 and 2050 in the NZE would be around 10% higher.
The IEA notes that, without them, there would be even more pressure on the “already unprecedented ramp-up needed in low-carbon technologies”.
This can be seen in the chart below, with the blue columns indicating the additional increase in these technologies required in the NZE without substantial behaviour change.
How does the net-zero roadmap compare with other pathways?
The IEA net-zero scenario is not the only way to limit warming to 1.5C, as already noted.
In its 2018 special report, the IPCC assessed 90 pathways to 1.5C and these share many of the key characteristics in the IEA blueprint.
For example, electrification, energy efficiency, renewables and reduced fossil fuel use are all core features of the IPCC 1.5C pathways, as well as the NZE.
Yet the paths to 1.5C from computer models are not necessarily plausible routes to meeting the target in practice.
As a Carbon Brief guest post explained in 2019, many of the IPCC 1.5C pathways suggest “very risky strategies for tackling warming that are at odds with the letter of the Paris Agreement”.
Some of them “requir[e] potentially impossible amounts of negative emissions”, for example.
In the past, the IEA has also been criticised for producing scenarios with heavy reliance on CCS, bioenergy and negative emissions
So how does the new NZE compare with other pathways for 1.5C – and does it map out a plausible roadmap to getting there?
The chart below compares CO2 emissions from energy and industry in the NZE (red line) with no- or low-overshoot pathways from the IPCC (grey lines).
This shows that emissions cuts start more slowly in the NZE – in part, because the IPCC pathways were published several years earlier.
By 2040, however, the NZE has emissions that are slightly lower than the IPCC 1.5C pathways.
It reaches net-zero earlier than the large majority of IPCC pathways, due to the IEA’s decision to balance emissions from energy and industry without relying on offsets from land or forests.
The amount of CCS and BECCS in the IEA roadmap fall within the “reasonable” range of deployment, according to Dr Elmar Kriegler.
Kriegler is head of the research department at the Potsdam Institute for Climate Impact Research (PIK) and was an author of recently published research exploring how much could plausibly be achieved through various mitigation strategies.
He tells Carbon Brief that the NZE has “challenging” levels of energy demand management and carbon intensity reduction, implying high levels of energy efficiency and clean energy deployment.
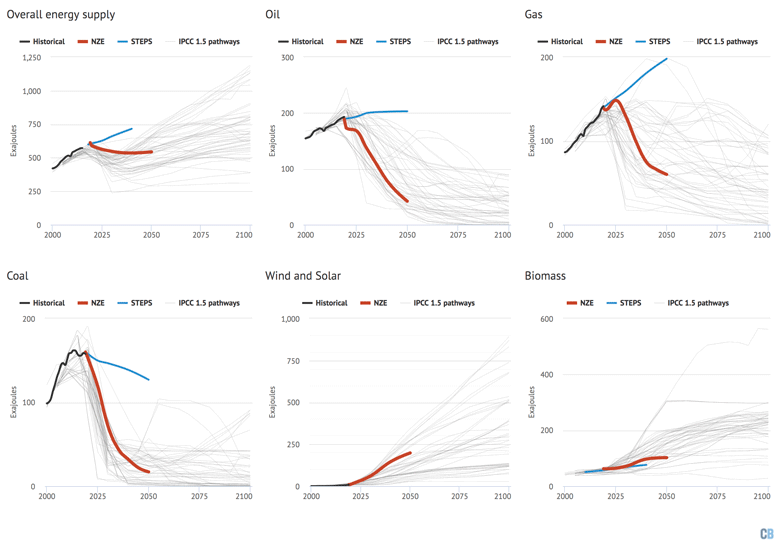
More broadly, it is clear that the NZE matches or exceeds the ambition of most IPCC 1.5C pathways in terms of energy supply, fossil fuel use and renewables, as shown in the charts below.
For example, the NZE has 120 exajoules (EJ) of remaining fossil fuel use in 2050, roughly one-third lower than the 184EJ median for IPCC no- or low-overshoot 1.5C scenarios.
In contrast, the Shell “Sky 1.5C” scenario has 115EJ of residual fossil fuel use in 2050 from gas alone, with a total of 375EJ from coal, oil and gas combined.
Nevertheless, the IEA’s roadmap does still include a significant role for CCS, bioenergy and negative emissions technologies – albeit at lower levels than most IPCC pathways.
In order to assess what would happen if CCS, bioenergy or other mitigation levers are restricted, the IEA explores a series of side “cases”.
Restrictions could be the result of societal preferences, or through a failure to deliver on necessary levels of innovation and deployment.
Each side case shows what would need to happen to reach net-zero by 2050 without some of the changes assumed to take place in the NZE.
For example, in the “low CCS” case (LCC), “no new fossil fuel CCUS projects are developed beyond those already under construction or approved for development”.
In order to compensate, global capacity to produce “green” hydrogen from electrolysers would need to be 60% higher in the LCC than in the NZE.
Electricity output to drive this capacity would add an extra 9,000TWh (13%) to the global total, equivalent to current overall electricity demand from China and India combined.
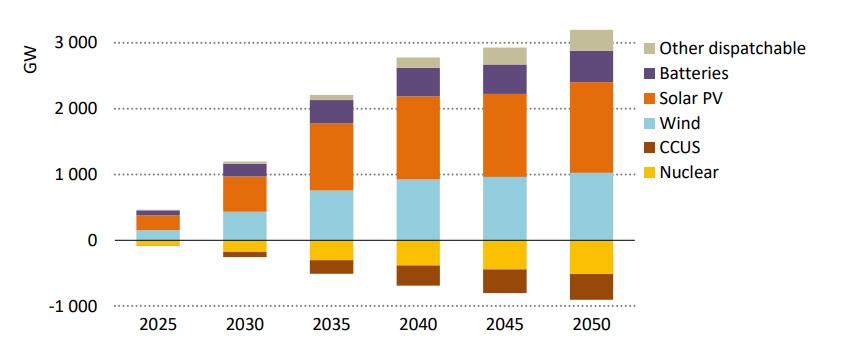
Another side case looks at what would be needed if CCS and nuclear both underperform relative to what is assumed in the NZE.
This is shown in the chart below, with an extra 2,400GW of wind and solar, as well as an extra 450GW of batteries being required to fill the gap.
Similarly, the roadmap looks at how to reach net-zero by 2050 without expanding the land needed for bioenergy crops beyond the 330Mha used today.
This would reduce bioenergy supply by around 10% and would raise demand for hydrogen by 15%, requiring an additional 3,200TWh of electricity in 2050.
(Notably, the increase in land use for bioenergy in the NZE of 80Mha is small relative to the area that could be freed by reducing demand for meat, according to the IEA. If households with above-average meat consumption reduced their demand to global average levels, this would free around 280Mha of land used for grazing and feed production.)
The IEA explores additional side cases looking at implications of an “all-electric” transport sector, delays to building retrofit or a lack of behaviour change.
The agency has not published an alternative case for reaching net-zero by 2050 where CCS, nuclear, bioenergy, behaviour change, building retrofits and international cooperation all underperform relative to their deployment in the NZE.
-
IEA: Renewables should overtake coal ‘within five years’ to secure 1.5C goal