Long-term climate variability ‘could fall’ as the world warms
Daisy Dunne
02.06.18Daisy Dunne
06.02.2018 | 1:53pmLong-term climate variability is the range of temperatures and weather patterns experienced by the Earth over a scale of thousands of years. New research suggests it could fall as the world warms.
A study using data taken from fossils and ice cores finds that long-term temperature variability decreased four-fold from the Last Glacial Maximum (LGM) around 21,000 years ago to the start of the Holocene around 11,500 years ago. Within this period, natural processes caused the planet to warm by around 3-8C.
If future global emissions are not curbed, human-driven global warming could cause further large declines in long-term temperature variability, the lead author tells Carbon Brief, which may have far-reaching effects on the world’s seasons and weather.
However, it is still unclear how a decline in long-term variability could affect the frequency of extreme weather events, she adds. This is because the chances of an extreme event happening could be influenced by both short- and long-term climate variability, as well as global temperature rise.
Digging up the past
The new study, published in Nature, is the first to make a global assessment of how long-term temperature variability changed from the LGM to the Holocene.
During the LGM, the world’s last major ice age, snow covered much of Asia, Europe and North America. Yet, within a few thousand years, global temperatures rose by around 3-8C, causing the ice to thaw and the world to enter its current geological period, the Holocene.
The cause of this temperature rise is still disputed by scientists, but research suggests the natural release of large stores of CO2 from the world’s oceans may have played a role.
To work out how long-term climate variability changed over the period, the researchers analysed data taken from ancient ice cores, marine sediments and animal and plant fossils stretching back thousands of years.
Scientists are able to analyse some of these samples – which are known as proxy records – by looking at the ratios between different chemical isotopes.
Combining data derived from different parts of the world and time periods allows scientists to create a picture of past temperature change, explains Dr Kira Rehfeld, a research fellow at the British Antarctic Survey and the Alfred-Wegener Institute for Polar and Marine Research (AWI) in Potsdam, Germany. She tells Carbon Brief:
“We set out and started collecting more and more records that we could use to get a more general picture of changing climate variability for temperature. It’s taken us three and a half years to find enough records and to develop the methodology to be able to analyse them.”
The researchers then compared data taken from the LGM and the Holocene to help them work out how global temperatures could have changed over large time scales. Rehfeld says:
“We don’t look at the variability in terms of just temperature rise, we look at the ratio of the variability. So we divide the variability of the LGM by the variability of the Holocene. That way we can compare records that have very different origins.”
Ancient landscape
The research finds that, from the LGM to the Holocene, long-term temperature variability fell by a factor of four.
However, some parts of the world experienced larger changes in temperature than others, the study notes.
This is shown on the chart below, where dark blues show areas that experienced a large amount of temperature change from the LGM to the Holocene, whereas light blue shows areas that experienced less change.
On the chart, symbols are used to show the location of ice cores (circle), marine sediments (diamond), lacustrine – or lake – sediment (triangle) and tree fossil data (square). Colours are used to show samples from the Holocene and LGM (red), the Holocene (orange) and the LGM (purple).
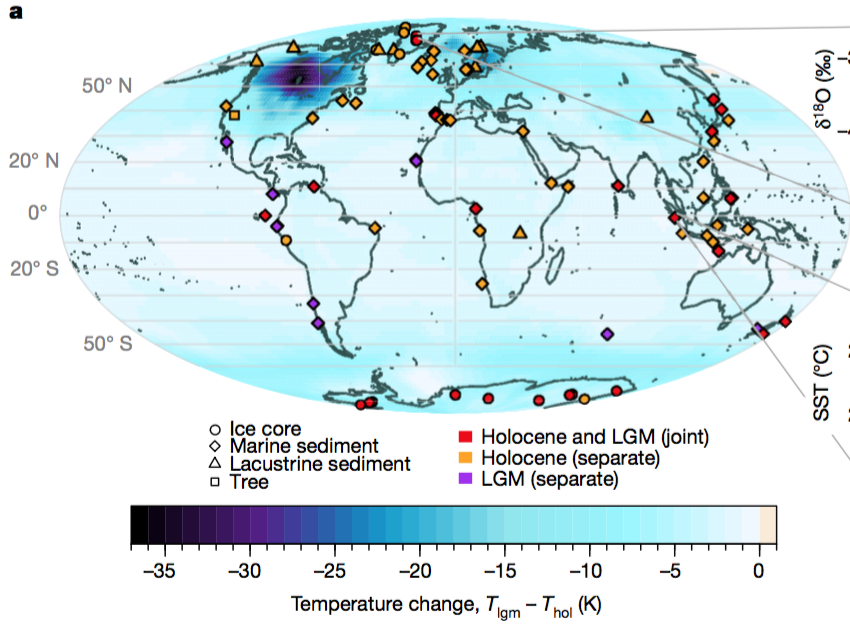
Global temperature change from the Last Glacial Maximum to the Holocene. Dark blue indicates high temperature change while light blue shows low temperature change. Symbols show the location of ice cores (circle), marine sediments (diamond), lacustrine sediment (triangle) and tree fossil data (square). Colours show samples from the Holocene and LGM (red), the Holocene (orange) and the LGM (purple). Source: Rehfeld et al. (2018)
The findings show that the world’s poles experienced a larger change in temperature than the equator over the time period. These changes led to an overall decline in long-term temperature variability, the research finds.
The difference in warming between the poles and the equator could be down to a process known as “polar amplification”, Rehfeld says.
Polar amplification is the phenomenon whereby greenhouse warming tends to have a larger effect on the poles than the equator.
This occurs because as warming causes sea ice near the poles to melt, energy from the sun that would have been reflected away by the ice is instead absorbed by the ocean. Because of this, atmospheric temperatures near the poles start to rise at an accelerated rate.
The findings reinforce the prediction that future climate change driven by humans will cause a larger increase in temperature at the poles than at the equator, Rehfeld says:
“The temperature difference between the poles and the equator has decreased as the Earth warms due to polar amplification. This relates to a change in overall long timescale temperature variability.
“If you take that and extrapolate that into the future, warming could be larger at the poles. The temperature difference is then further reduced, which would translate into a reduction of overall temperature variability.”
Carbon Brief previously reported on how the effect of climate change on polar amplification could cause the amount of wind available for power generation to fall in the northern hemisphere.
Future forecast
Although long-term variability is expected to fall, this does not mean that short-term variability will also be reduced, Rehfeld says:
“The question we’re asking is what would a warmer world than today look like? If we can translate our changes in the temperature gradient, then that would mean, theoretically, that long timescale variability in the future will be reduced. But that doesn’t mean that short timescale variability will be reduced.”
Short-term climate variability is a term typically used to describe the natural range of temperatures and weather patterns experienced by the Earth within shorter periods.
For example, after an extreme weather event, scientists often carry out single attribution studies to determine how the likelihood of such an event could have been influenced by climate change and short-term climate variability.
It is still not clear how a reduction in long-term variability will affect the frequency and severity of extreme weather events, Rehfeld says:
“There seems to be a correlation. This change in long timescale climate variability could have influences on extreme events and seasonal variability.
“Based on what we know about how extreme events work, if we have a broader distribution of temperatures then we should have more extreme events. However, what we perceive as extreme events, like floods or heatwaves, is not reflected in our datasets.”
In other words, scientific theory suggests that declines in long-term climate variability could lead to fewer extreme events. However, the timescale used in the study was too broad to reflect short-term events, such as floods and heatwaves.
Modelling change
The findings are “interesting”, but could hold “limited relevance” to understanding future climate change, which is occuring at a much faster rate than the warming observed from the LGM to the Holocene, says Prof Amanda Maycock, a research fellow from the University of Leeds who was not involved in the new study. She tells Carbon Brief:
“Current surface temperature changes and associated changes in climate variability and extremes are occurring much more rapidly than the multi-centennial timescales considered in the study.”
The datasets collated in the study could be used to help climate models simulate more long-term changes in climate variability, says Dr Lauren Gregorie, an academic research fellow at the University of Leeds, who was also not involved in the study. She tells Carbon Brief:
“What I find particularly interesting is that while models do simulate a reduction in variability, they tend to underestimate that change compared to the records [used in the study]. There is a great opportunity to use our knowledge of past climate change to test and improve climate models. Unfortunately, there’s currently very little funding to do this kind of work.”
Rehfeld, K. et al. (2018) Global patterns of declining temperature variability from the Last Glacial Maximum to the Holocene, https://www.nature.com/articles/nature25454