Melting Antarctic ice could slow global temperature rise, study says
Zeke Hausfather
11.19.18Zeke Hausfather
19.11.2018 | 4:00pmCold meltwater running off Antarctica’s ice sheets and into the ocean could dampen the pace of global temperature rise, a new study suggests.
The research, published in Nature, finds that the rate of ice-sheet melt in a high-emissions scenario could see the oceans cooled by the influx of frigid water. This could knock as much as 0.4C off global temperature rise, the researchers say, potentially delaying exceeding the 1.5C and 2C Paris temperature limits by around a decade.
However, the study adds that the meltwater could have wider impacts on the Earth’s climate, increasing the formation of Antarctic sea ice, reducing rainfall in the southern hemisphere and increasing rainfall in the northern hemisphere. It could also cause warming of the ocean beneath the surface layer around the Antarctic coast, the researchers add, leading to further ice-sheet melt and additional sea level rise.
Scientists not involved in the research tell Carbon Brief that while the results are intriguing, some caution is warranted given that the study relies on a single climate model. It also uses a speculative ice-melt scenario and focuses on a region – the Southern Ocean and Antarctica – which climate models can struggle to simulate accurately.
Additional work, including running similar simulations using other climate models and including the impact of meltwater from Greenland, may provide a more complete picture of the climate impacts of melting ice sheets, the scientists note.
Adding Antarctic meltwater to climate models
While climate models seek to include various different elements of the Earth’s systems, many are still limited in their modeling of changes in global ice sheets. While models include the role of ice melt on global sea level rise, they generally do not include the impact of the effect of meltwater from ice sheets and ice shelves on the climate
The broader climate impacts of ice-sheet and ice-shelf melt are not included in the current generation of climate models – CMIP5 – and are not expected to be accounted for in the upcoming CMIP6 models either.
Researchers can include meltwater in climate models by effectively adding projected meltwater to the ocean around ice sheets and see what happens, a practice referred to in the modelling community as “hosing experiments”. While prior studies have added ice-sheet melt from Greenland to global climate models, the new study is the first to apply a similar approach to the Antarctic ice sheet.
![]()
In recent years, a number of studies have suggested that the Antarctic could be a much later contributor to global sea-level rise than previously thought. The Antarctic ice sheet alone has the potential to contribute more than a metre to global sea level rise by 2100 in the high-emissions scenario called “RCP8.5”.
In their new study, Dr Ben Bronselaer at the University of Arizona and colleagues used a climate model developed by NOAA’s Geophysical Fluid Dynamics Laboratory (GFDL) and added in projections of Antarctic ice-sheet meltwater from RCP8.5. Specifically, they developed a collection of many different runs of the model, both including and excluding Antarctic meltwater. This allowed them to isolate the effect of meltwater addition, while accounting for uncertainty due to natural fluctuations in climate.
Slower temperature rise
The authors found that including Antarctic meltwater in the model simulations had a surprisingly large impact on both global and regional temperature changes. Global temperatures are lowered by around 0.4C in the latter half of the 21st century compared with model runs where meltwater is not included.
The figure below shows the regional temperature effects of the inclusion of meltwater in the top panel – and the effect on global average surface temperatures in the bottom panel.
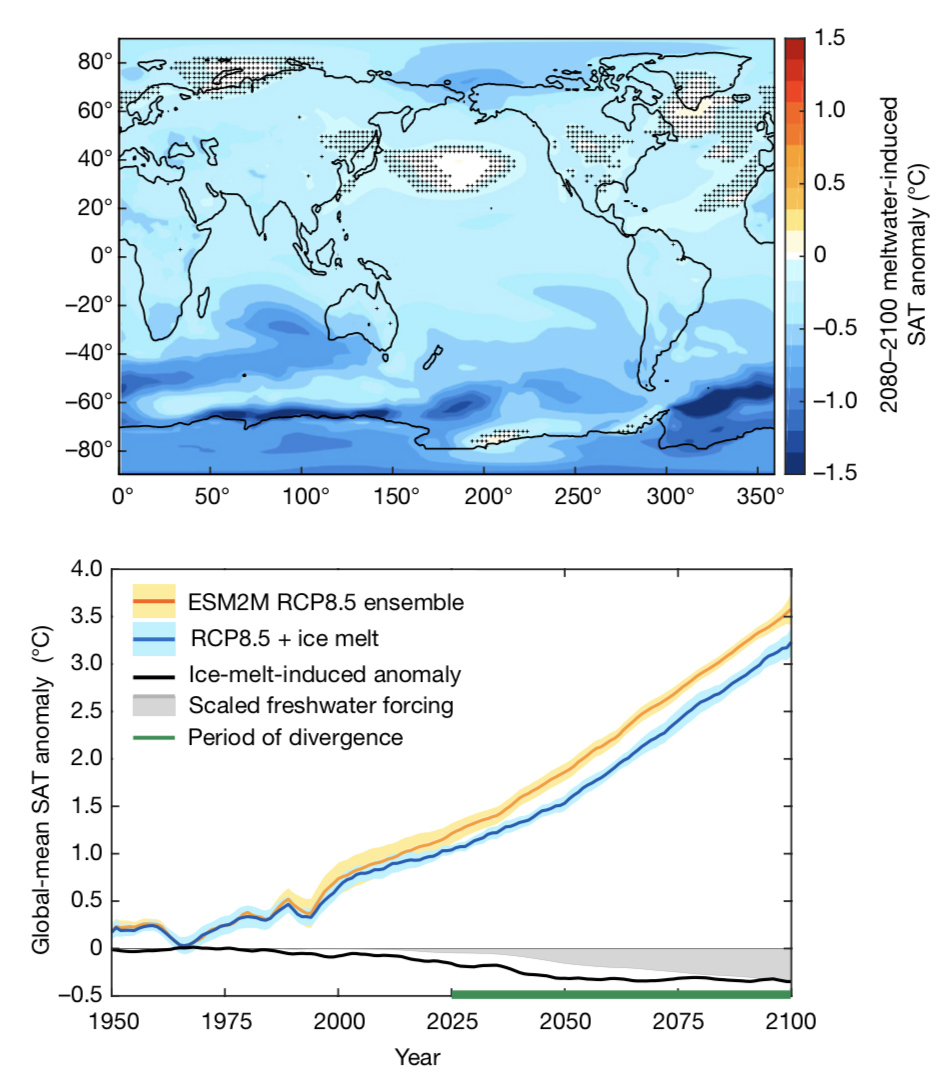
Map of changes in surface temperature in 2080-2100 in model runs with Antarctic meltwater addition compared to no-meltwater runs (top panel) and evolution of global mean surface temperatures (bottom panel). Dots on the top panel indicates where the results are not significant at the 95% level. Source: Bronselaer et al. (2018).
The dark blue shading in the map indicates that most of the cooling introduced by the inclusion of meltwater is concentrated in the Southern Ocean around Antarctica, though some other areas of the southern hemisphere and part of the Arctic also experience notable cooling
The chart of global temperature shows that model simulations with (blue line) and without (orange) Antarctic meltwater begin to diverge in the early 21st century. By around 2025, the difference in global temperature is detectable outside of the range of model variability. By 2055, model runs including meltwater are around 0.4C cooler – and stay around that much cooler through the end of the 21st century.
The authors suggest that this reduction in the global surface temperature would delay the point at which important climate thresholds, such as 1.5C or 2C, are reached by a little over a decade.
However, it is worth noting that the impacts of Antarctic meltwater on global temperatures were only assessed in a high-end warming scenario. It is unclear if the effects would be as large in emission scenarios designed to limit long-term warming to below 1.5C or 2C, as those could result in more limited ice melt.
Rainfall patterns
The findings also suggest that the added meltwater will have a large influence on global rainfall patterns. This happens because the influx of cold meltwater into the Southern Ocean has a knock-on impact of shifting the Inter-Tropical Convergence Zone (ITCZ), a huge belt of low pressure that encircles the Earth near the equator.
A shift of the ITCZ to the north means areas just to the south of the equator would experience a reduction in rainfall, while areas just to the north would see increases.
The changes in regional and global average rainfall due to the addition of Antarctic meltwater are shown below. The top part shows a map of projected changes in rainfall, with orange and red areas seeing a decrease in rainfall while blue areas see an increase. The bottom part shows changes in global average precipitation, with model runs including Antarctic meltwater in blue and those not including Antarctic meltwater in orange.
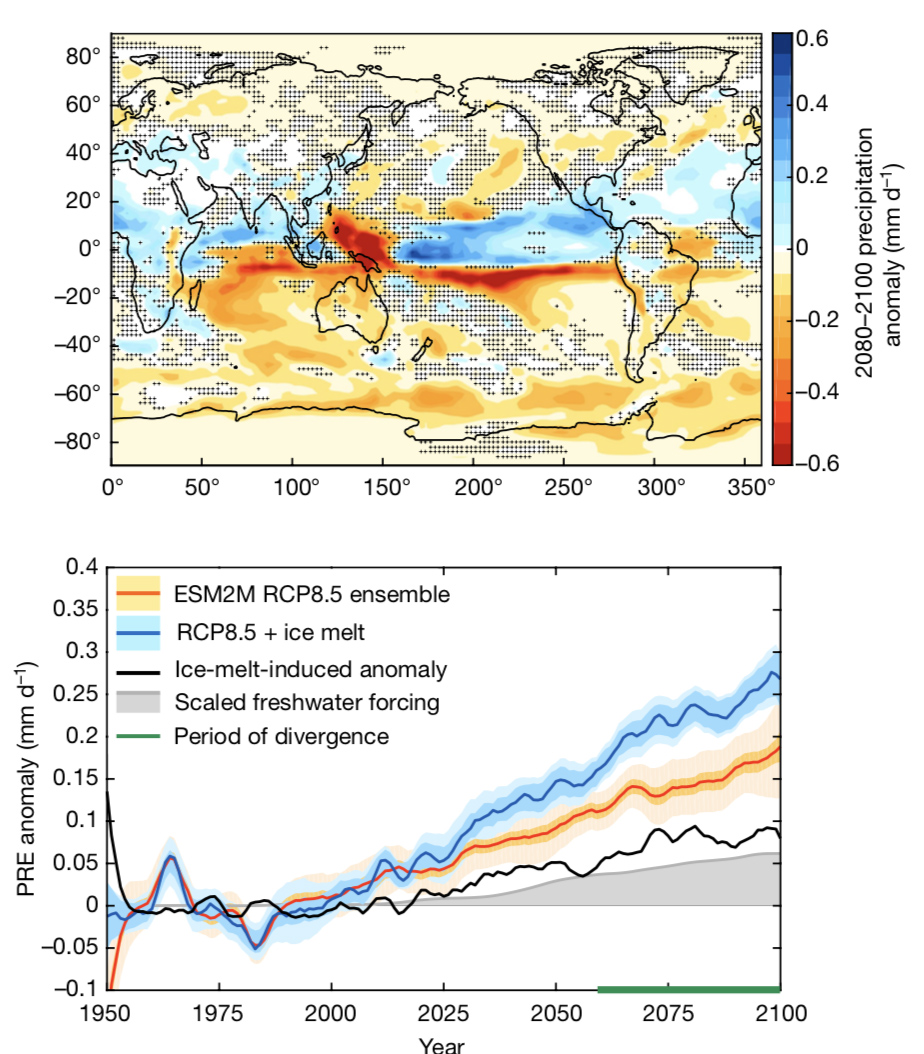
Map of changes in average annual precipitation in millimeters per day for the years 2080-2100 in model runs with Antarctic meltwater addition compared to no-meltwater runs (top panel) and evolution of global mean precipitation changes (bottom panel, orange and blue lines). Dots on the top panel indicates where the results are not significant at the 95% level. Source: Bronselaer et al. (2018).
Model runs that include Antarctic meltwater show considerably larger increases in rainfall globally than those that do not. Prior studies have shown similar results associated with Greenland ice-sheet melt, though in those cases the ITCZ moved south instead of north as the northern hemisphere became relatively cooler. Because the new study only includes meltwater from Antarctica, it is unclear how the combined effect of Greenland and Antarctic meltwater might influence changes in the distribution of rainfall.
The authors suggest that reductions in rainfall in land regions of the southern hemisphere, such as Australia, could have important consequences for agriculture and water scarcity.
Faster melting ice sheets, but more sea ice
The study also explains how adding large amounts of freshwater to the ocean by melting Antarctic ice sheets leads to somewhat unusual effects.
Water from melted ice is quite cold and, because freshwater is less dense than saltwater, it accumulates on the surface. This has the effect of reducing the mixing between deeper, warmer waters with cooler surface waters around the coast of Antarctica, leading to surface cooling and warming of water below the surface.
The mechanisms at work are shown in the diagram below, where the solid black lines represent the normal mixing of ocean water around the coast of Antarctic and the dashed black lines show the new flow when ice melt is added. The left panel shows conditions without substantial meltwater additions, while the right panel shows what happens when large amounts of Antarctic meltwater are added.
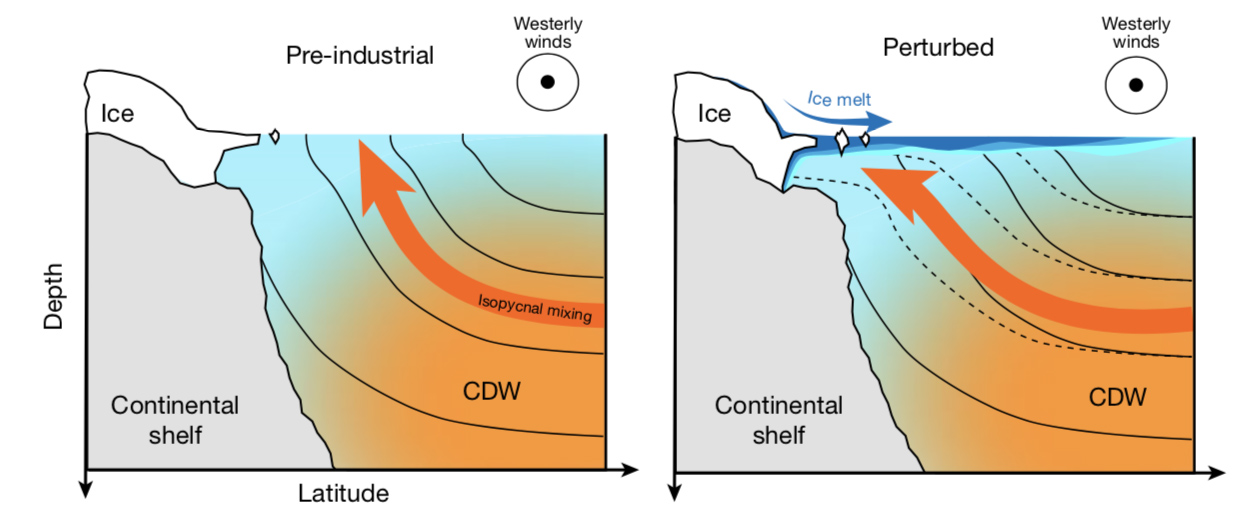
Schematic of the meltwater-induced Southern Ocean subsurface warming and surface cooling. Left panel represents pre-industrial conditions; right panel shows what happens when the system is perturbed by large volumes of ice melt. Colours from blue to orange reflect the relative warmth of the water. Source: Bronselaer et al. (2018).
The accumulation of cold freshwater at the surface enhances the growth of sea ice around Antarctica. While simulations without meltwater show a decline of Antarctic sea ice throughout the 21st century, those with meltwater actually have sea ice increasing through to 2050 and declining thereafter. By 2100 Antarctic sea ice is close to current day levels in meltwater simulations, while in non-meltwater model runs it has declined around 10% from current levels.
Increased meltwater also causes ocean warming below the surface where water is in direct contact with ice shelves. This occurs because a layer of cold meltwater on the top prevents the mixing of deeper, warmer water around the coast of Antarctica. The authors suggest that this warming may create a positive feedback where warmer ocean waters increase ice melt below the surface, which, in turn, leads to more meltwater and further subsurface ocean warming.
This feedback has not been taken into account in previous estimates of ice-sheet melt, the authors say, and could increase the sea level rise from Antarctic melting by up to a third.
However, many factors are at work in Antarctica and the Southern Ocean. The authors caution that there may be more factors not taken into account by current climate models which make producing accurate projections of future meltwater and associated feedbacks difficult. In the paper, they write:
“The Southern Ocean is a complex system and many ice-sheet-related feedbacks need to be accounted for…Global coupled models such as ESM2M are useful tools for identifying and quantifying the potential of this feedback by modelling the temperature response of the Southern Ocean to meltwater discharge…however, they lack high-resolution continental-shelf and ice-shelf-cavity dynamics. Consequently, global coupled model simulations need to be complemented with regional ice-sheet studies to fully constrain the magnitude of the ice-loss feedback.”
Urge for caution
The impacts of Antarctic meltwater on global temperatures and rainfall were surprisingly large, according to the study’s authors. In a press release accompanying the paper, co-author Prof Joellen Russell of the University of Arizona, called their results “the first new identified feedback on climate in 20 years”.
Climate scientists who were not involved in the study tell Carbon Brief that while the results are intriguing, they should be treated with caution until they can be supported by other studies.
Dr Kate Marvel, a climate modeller at NASA GISS, tells Carbon Brief that she is somewhat sceptical, as the paper presents a “study that relies on a single model which may or may not be a credible representation of reality”. She continues:
“It would, however, surprise me if a large influx of Antarctic meltwater had no climate impact and I think this study is useful in noting that this could potentially be an important factor in future climate. I do worry about [the media] acting as if melting Antarctica is going to mitigate climate change because the paper notes it could delay exceeding 1.5C or 2C targets by a decade. We don’t get this extra time for free!
This could have massive implications for rainfall patterns globally – the paper suggests it drags the tropical rain band into the northern hemisphere, which is really unfortunate if you live in one of the regions left behind and rely on that rainfall. Moreover, it will probably make southern hemisphere droughts even worse. These effects seem plausible, but more than that, it’s important to note that climate change is about so much more than global average temperature.”
Dr Kevin Trenberth, a climate scientist at the National Center for Atmospheric Research (NCAR), shares similar concerns. He suggests that climate models have challenges in simulating the region around Antarctica. In models of the region, “the clouds are poor, the heat budget is quite wrong, and the westerlies are not right”. This means that models may miss some important factors when trying to assess changes.
Trenberth suggests that he would have liked to see more of an assessment of the uncertainties in Antarctic ice melt. Because the paper is predicated on a high-end scenario for Antarctic ice melt, scenarios with lower melt would have correspondingly lower climate impacts. There is significant uncertainty on the magnitude of future ice melt and sea level rise from Antarctica, and this is an area of active scientific research.
Finally, Prof Michael Mann at Penn State University tells Carbon Brief that while the study is interesting, it would provide a more complete picture of the impacts of meltwater in a warming world if it took Greenland ice sheets into account, as well as Antarctica. Greenland melt has a big impact on ocean circulation, and would produce its own changes in temperature and rainfall that may counterbalance some of those from Antarctica.
In the paper, Bronselaer and his colleagues acknowledge the limitations of relying on only one climate model. They suggest that the simulations done in the paper should be run across multiple climate models as part of the Southern Ocean Modelling Intercomparison Project (SOMIP) to ensure that results are not model-dependent.
They add that “the effects of meltwater from the Greenland ice sheet have so far not been considered and could lead to further changes in simulated future climate”. Future work could look at the climate impacts of meltwater from both Greenland and Antarctica in the same coupled climate models.
Bronselaer, B. et al. (2018) Change in future climate due to Antarctic meltwater, Nature, doi:s41586-018-0712-z
-
Melting Antarctic ice could slow global temperature rise, study says
-
Melting Antarctic ice sheets may change temperature and rainfall in other regions