Met Office: A review of the UK’s climate in 2022

Guest authors
01.11.23Last year was a dramatic one for the UK’s climate.
The year of 2022 will be remembered for the passing of two significant milestones – a daily maximum temperature of more than 40C and a national average temperature over the year of more than 10C.
In this review, we unpack the UK’s climate of 2022 and show that both these notable records were highly unlikely to have occurred without the influence of human-caused climate change.
While 2022 was the UK’s warmest year on record overall, it also included a prolonged spell of cold and snowy weather in December. This was one of the most significant cold snaps since December 2010.
However, we show that the frequency and severity of cold weather is declining. For example, comparing 1991-2020 with 1961-1990, the number of days with UK average temperatures below 2C has decreased by one third and days below 0C have decreased by a half.
The year in summary
Our observational records show that 2022 was – for the majority of the country – warm, dry and sunny. The maps below show the average temperature (left), rainfall amount (middle) and sunshine duration (right) across the UK during 2022. The darkest shading shows the areas of the country that saw the warmest (red), driest (brown) and sunniest (yellow) conditions, relative to their local climate.

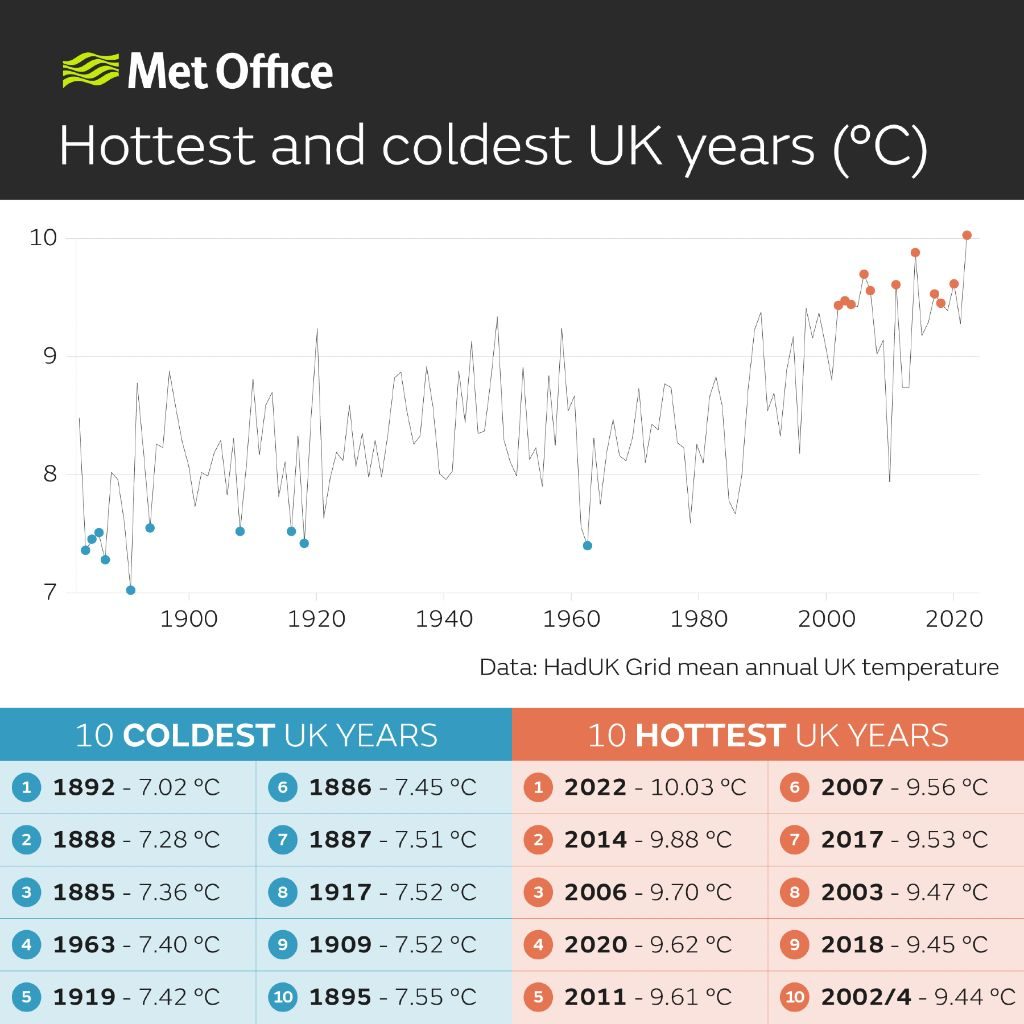
The UK annual mean temperature of 10.03C exceeded the previous record warmest year of 9.88C set in 2014. As the figure below shows, the 10 warmest years on record (red dots) have occurred since 2002, and we have not experienced a top 10 cold year (blue dots) since 1963.
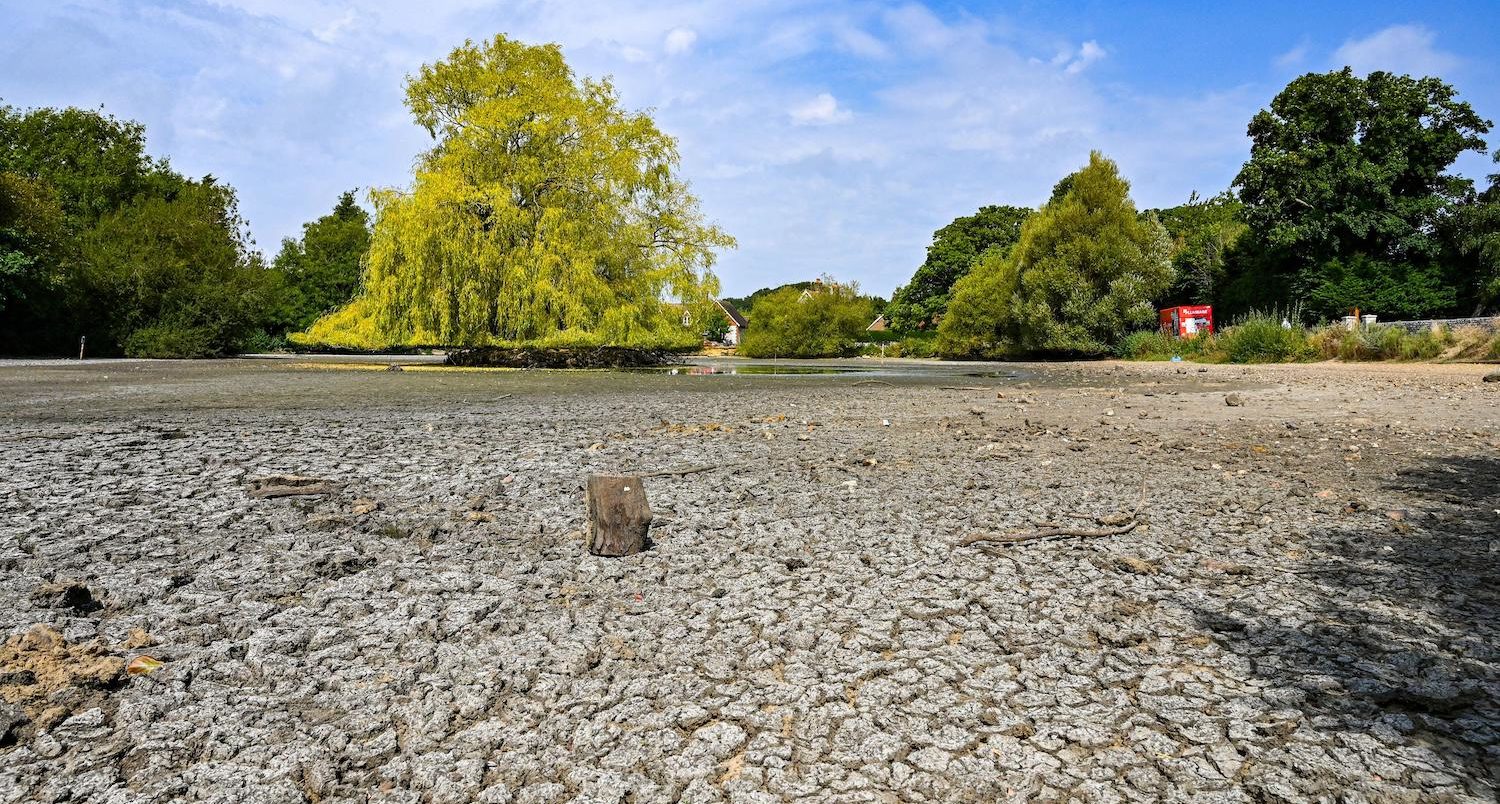
Overall, the UK received 90% of its long-term annual average rainfall in 2022, which is relatively dry for recent decades, but not exceptional in the longer-term context. While significant rainfall deficits were evident by the end of summer, a wetter-than-average autumn went some way towards a partial recovery. Nonetheless, it was the eighth driest year on record for East Anglia, which had just 76% of its annual average rainfall. This can be seen by the dark brown shading over East Anglia in the map above.
Sunshine was in abundance throughout the year, and the UK received 9% more sunshine than average. This made 2022 the seventh sunniest year on record, the second sunniest for England, and the sunniest on record for East Anglia – where 21% more than average sunshine was recorded.
Central England Temperature series
Currently, our official statistics for the UK go back to 1884 for temperature, 1836 for rainfall and 1919 for sunshine. These reflect the amount of digitised observational records we have in order to produce robust UK-wide statistics. Earlier instrumental weather records do exist for the UK, and ongoing data recovery activities to digitise historical observations is ongoing.
But we also have the Met Office Central England Temperature series (CET), which spans 1659-2022. This is the longest instrumental climate series in the world and the result of pioneering work by the scientist Gordon Manley in the mid-20th century. He uncovered historical weather records and diaries extending back several centuries, culminating in the construction of a temperature series representative of central England from 1659.
The series is maintained to this day. To provide consistency with the original series produced by Manley, the current series is based on three weather stations at Rothamsted (Hertfordshire), Pershore College (Worcestershire) and Stonyhurst (Lancashire), while the full UK series discussed above is based on hundreds of weather stations located across the whole UK. Our official UK series therefore is the most comprehensive assessment of the UK climate of the last 139 years and provides regional detail, but the CET, while much more limited in its coverage, provides an invaluable multi-century perspective.
It is worth noting that 2022 was the warmest year in both the UK-wide and CET records.
We often get asked about the differences between the two series, but in much the same way that the rankings and values for each of England, Scotland, Wales and Northern Ireland can differ, so can the CET and UK series.
However, although there are inevitable differences between the two datasets for any given date, the overwhelming message from plotting these annual temperature series together is how closely they agree – overlapping by around 97%.
You can see this in the chart below, which shows the full CET record (black line) with the UK-wide record overlaid (red line). The dashed lines show the 1991-2020 reference periods in the two records for comparison.
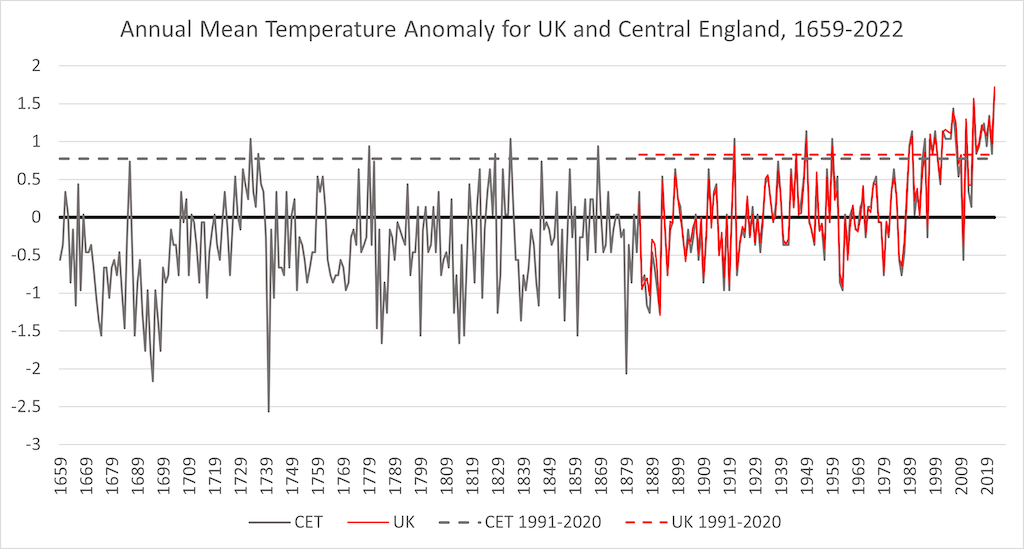
The CET series therefore provides strong evidence that it is highly unlikely that a UK-wide warmer year could have occurred in the last 364 years. The year-to-year, and even decade-to-decade variability, in our climate is evident in this long time series but it can also be seen that the warming of our climate means that a cold year now, such as 2010, is not as severe as cold years of past centuries, while a warm year now, such as 2022, is much more likely to break records.
The reference climatology for our current climate is the period 1991-2020, and it is noteworthy that in the 332 years before this – from 1659 to 1990 – there were only 12 years with an annual average temperature above this modern day baseline, highlighting how climate change is moving UK average temperatures outside of historical ranges.
Attribution
We conducted an attribution study for 2022 to quantify how human-caused climate change has influenced the likelihood of the UK recording annual average temperature in excess of 10C.
We use a Met Office system developed for rapid attribution of extreme events. It is built upon well-established and peer-reviewed risk-based methodology that estimates the probabilities of extreme events with and without the effect of human influence. The method uses large collections of climate model simulations that are evaluated for how realistically they represent the variability of UK temperature.
The new analysis uses temperature data from 14 models drawn from the sixth, and most recent, phase of the global Coupled Model Intercomparison Project.
One set of model simulations use only natural climate forcings (“NAT”) for the period 1850-2020, while another set use all natural and human-caused forcings (“ALL”) for the historical period and the SSP2-4.5 emissions scenario, often described as a “medium” or “middle-of-the-road” emissions scenario, out to 2100.
These simulations are then able to provide estimates of the likelihood of the UK annual temperature exceeding 10C for a natural climate without human-caused greenhouse gases, the current climate taken as the period 2013-2032, and an end-of-century climate under a medium emissions scenario taken as the period 2081-2100. A reference baseline for all the experiments is the period 1901-1930.
The chart below shows how the NAT (green) and ALL (red) forcings model simulations compare to the UK-wide observed record (black). The observations and ALL simulations capture the warming of the UK climate since the late 20th century. However, this signal is not present in the NAT simulations, suggesting the human-caused origin of the warming trend.
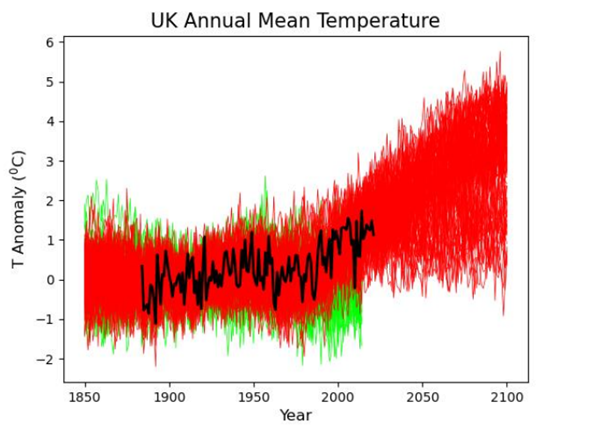
The estimated return period for a UK annual average temperature exceeding 10C in the NAT simulations is once every 528 years (with a range of 118 to 733). For the ALL simulations in the present day, this drops to once every 3.41 years (with a range of 3.22 to 3.64). For the ALL simulations in the future, this falls further to once every 1.26 years (with a range of 1.24 to 1.29).
The attribution study therefore suggests that the likelihood of an annual temperature in excess of 10C has increased by a factor of nearly 160 due to human-induced climate change. A warming climate means that an event that would have been exceptionally unlikely in the past has become one that we will increasingly see in the coming decades. By the end of the century, most years will be as warm as 2022.
Weather through the year
Unsurprisingly, with 2022 being the warmest year on record, it saw an abundance of temperatures well above their seasonal average.
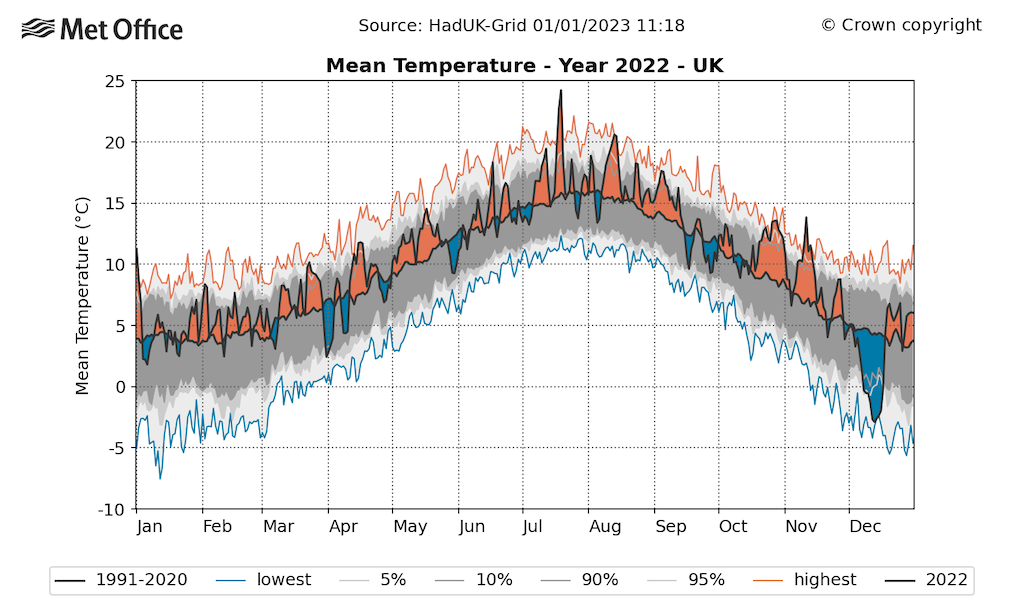
The chart below shows daily UK average temperatures through 2022, where the orange peaks are periods above average for the time of year and blue troughs show below average periods. (Note that the chart shows UK-wide average temperatures and so the daily highs and lows are not as extreme as seen in individual locations.)
Overall, approximately 70% of days were above the 1991-2020 average, with particularly notable warm or hot spells occurring in July, August, October and November.
Only 30% of days were below average and December saw one of the most significant cold spells since December 2010.
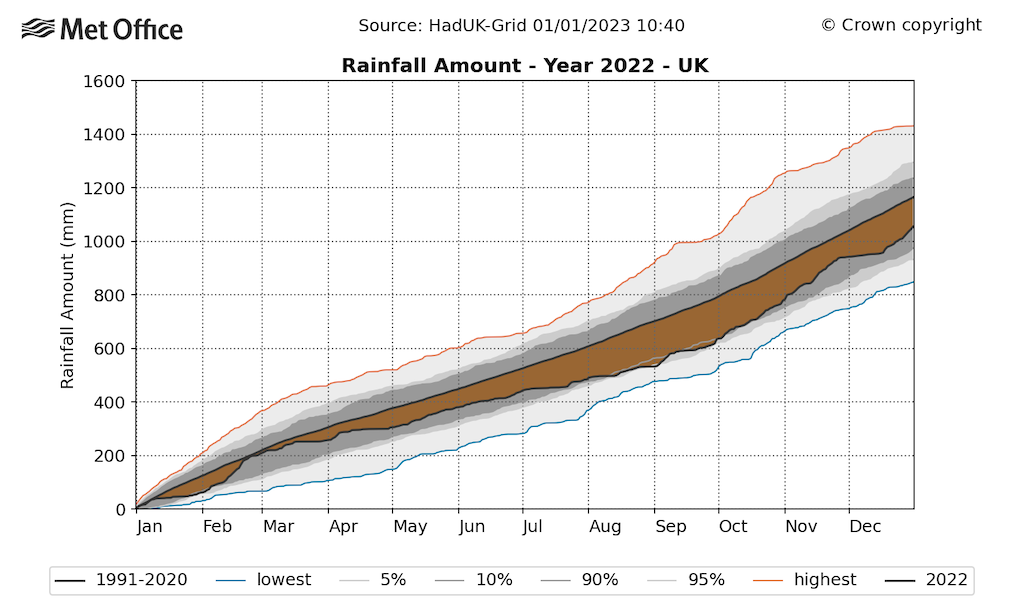
For rainfall, the wettest periods were seen in February and November, but over the period January to August there was a general deficit of rainfall. You can see this in the chart below, which shows the daily accumulated rainfall for the UK through 2022. The brown shaded area indicates a rainfall deficit building throughout the year.
By the end of August – following the 10th driest summer on record – the accumulated rainfall for the year-so-far was at its lowest since the notorious drought year of 1976. A relatively wet autumn went some way toward offsetting this, particularly through November, but the year still finished 10% below average.
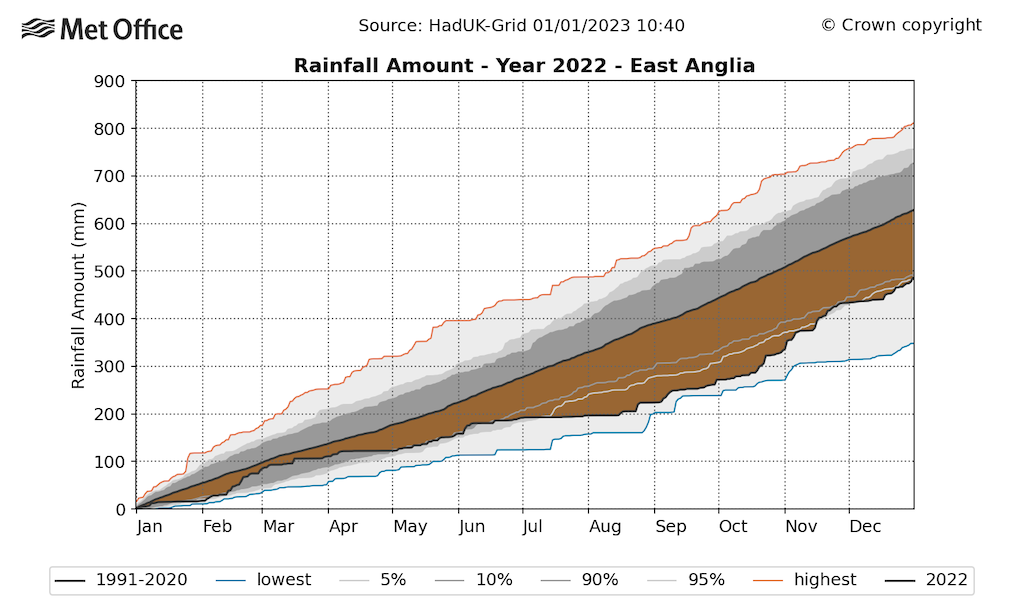
The statistics for East Anglia show the same general pattern through the year, but the rainfall deficits through the year were larger for that region – concluding with an overall 24% deficit compared to the 1991-2020 average.
Winter
Last year began with exceptionally high temperatures being recorded on 1 January, reaching 16.2C at St James Park, London and temperatures widely reaching 14C or 15C. A daily minimum temperature of 13.2C at Chivenor, Devon set a new January record for high daily minimum temperature.
The temperatures soon returned closer to normal and January was an otherwise relatively benign month – with the exception of storms Malik and Corrie at the end of the month. It was the eighth warmest winter season for the UK and 1C above the 1991-2020 average.
In contrast, February witnessed some exceptional weather, with three named storms in quick succession around the middle of the month. Two rare red weather warnings were issued for storm Eunice, which set a new England wind gust record of 122mph – recorded at Needles, Isle of Wight – but also caused widespread damage and disruption from the high winds.
Fortunately, severe coastal flooding from the associated storm surge was avoided in part because it did not coincide with high tide. Eunice was the most severe storm to affect England and Wales since February 2014.
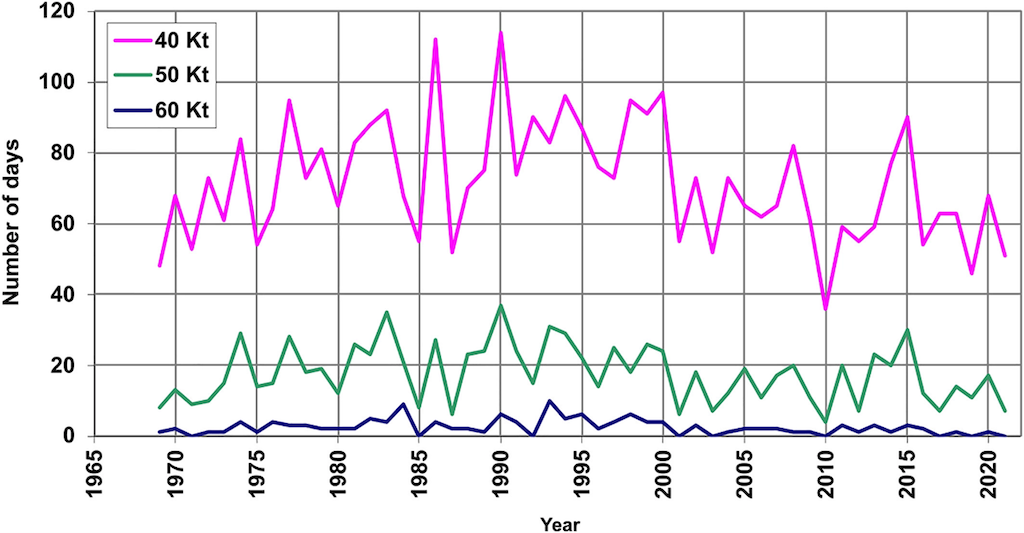
The chart below illustrates that, when considering the historical context, there is currently no strong evidence that climate change is affecting storminess in the UK. The chart shows the number of individual days during which a maximum wind gust speed of 40 (pink), 50 (green) or 60 (blue) knots was recorded by at least 20 stations across the UK, for 1969 to 2021.
Because storms are influenced by a range of factors, the potential influence of climate change on UK storminess is complex. Nonetheless, factors such as rising sea levels and increased rainfall mean that some of the associated hazards from storms could increase with climate change.
Spring
Spring continued the warm theme, with temperatures 0.8C above average and making it the fifth warmest spring in the UK record. Colder weather was largely confined to a cold snap in late March.
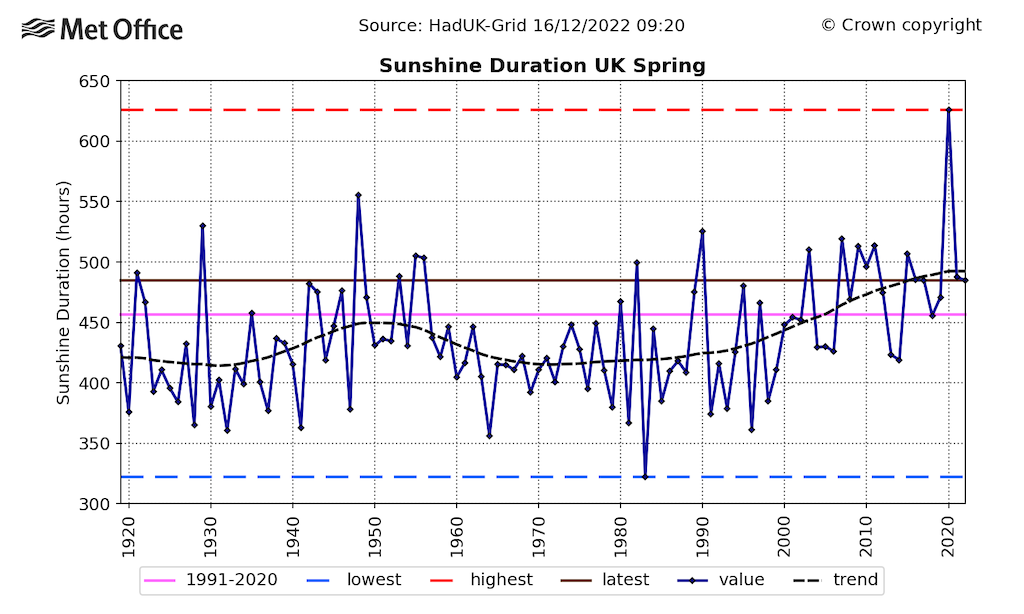
March saw plenty of clear skies resulting in the sunniest March on record for Scotland and Northern Ireland and the second sunniest for the UK. Sunshine amounts were closer to average in April and slightly below for May, but the season overall recorded 6% more sunshine than the 1991-2020 average, not comparable to the exceptional spring of 2020, but maintaining a general trend toward sunnier springs.
The chart below shows how UK sunshine in spring (brown line) compares to the 1919-2022 record (dark blue line). Overall, the most recent decade (2013-22) has had approximately 6% more spring sunshine than 1991-2020 and 16% more than the 1961-90 average.
The sunny weather was unsurprisingly also associated with generally dry conditions, particularly in March, with just 58% of average rainfall, and 68% during April. May did see some quite wet conditions in western Scotland, but it remained somewhat drier further south.
Summer
The summer of 2022 was exceptional for the UK. It was the fourth warmest on record for the UK, with notable heatwaves in both July and August. There is very little separating the UK’s hottest summers on record: 2018 (15.8C), 2006 (15.8C), 2003 (15.7C), 2022 (15.7C), 1976 (15.7C).
For England, it was nominally the joint warmest on record with 2018. The summer was also notable, but not record breaking, for dry and sunny conditions – with 62% of average summer rainfall and 115% of average sunshine.
However, the summer of 2022 will go down in UK history books for being the first year that recorded a daily maximum temperature in excess of 40C.
In fact, seven locations hit or exceeded 40C and 46 stations exceeded the previous UK all-time temperature record of 38.7C at locations from Kent to North Yorkshire. For example, a temperature of 40.3C at Coningsby, Lincolnshire on 19 July was 18C above the climatological July average for the site.
The northerly extent of the heat was remarkable, with 38.8C reached at Leeming in North Yorkshire and 34.8C at Charterhall in the Scottish Borders, setting a new Scottish temperature record. Northern Ireland came within just 0.1C of its own record, which had been set just 12 months previously in July 2021.
A Met Office study has already shown that the likelihood of reaching 40C in the UK had increased by a factor of approximately 10 due to human-caused climate change. A rapid attribution analysis conducted after the 2022 summer heatwave by the World Weather Attribution team reported similar findings.
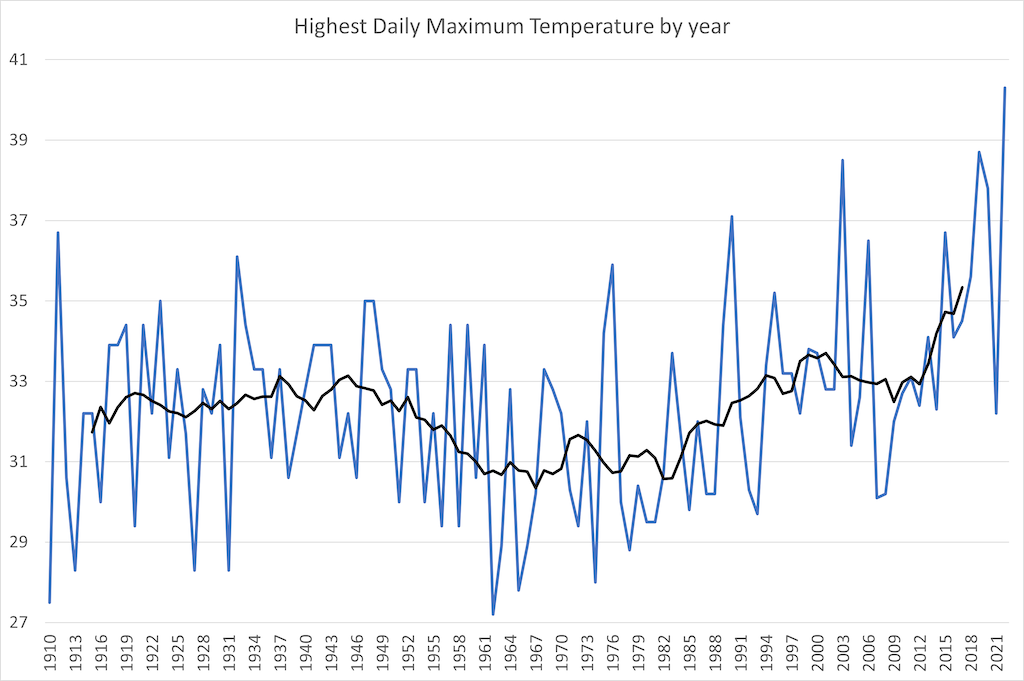
The blue line chart below shows the UK highest daily maximum temperature by year, from 1910 to 2022. The black line shows a rolling 10-year average. While the UK has, on average, warmed by close to 1C, the highest temperatures recorded have been increasing at a much faster rate and by as much as 1C per decade.
Autumn (and December)
The warm theme continued into the autumn, with each of September, October and November being warmer than average. Overall, it was the UK’s third warmest autumn in a record that goes back to 1884, with only 2006 and 2011 having been warmer.
However, the weather was generally much more unsettled during autumn and rainfall was above average, with some heavy rain spells resulting in impacts from surface-water flooding.
It was the wettest autumn for the UK since 2000 and the 13th wettest in the UK series from 1836. This rainfall went some way toward reversing significant rainfall deficits that had built up through the summer months.
During the first half of December there was a prolonged spell of cold weather and snowfall. This was the coldest spell of weather for the year, reaching a minimum of -17.3C at Braemar in Aberdeenshire, Scotland on 13 December. The same location recorded a daily maximum of -9.3C the day before.
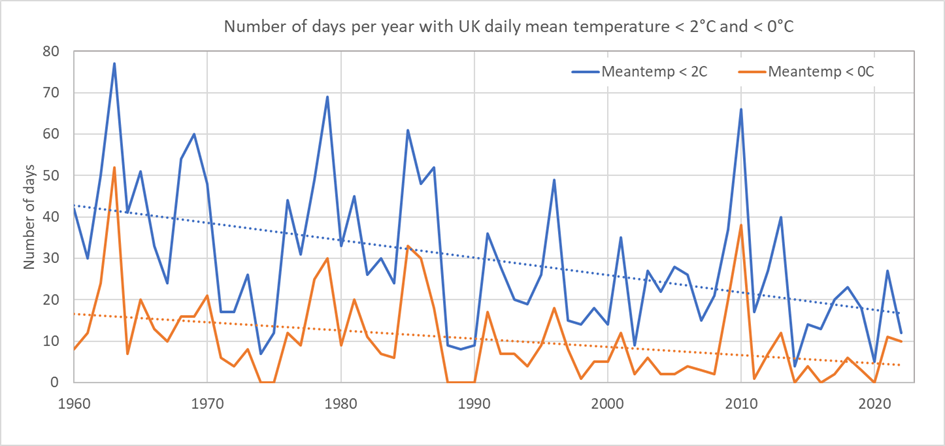
The duration and severity of this cold spell made it one of the most significant cold snaps since December 2010. Although the UK has experienced a number of severe cold spells in recent decades, the number and severity of them is declining. You can see this in the chart below, which shows the number of days per year with a UK average temperature of less than 2C (blue line) and less than 0C (orange).
For example, comparing 1991-2020 with 1961-1990, the number of days with UK average temperatures below 2C has decreased by one third and days with temperatures below 0C have decreased by a half.
Overall, 2022 was an exceptional year for the UK climate. Further analysis and statistics will be published in the Met Office annual State of the UK Climate report in July 2023.