One-third of world’s new vegetation in China and India, satellite data shows
Daisy Dunne
02.12.19Daisy Dunne
12.02.2019 | 4:40pmChina and India are “leading the world” in “greening” the landscape, a study finds, with the two countries accounting for one-third of the new forests, croplands and other types of vegetation observed globally since 2000.
The results, published in Nature Sustainability, also show that China alone accounts for a quarter of the human-caused greening observed since 2000 – despite containing only 6.3% of the world’s landmass.
In China, 42% of the greening comes from the expansion of forests while 32% comes from cultivated farmlands, the study finds. In India, 82% of the greening comes from new croplands.
However, it is important to note that greening observed in China and India is “not enough to offset” the loss of the world’s tropical rainforests, particularly in Brazil, a scientist tells Carbon Brief.
The findings also suggest that the “CO2 fertilisation effect” – where increasing CO2 levels in the atmosphere bolster the growth of plants – could be a “less prominent” driver of “global greening” than previously thought, a study author tells Carbon Brief.
This is because human-driven land-use change – through the planting of croplands, forests and other types of vegetation – could be having a larger impact on global greening than previously recognised, the author says.
Green planet
Across the world, the rate of plant growth appears to be increasing. Scientists who study this phenomenon call it “global greening”.
One reason that plants could be growing faster is that humans are releasing billions of tonnes of CO2 into the atmosphere every year – and plants use CO2 to carry out photosynthesis. The process whereby increasing CO2 levels boosts plant growth is known as the “CO2 fertilisation effect”.
However, humans can also have a direct impact on the amount of vegetation found on Earth through the way in which they manage land.
The new study examines how both human-driven land-use change and the natural growth of vegetation have contributed to greening across the world over 2000-16.
To do this, the researchers made use of data taken by the Moderate Resolution Imaging Spectroradiometer (Modis) – a key sensor onboard NASA’s Terra and Aqua satellites.
The high-resolution sensor captures “greening” – net gain of leaf-covered area – and “browning” – net loss of leaf-covered area – across the globe, explains study lead author Chi Chen, a PhD student at Boston University. He tells Carbon Brief:
“One challenge of the optical satellite remote sensing is the data corruption by clouds and aerosols. Our study therefore further refined Modis [data] by rigorously checking the quality flags. We also use GIS [Geographic Information System] data…to calculate and rank the net change of leaf area and the proportions of greening and browning by countries.”
Leafy landscape
The map below shows the results, with green representing regions of net greening and yellow, red and purple showing regions with net browning. On the map, white areas depict barren land, permafrost, ice, wetlands and built-up areas.
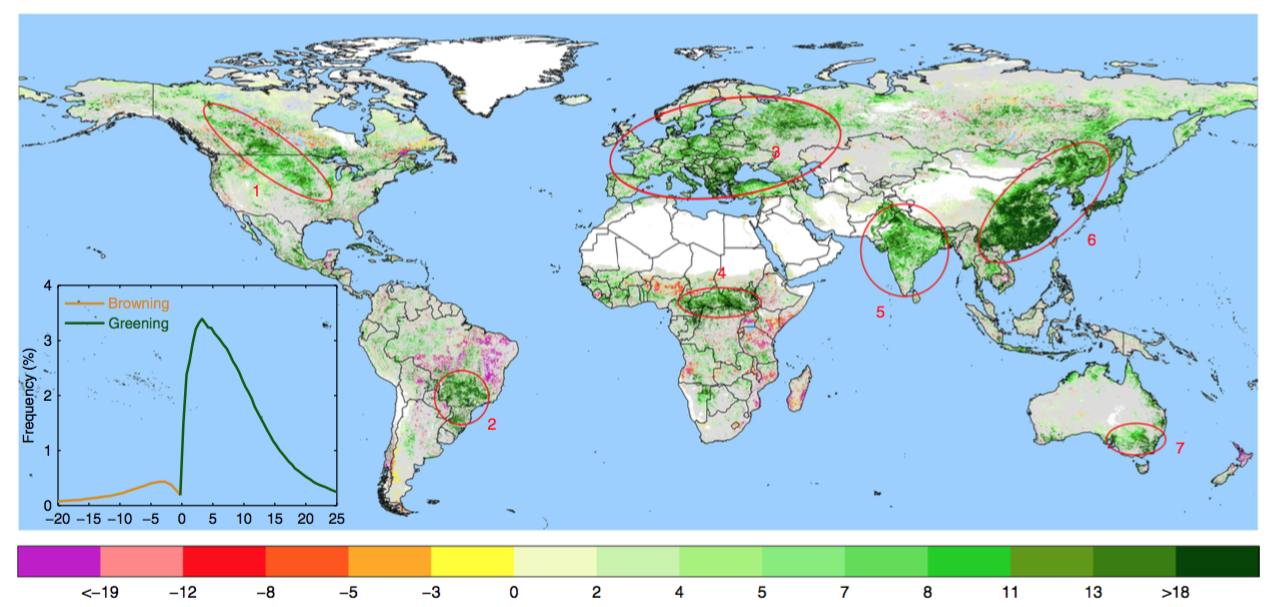
The global distribution of “greening” (light to dark green) and “browning” (yellow to purple) from 2000-16, as observed by “Modis”. On the map, white areas depict barren land, permafrost, ice, wetlands and built-up areas. The inset shows the frequency distribution of statistically significant trends. Source: Chen et al. (2019)
The map identifies seven “greening clusters” circled in red – including (1) across central North America, (2) southern Brazil, (3) the European Union, (4) Central Africa, (5) India, (6) China and (7) south Australia.
More information on the regional breakdown of new vegetation growth is offered in the table below. The table ranks the 11 largest countries by leaf-covered area in 2000 (left), net change in leaf-covered area from 2000-16 (middle) and this net change as a percentage of the total leaf-covered area (right).
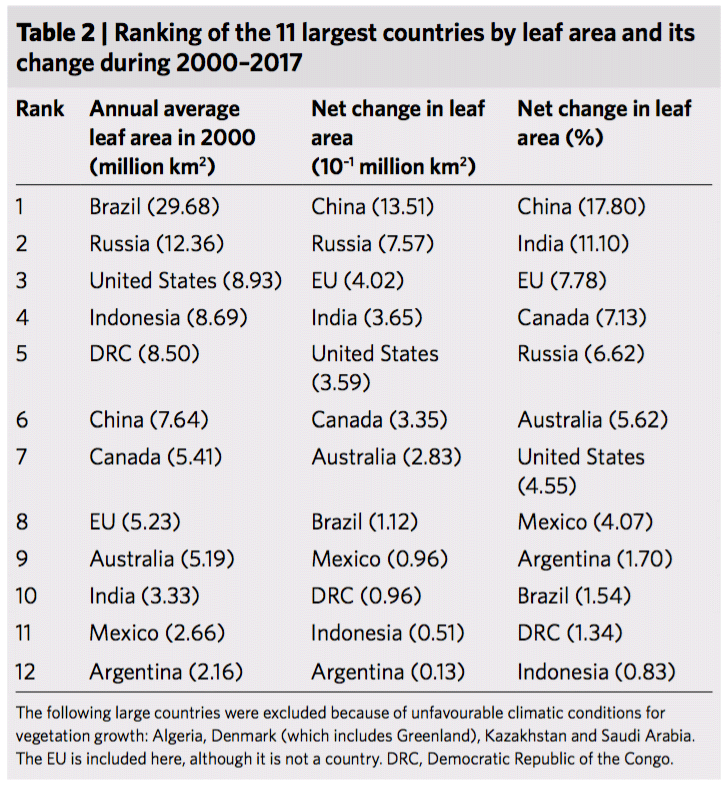
The 11 largest countries by leaf-covered area in 2000 (left), net change in leaf-covered area from 2000-16 (middle) and this net change as a percentage of the total leaf-covered area (right). Source: Chen et al. (2019)
The results show that “China and India stand out”, Chen says:
“China and India, the two most populous and emerging countries – rather than the developed nations – are leaders in greening the lands through planting of trees and intensive crop cultivation. China and India account for one-third of the greening but contain only 9% of the global vegetated land area.”
China alone accounts for a quarter of the global net increase in leaf area from 2000-16, the study finds. This is equal to the greening observed in Russia, the US and Canada over the same time period.
Around 42% of the greening seen in China comes from the expansion of forests. The map below offers a closer look at greening from forest expansion in China over the study period. (Last year, Carbon Brief published an explainer detailing how China has, according to its government, planted 35bn trees since the 1990s.)
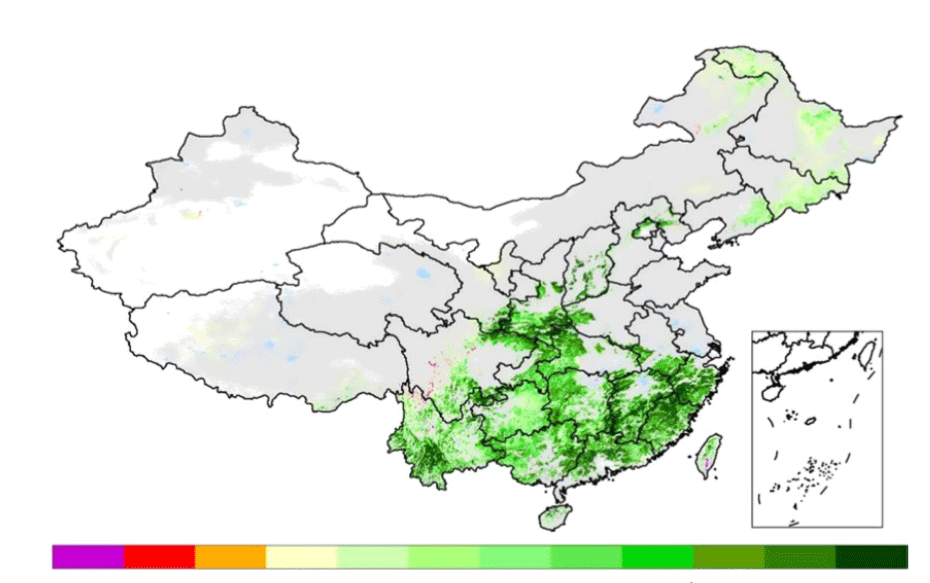
Net gain (green) and loss (yellow to purple) in leaf area from forests in China from 2000-16. Grey shows changes to other types of vegetation. White shows land with no vegetation. Source: Chen et al. (2019)
India, meanwhile, accounts for 6.8% of the global net increase in leaf area, the study finds. This is roughly equal to that in the US or Canada – which both had three times more vegetated area in 2000.
While these greening trends are significant, it is important to note that they cannot make up for the loss of natural rainforests in the world’s tropical regions, says Prof Anja Rammig, a researcher of land-surface interactions from the Technical University of Munich, who was not involved in the study. She tells Carbon Brief:
“When you read this, it seems a bit like you could conclude ‘well this greening trend is driven by land-use activity and human-land management, so we are doing great’ – but it is important to note that this will not offset, for example, loss of the Amazon rainforest. This greening trend we see from human activity cannot offset the loss of rainforest.”
This is also noted by the researchers of the study, who say in their paper:
“It is important to note that the gain in greenness, which mostly occurred in the Northern temperate and high latitudes, does not offset the damage from loss of leaf area in tropical vegetation – for example, in Brazil, Democratic Republic of the Congo [DRC] and Indonesia.”
(It is worth noting that the study did not look at how much natural forest has been converted into croplands.)
Fertilisation effect
Another key finding of the research paper is that “human land-use” has been “a dominant driver” of global greening since 2000, the authors say.
One reason for this conclusion is that the study shows that cropland expansion has contributed the most to greening over the study period, they say. Six out of seven “greening clusters” (shown on the first map) “overlap” with regions known to have highly intensive agriculture. Rammig says:
“If you expect CO2 fertilisation to have a big effect, you’d also see strong greening in, for example, the Amazon region. But it’s not as strong there as in these highly managed regions.”
The expansion of agriculture over the time period can “be attributed to quick-growing hybrid cultivars [plant varieties], multiple cropping, irrigation, fertiliser use, pest control, better quality seeds, farm mechanisation, credit availability and crop insurance programmes”, the authors say.
In other words, much of the greening observed on Earth has had more to do with direct human interference than the indirect effect of climate change or the CO2 fertilisation effect, says study co-author Prof Ranga Myneni, a research of vegetation remote sensing from Boston University. He tells Carbon Brief:
“Some have argued that greening is a good side effect of increased CO2 concentration. These generally tend to be [climate] sceptics. We now see that land-use by humans is a major factor of greening – something not recognised before.”
Chen, C. et al. (2019) China and India lead in greening of the world through land-use management, Nature Sustainability, https://doi.org/10.1038/s41893-019-0220-7
-
One-third of world’s new vegetation in China and India, satellite data shows
-
China and India account for one-third of ‘global greening’ since 2000